Received: 08.09.2013 Editors-in-Chief: Naim Çağman
Accepted: 11.10.2013 Area Editor: Ekrem Buhan
Effect of Different Dietary Carotenoids on Total Carotenoid
Concentration and TBARS During Frozen Storage Rainbow Trout Flesh
Nihat YEŞİLAYERa Nilgün KABA1,b
Mehmet Emin ERDEMb
([email protected]) ([email protected]) ([email protected])
aGazi Osmanpaşa University, Department of Fisheries, Faculty of Agriculture 60250 Tokat bSinop University, Fisheries Faculty 5700 Akliman, Sinop
Abstract – In present study, thiobarbituric acid (TBARS) properties (mg malonaldehyde kg-1) in rainbow trout (Oncorhynchus mykiss) fed with standard diets supplemented with canthaxanthin, astaxanthin and red pepper meal besides control group were investigated. In experiment, total of 375 rainbow trout with an initial average weight of 154 g were fed by dividing into 4 groups. The fishes were fed for 60 days with four diets (canthaxanthin70 mg kg-1, astaxanthin 50 mg kg-1, red pepper meal 765 mg kg-1 and control). After the feeding period, the fishes in diet groups were evaluated in terms of total carotenoid concentration and TBARS. At the end of the trial, fodder supplemented with canthaxanthin, astaxanthin and red pepper meal caused carotenoid accumulation over 6 mg kg-1 concentration in the muscle tissues of the fishes. Frozen storage (at -30 ºC) of gutted, cleaned and glazed raw fishes for 12 months significantly reduced the total carotenoid concentration and TBARS value.
Keywords – Rainbow trout, Oncorhynchus mykiss, TBARS, Total carotenoid concentration
1. Introduction
Carotenoids are mainly responsible for red or pink colors in nature. However, in green plant tissues, the color of carotenoids is masked by the more dominant pigment, chlorophyll, and the carotenoids become evident only during the degradation of chlorophyll. This phenomenon can be seen during the ripening of fruits as well as in autumn leaves. In addition to their function as the natural pigments, protamine and a
precursor role of certain carotenoids, these compounds can be used as food coloring additives (European Parliament and Council Directive, 1994). The natural characteristic of carotenoid color is significantly present in fruits and vegetables. Furthermore, diets rich in fruit and vegetable containing carotenoids have been of interest due to their potential health benefit against chronic diseases (Haila 1999).
The color of salmon and salmon trout in addition to their freshness is one of the important criteria considered by consumers. The pink-red color of salmon trout, particularly astaxanthin from carotenoids, characterizes them in terms of their color (Yeşilayer et al. 2008). As the carotenoids are not synthesized by the fishes, the required color is acquired by adding both natural and synthetic carotenoid sources into fodders (Bird and Savage 1990). It is known that the pink-red meat color of salmon trout is resulted from the planktons which are their and benthic freshwater mollusks food source (Choubert and Blanc 1985).
An important feature of the flesh of salmonoids is the pink-red coloration is due to carotenoids, especially astaxanthin, and it is an important factor to evaluate the market value of farmed trout. Color is the quality of the product at point of sale by the consumer. To achieve consumer acceptance, the farmed product must be pigmented to have the natural red-pink color of wild salmonoids while feeding with crustaceans. Pigmentation can be achieved by supplementing the feed of the fish with astaxanthin or canthaxanthin, which are carotenoid pigments (Andersen et al. 1990). However, the cost of those compounds has led to renewed interest in low-cost sources of pigments in salmon diet.
Biological pigments such as shrimp waste meal (Penaeus sp.) (Aubourg et al. 2005), krill meal (Bell et al. 2000), paprika (Bjerkeng and Johnsen 1995), red yeast (Phaffia rhodozyma) (Bragadottir 2001) and red pepper (Capsicum annum) (Buchecker 1982) have been investigated. For many years, fish technologists have attempted to enhance the coloration of salmonoids by using crustacean waste, yeast, algae and synthetic carotenoids (Christophersen et al. 1992).
In rainbow trout, fat deposition reflects by its importance and its composition dietary lipids (Toyomizu et al. 1963). They play an important role in the fish quality determination on a nutritional and an organoleptic point of view (Greene and Selivonchick 1987). As carotenoid pigments are lipid soluble compounds, increase dietary fat would increase carotenoid absorption and then pigment deposition in trout flesh. In fact results are not so clear. Even if Spinelli (1979) noted that fat addition to rainbow trout diet increased the AX amount in fish muscle, this result was not observed by Torrissen (1985).
Rainbow trout are widely produced in Turkey. Synthetic and natural carotenoid sources are used for rainbow trout in order to enhance its market value. In the present study, the use of shrimp waste meal and red pepper meal as natural carotenoid sources and astaxanthin as a synthetic carotenoid source was tried.in the feed of rainbow trout. The aim was to achieve both pigmentation of fish flesh and utilization of excessive red pepper production and shrimp wastes.
2. Materials and Methods
2.1. Experimental FishesThe experiment was performed in a private trout farm. In total, 800 trout with an average weight of 100 g (4 months old) were investigated. The fish were divided into four groups. Each group containing 200 individuals was reared in concrete ponds. Three groups were fed with diets supplemented with shrimp waste meal, red pepper meal and astaxanthin. One group was selected as control and fed a diet without pigment.
2.2. Fodder and Feeding
During the first 2 weeks, all groups were fed with a control diet to achieve the adaptation of the fish to the diet and the pond. After 2 weeks they were fed with the diets supplemented with pigments for extra 100 days. In previous studies (Sigurgisladottir et al. 1994; Clark et al. 1999; Rodriguez et al. 2007), it has been stated that maximum levels of pigments in the bodies of marketable size fishes were reached in 75-100 days. For this reason a feeding period of 100 days was selected.
The trial took place in Sinop University at Faculty of Fisheries between the dates from March 17, 2006 to May 16, 2006. During 60 days trial process sample fishes were taken based on 20 days periods. 375 fishes with a beginning average weight of 154.26 ±1.25 g were randomly selected and they were divided into 4 groups each containing 75 individuals to place in trial tanks that had 300 L water volume.
The samples were selected among rainbow trout that were fed with the fodder mixed with carotenoid through 20 days fixed ratio schedule, namely on the 20th, 40th and 60th days to detect the amount of carotenoid (mg kg-1). In the later phase of the study, the fishes were gutted. After they were covered with foil paper and labeled, they were kept in a deep-freezer at -30 ºC for 12 months. At the end of 12 months for which the samples kept as frozen, two sample filets were taken from each group of fishes divided according to periods to identify the total amount of carotenoid for each period. Thiobarbituric acid analyses were made in three groups, called as beginning trial (20th day), intermediate trial (40th day) and end of trial (60th day). (Smith et al. 1992).
2.3. Total Carotenoid Analyses
To determine the total carotenoid amount, the method proposed by Skrede and Storebakken (1986) and Foss et al. (1984) was used. Measurements concerning the samples’ absorbance toward pure acetone (474 nm) were conducted via spectrophotometer (Jasco-V-530 UV/VIS) (Foss et al. 1984) and the findings were calculated as the total amount of carotenoid as mg kg-1 astaxanthin in a fish. In the calculation process, extraction coefficient for astaxanthin and canthaxanthin was E %1,1 cm= 1900, while the extraction for red pepper was E%1,1 cm= 1922 (Saito and Regier 1971; Foss et al. 1984; Skrede and Storebaken 1986; Skrede et al. 1990; Sommer et al. 1992).
2.4. TBARS Analyses
10 g of the fish sample was blended with 50 ml distilled water for 2 min. The mixture was transferred into a Kjeldahl flask, one drop of silicone anti-foaming agent was added plus 2.5 mL HCl (4N) and the jar was rinsed with an additional 47.5 ml of distilled water. This sample was then distilled and 50 ml of distillate was collected. 5 ml of distillate were added to 5 ml 0.02 M thiobarbituric acid (Merck, Germany) and heated in a boiling water bath for 35 min and then cooled at room temperature. Absorbance of the solutions was determined at 538 nm on a UV spectrophotometer (Jasco-V-530 UV/VIS). The value read was multiplied with 7.8 to calculate the amount of TBA as mg malonaldehyde kg-1 (Smith et al. 1992).
2.5. Statistical Analysis
The data is presented as mean±standard error (SE). The Anderson-Darling and Levene statistic tests were applied to test normality and homogeneity of variance, respectively. ANOVA and the Tukey multiple-range test were used to detect significant differences (P <0.05) total carotenoid concentration. All statistical analyses were performed using the MINITAB Release 13.1 Statistical Analysis Software Program for Windows. A regression analysis (RA) was done to determine the relationship between average values of the total carotenoid concentration (mg kg-1).
3. Results and Discussion
3.1. Total Carotenoid Amount
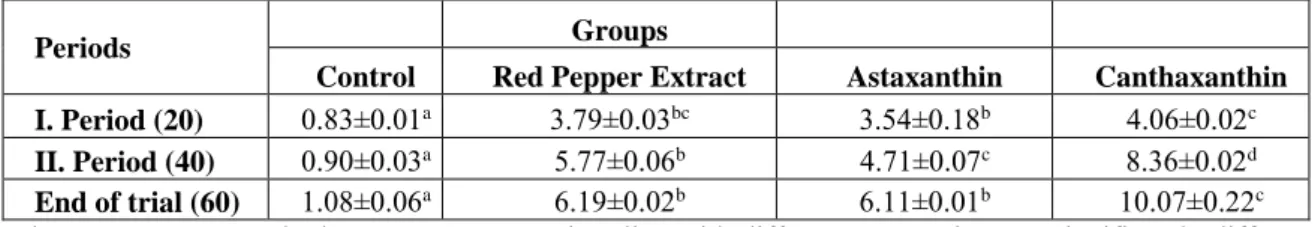
Carotenoid amounts detected at the beginning of the trial were demonstrated at the Table 1. In the control group, the beginning amount of carotenoid which was 0.83 mg was measured as 1.08 mg at the end of the trial. It also resulted in significant increases in each sample group of fishes fed with the fodder composing, red pepper meal, canthaxanthin and astaxanthin (P<0.05). Maximum amount of carotenoid was found to be in the group of fishes fed with canthaxanthin at the end of the trial, which was 10.07 mg carotenoid kg-1.
Table 3.1.1 The amount of carotenoid (mg carotenoid kg-1 fish) detected via spectrophotometer at the beginning of trial
Values are mean± standard error; n=3, Means in a line with different superscripts are significantly different each other (p<0.05).
Periods Groups
Control Red Pepper Extract Astaxanthin Canthaxanthin I. Period (20) 0.83±0.01a 3.79±0.03bc 3.54±0.18b 4.06±0.02c II. Period (40) 0.90±0.03a 5.77±0.06b 4.71±0.07c 8.36±0.02d End of trial (60) 1.08±0.06a 6.19±0.02b 6.11±0.01b 10.07±0.22c
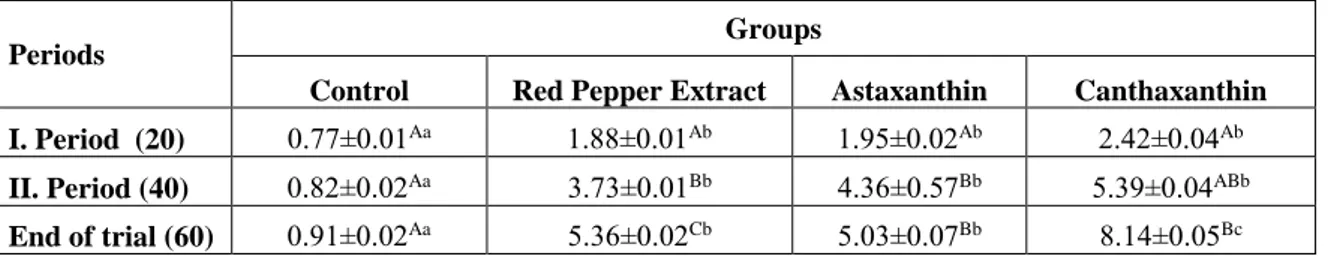
At the end of the trial, the total amounts of carotenoid determined in fishes by the spectrophotometric method were indicated at the Table 2. Significant differences among groups and periods were found to be in terms of the amount of carotenoids in fishes (P<0.05). The maximum amount of carotenoid was detected in the canthaxanthin group at the end of the trial, which was 8.14±0.051 mg carotenoid kg-1
Table 3.1.2 The amount of carotenoid (mg carotenoid kg-1 fish) detected via spectrophotometric method at the end of the trial
Periods Groups
Control Red Pepper Extract Astaxanthin Canthaxanthin I. Period (20) 0.77±0.01Aa 1.88±0.01Ab 1.95±0.02Ab 2.42±0.04Ab II. Period (40) 0.82±0.02Aa 3.73±0.01Bb 4.36±0.57Bb 5.39±0.04ABb End of trial (60) 0.91±0.02Aa 5.36±0.02Cb 5.03±0.07Bb 8.14±0.05Bc Values are mean± standard error; n=3.
(A, B…↓), means in a line with different superscripts are significantly different each other (p<0.05); (a, b…→) means in a column with different superscripts are significantly different each other (p<0.05). The amounts of carotenoid determined in fishes by the spectrophotometric method both at the beginning of the trial and at the end of the trial were compared at the Table 3. Although any differences were not detected among periods with respect to control group, significant changes were recorded both among periods and groups concerning other groups (P<0.05). Through all periods of the control group and on the 40th day samples of astaxanthin group where the carotenoid was added statistically significant differences were detected (P<0.05).
Table 3.1.3 The amount of carotenoid (mg carotenoid kg-1 fish) detected via spectrophotometric method at the beginning of the trial and at the end of the trial
Periods Groups Control Red Pepper Extract Astaxanthin Canthaxanthin I. Period B (20) 0.83±0.01Aa 3.79±0.03Ba 3.54±0.18Ba 4.06±0.02Ca I. Period (20) 0.77±0.04Aa 1.88±0.03Bb 1.95±0.04Bb 2.42±0.13Cb II. Period B (40) 0.90±0.03Aa 5.77±0.06Ba 4.71±0.07Ba 8.36±0.02Ca II. Period (40) 0.82±0.03Aa 3.73±0.03Bb 4.36±0.12Ba 5.39±0.19Cb End of trial B (60) 1.08±0.06Aa 6.19±0.02Ba 6.11±0.01Ba 10.07±0.22Ca End of trial (60) 0.91±0.03Aa 5.36±0.09Bb 5.03±0.13Bb 8.14±0.04Cb Values are mean± standard error; n=3.
(A, B…↓), means in a line with different superscripts are significantly different each other (p<0.05); (a, b…→) means in a column with different superscripts are significantly different each other (p<0.05).
3.2. TBARS Analyses
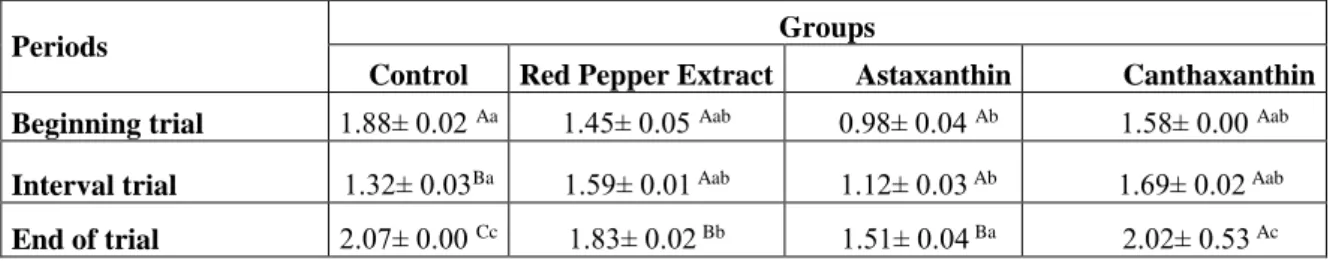
In the study, thiobarbituric acid (TBARS) properties were also examined for each group through 3 periods. First period was categorized as beginning trial (20th day), the second period was categorized as interval trial (40th day) and the third period was categorized as end of trial (60th day). Considering these periods, TBARS values found for the control
group at the beginning trial, interval trial and end of the trial were 1.88±0.02, 1.32±0.03, 2.07±0.00 mg MA kg-1, respectively. In addition, they were 1.45±0.05, 1.59±0.01, 1.83±0.02 mg MA kg-1 for group where the red pepper meal was used, respectively Moreover, determined TBA values for the group where the astaxanthin was used were 0.98±0.04, 1.12±0.03, 1.51±0.04 mg MA kg-1, respectively; while they were 1.58±0.00, 1.69±0.02, 2.02±0.53 mg MA kg-1 for the group where canthaxanthin was used, respectively. Identified TBARS values for all groups through all periods were revealed at the Table 4.
Table 3.2 Identified TBARS values (mg malonaldehyde kg-1) for all groups and all periods
Periods Groups
Control Red Pepper Extract Astaxanthin Canthaxanthin Beginning trial 1.88± 0.02 Aa 1.45± 0.05 Aab 0.98± 0.04 Ab 1.58± 0.00 Aab Interval trial 1.32± 0.03Ba 1.59± 0.01 Aab 1.12± 0.03 Ab 1.69± 0.02 Aab End of trial 2.07± 0.00 Cc 1.83± 0.02 Bb 1.51± 0.04 Ba 2.02± 0.53 Ac Values are mean± standard error; n=3.
(A, B…↓), means in a line with different superscripts are significantly different each other (p<0.05); (a, b…→) means in a column with different superscripts are significantly different each other (p<0.05). According to the statistical analysis conducted among the groups at the beginning trial and the end of trial, statistical differences were observed between Control group-Red Pepper Meal group; Astaxanthin group-Canthaxanthin group; Red Pepper Meal group-Astaxanthin group; Astaxanthin group-Canthaxanthin group (P<0.05). Concerning the periods, statistical differences were detected for the control group in all periods and for the group of red pepper meal and astaxanthin groups in the middle of the beginning trial and end of trial and in the middle of interval trial and end of trial (P<0.05).
Rodriguez et al. (2007) determined the free fatty acids and oxidation values (peroxide value, thiobarbituric acid index) of Coho salmon (Oncorhynchus kisutch) during their frozen storage for 15 months and compared the sensory characteristics (smell and taste) with the their antioxidant values (tocopherol isomer and astaxanthin values). It was recognized that the production of TBA and the peroxide value was low as result of frozen storage. Similarly, the development of sour smell and taste was observed as low. Astaxanthin values were stable throughout the trial process. It was concluded that Coho salmon lipids contributed to the oxidative stability. According to Buchecher (1982), carotenoids can work as antioxidant. Sigurgisladottir et al. (1994) stated, the accumulation of astaxanthin found to be free in Atlantic salmon, it results in antioxidant effects on the fats located on the salmon muscles.
Christophersen et al. (1992) investigated the combined effects of exposure to the light having a different ray distribution and packing material concerning the transition of oxygen on the oxidative deterioration of carotenoids and fats during the storage of rainbow trout. It was pointed out that in contrast to the emergence of fat oxidation, astaxanthin consumption was sensitive to the flow concentration of UV light and was less sensitive to the rate of oxygen permeability of the packing material. Andersen et al. (1990) observed that both natural salmon and farmed rainbow trout which were packed as if covered with the method of transparent vacuum and they were located in the lighted freezer at -17 oC for 6 months
storing period. Half of the packages were exposed to light completely, whereas half of them were protected from the light. It was noticed that salmon steaks which had lower astaxanthin content were more sensitive to the development of rancidity during the storing. In addition, astaxanthin concentration in rainbow trout steaks declined at -17 oC during 6 months storing period; however, salmon steaks remained without any emergence of decline and change in them. This situation was explained with more oxidation developed in frozen trout lipid resulting in the use of trout pigment through fat oxidation unlike salmons.
Bell et al. (2000) experimented with Atlantic salmons, studying 4 diets prepared differently for 22 weeks. Atlantic salmons were fed with the fodder involving vitamin E; involving both carotenoid and astaxanthin; involving either vitamin E or astaxanthin; involving neither vitamin E nor astaxanthin. It was observed that astaxanthin and vitamin E are affecting each other on the muscles balanced with their amount. Moreover, it was confirmed that vitamin E and astaxanthin together resulting in more antioxidant effect which led to decline in the development of malonaldehyde. This study proposed that both vitamin E and carotenoid of astaxanthin has antioxidant function. Bragadottir (2001) was claimed that astaxanthin, canthaxanthin and beta-carotene can function as antioxidants among carotenoid pigments by working as free radical scavengers actively to reduce the damage of oxygen. Carotenoids are most effective in the presence of low level of oxygen and can demonstrate antioxidant or prooxidant effects depending on their concentration. Aubourg et al. (2005) detected the free fatty acids, peroxide value, TBARS value, astaxanthin changes and sensory evaluation results by studying the changes in the fats during the cold storing of Coho salmons (Oncorhynchus kisutch) for 24 days. Free fatty acids, peroxide value and TBARS value demonstrated a slow development. TBARS value was found to be 0.40 mg MA kg-1. Smell values pointed out to significant rancidity (P<0.05) on the 10th day and it reached unacceptable values on the 19th and 24th day. Astaxanthin was detected to be at a relatively high level on the white muscles and this level was maintained until the end of the trial. When compared with other fatty fish types kept at similar cold conditions, a low level of oxidation development was observed in the fats of Coho salmons. This study indicated that astaxanthin contributes to oxidation stability of Coho salmon fats due to the fact it works as a free radical scavenger.
Bjerkeng and Johnsen (1995) in their study investigated the effect of packing materials which had high, medium and low oxygen permeability on rainbow trout filets with respect to the development of TBARS and searched the amount of astaxanthin remained on the fishes for 3 different levels of astaxanthin during the dark and lighted storing phase. Samples were analyzed after the 17th weeks, 29th weeks and 30th weeks. Rancidity emerged faster with the packages of high oxygen permeability. This effect was mostly observed with the samples which were more lighted as it was also confirmed with sensation analyses. Filets with the highest astaxanthin content reached the maximum TBARS value at the end of the 29th week, while the other two groups with lower pigment content attained the maximum level after the 17th week. This result indicated the antioxidative effect of astaxanthin.
4. Conclusion
In conclusion, additives used in the study resulted in an antioxidant effect on the amount of TBARS. Red pepper and astaxanthin became effective beginning from the middle of trial.
References
Andersen, H.J., Bertelsen, G., Christophersen, A.G., Ohlen, A., Skibsted, L.H. 1990. Development of rancidity in salmonoid steaks during retail display a comparison of practical storage life of wild salmon and farmed rainbow trout, Zeitschrift Für Lebensmitteluntersuchung und Forschung A, 191(2): 119-122.
Aubourg, S.P., Vinagre, J., Rodriguez, A., Losada, V., Larrain, M.A., Quitral, V., Gomez, J., Maier, L., Wittig, E. 2005. Rancidity development during The chilled storage of farmed Coho Salmon (Oncorhynchus kisutch), European Journal of Lipid Science and Technology, 107(6): 411-417. doi: 10.1002/ejlt.200401069
Bell, J.G., McEvoy, J., Tocher, R.D., Sargent, R.J., 2000. Depletion of α- tocopherol and astaxanthin in Atlantic Salmon (Salmo salar) affects autoxidative defense and fatty acid metabolism, Journal of Nutrition, 130: 1800-1808.
Bird, J.N., Savage, G.P., 1990. Carotenoid pigmentation in aquaculture, Proceedings of the Nutrition Society of New Zealand, 15: 45-56.
Bjerkeng, B., Johnsen, G., 1995. Frozen storage quality of Rainbow Trout (Oncorhynchus mykiss) as affected by oxygen, illumination and fillet pigment, Journal of Food Science, 60(2): 284-288. doi: 10.1111/j.1365-2621.1995.tb05656.x
Bragadottir, M., 2001. On the stability of Icelandic Capelin Meal. Master Thesis, Department of Food Science University of Iceland.
Buchecker, R.A., 1982. A chemist’s view of animal carotenoids. In: Britton, G., Goodwin T.W. (Eds.) Carotenoid chemistry and biochemistry. Pergamon, Oxford, pp. 175.
Christophersen, A.G., Bertelsen, G., Andersen, H.J., Knuthsen, P., Skibsted, L.H., 1992. Storage life of frozen salmonoids effect of light and packaging conditions on carotenoid oxidation and lipid oxidation, Zeitschrift Für Lebensmitteluntersuchung und Forschung A, 194(2): 115-119.
Choubert, G., Blanc, J.M., 1985. Flesh colour of diploid and triploid Rainbow trout fed canthaxanthin, Aquaculture, 47: 299-304. doi: org/10.1016/0044-8486(85)90215-7
Official J. European Communities, 1994. On colours for use in foodstuffs. European Parliament and Council Directive 94/36/EC 30.6, 237: 13-29.
Greene, D.H.S., Selivonchick, D.P., 1987. Lipid metabolism in fish, Progressive Lipid Research, 26: 53–85.
Haila, K., 1999. Effects of carotenoids and carotenoid-tocopherol interaction on lipid oxidation in vitro. PhD Thesis, Department of Applied Chemistry and Microbiology, University of Helsinki. ISBN 951-45-8667-0
Ozbay, G., Gill, T., Spencer, K.E., 2003. Investigation of protein denaturation, texture, rancidity and fading of the pigments in farmed steelhead (Onchorhychus mykiss) fillets during frozen storage, Journal of Food Processing and Preservation, 30(2): 208-230. doi: 10.1111/j.1745-4549.2006.00060.x
Rodriguez, A., Losada, V., Larrain, M.A., Quitral, V., Vinagre, J., Aubourg, S.P, 2007. Development of lipid changes related to quality loss during the frozen storage of Schiedt, K., 1988, The significance of carotenoids in animal nutrition, ROCHE Symposium "The Value of Vitamins in animal Nutrition", London, October, pp 28.
Saito, A., Regier, L.W, 1971. Determination of total carotenoid pigments in trout and salmon flesh, Canadian Journal of Fisheries and Aquatic Sciences, 28: 509-512.
Sigurgisladottir, S., Parrish, C.C., Lall, S.P., Ackman, R.G, 1994. Effects of feeding natural tocopherols and astaxanthin on Atlantic Salmon (Salmo salar) fillet quality, Food Research International, 27: 23-32. In: Bjerkeng, B. (Ed.), Carotenoid pigmentation of salmonid fishes- recent progress, Avances en Nutricion Acuicola V. Memorias del V. Simposium Internacional de Nutricion Acuicola. 19- 22 Noviembre, 2000 Mexica. Merida, Yucatan, pp.71- 89.
Sigurgisladottir, S., Torrissen, O., Lie, O., Thomassen, M., Hafsteinsson, H, 1997. Salmon quality: Methods to determine the quality parameters, Reviews in Fisheries Sciences, 5: 223-252. doi: 10.1080/10641269709388599
Skrede, G., Storebakken, T., Naes, T, 1990. Color evaluation in raw, baked and smoked flesh of rainbow trout (Oncorhynchus mykiss) fed astaxanthin or canthaxanthin, Journal of Food Science, 55(6): 1574-1578. doi: 10.1111/j.1365-2621.1990.tb03572.x
Smith, G., Hole, M., Hanson. S.W., 1992. Assessment of lipid oxidation in Indonesian salted-dried marine catfish (Arius thalassinus), Journal of the Science of Food and Agriculture, 51: 193-205. doi: 10.1002/jsfa.2740510207
Sommer, T. R, D'Souza, F. M. L., Morrisy, N. M., 1992. Pigmentation of adult rainbow trout, Oncorhynchus mykiss, using the green alga Haematococcus pluvialis, Aquaculture, 106: 63-74. doi: org/10.1016/0044-8486(92)90250-O
Spinelli, J., 1979. Preparation of salmonid diets containing zooplankton and their effects on organoleptic properties of pen-reared salmonids. In: Halver, J.E., Tiews, K. (Eds.), Finfish nutrition and fishfeed technology. H. Heeneman Gmbh & Co, Berlin, pp. 383–392.
Toyomizu, M., Kawasaki K., Tomiyasu, Y., 1963. Effect of dietary oil on the fatty acid composition of rainbow trout oil, Bulletin of the Japanese Society of Scientific Fisheries, 29: 957–961.
Yeşilayer, N., Erdem, M., Aral, O., Karslı, Z., 2008. A study of color back transformation in rainbow trout (Oncorhyncus mykiss) fed by feed containing carotenoids with instrumental (physical) and color card methods, Journal of FisheriesSciences.com, 2(3): 560-569.