Received: 30 October 2018 Accepted: 31 May 2019
A Time-Course Study on Essential Oil of Rosemary (Rosmarinus officinalis) Under Drought Stress
Muhittin KULAK
Kilis 7 Aralık University, Yusuf Şerefoğlu Faculty of Health, Department of Nursing, Kilis, Türkiye [email protected] , ORCID Address:https://orcid.org/0000-0003-3673-9221
Abstract
Along with the present study, the changes in essential oil profile of rosemary (Rosmarinus officinalis) under drought stress were investigated. The leaf samples of rosemary were collected on three consecutive days and then the drought stressed groups were irrigated as recovery stage. Accordingly, 26 compounds were identified using gas-chromatography coupled with headspace system. Of the compounds, α-pinene, camphene, β-pinene, β-myrcene, p-cymene, D-limonene, eucalyptol, and camphor are of the major compounds, representing the 84.874 % of the identified compounds. Of those compounds, α-pinene, β-myrcene, and camphor percentage increased with the drought but the percentage of β-pinene decreased. Moreover, the changes in lipid, amide and carbohydrate regions for the samples were examined using Attenuated Total Reflectance Fourier Transform Infrared spectroscopy. The intensities: 2920 to 2852, 1727 to 1687 and 1452 to 1035 cm-1 bands corresponding to the lipids, amides, and
carbohydrates, respectively were higher in CRD1, CRD2, CRD3, CD3, SD3, SRD1.
Considered all experimental groups, the intensities were partially higher in control group. For the discrimination of the experimental groups, variance analysis, clustering analysis, and principal component analysis were performed. Drought and well-watered (control) groups were clearly discriminated and confirmed using differential statistical
Adıyaman University Journal of Science
dergipark.org.tr/adyusci
ADYUSCI
9 (1) (2019) 165-189
166
tools, suggesting the plausible role of metabolites in response to the changing environmental conditions.
Keywords: ATR-FTIR, Drought, Essential oil, GC-MS Headspace, Rosemary, Rosmarinus officinalis.
Abbreviations: ATR-FTIR: Attenuated Total Reflectance Fourier Transform Infrared spectroscopy; D0: The first sampling before drought treatment; CD1: First day
after first sampling; CD2: Second day after first sampling; CD3: Third day after first
sampling; CDR1: Fourth day after first sampling; CDR2: Fifth day after first day
sampling; CDR3: Sixth day after first day sampling; SD1: First stressed day after first
sampling; SD2: Second stressed day after first sampling; SD3: Third stressed day after
first sampling; SRD1: First recovery day after three stressed days; SRD2: Second
recovery day after three stressed days; SRD3: Third recovery day after three stressed
days.
Kuraklık Stresi Altındaki Biberiyenin (Rosmarinus officinalis) Uçucu Yağ Bileşenlerinin Zamana Bağlı Olarak Değişimi Üzerine Bir Çalışma Özet
Bu çalışma ile birlikte, kuraklık stresi altındaki biberiyenin (Rosmarinus officinalis) uçucu yağ profilinde meydana gelen değişimler araştırılmıştır. Biberiye yaprağı örnekleri üç ardışık gün içerisinde toplanmış ve daha sonra kuraklık stresine maruz bırakılan bitkiler iyileştirme amaçlı sulanmıştır. Sonuç olarak GC-MS Headspace sistemi ile yapılan analize göre 26 bileşen belirlenmiştir. a-pinen, kamfen, pinen, β-myrcene, p-cymene, D-limonen, okaliptol ve kafur, tanımlanan bileşiklerin % 84, 874'ünü temsil eden ana bileşenler olarak belirlenmiştir. Bu bileşiklerin a-pinen, β-myrcene ve kafur yüzdesi kuraklıkla artmış, ancak β-pinen yüzdesi azalmıştır. Ayrıca, Zayıflatılmış Toplam Yansıma Fourier Dönüşümü Kızılötesi spektroskopisi kullanılarak biberiye yapraklarındaki lipit, amit ve karbonhidrat bölgelerinde meydana gelen değişimler de incelenmiştir. Lipitlere, amitlere ve karbonhidratlara karşılık gelen 2920 ila 2852, 1727 ila 1687 ve 1452 ila 1035 cm-1 bant yoğunluklarının sırasıyla CRD1, CRD2, CRD3, CD3, SD3, SRD1'de daha yüksek olduğu belirlenmiştir. Tüm deney
167
grupları dikkate alındığında, kontrol grubunda lipit, amit ve karbonhidrat bant yoğunluklarının kısmen daha yüksek olduğu gözlenmiştir. Deney gruplarının ayrımı için varyans analizi, kümeleme analizi ve temel bileşen analizi yapılmıştır. Kuraklık ve sulanan (kontrol grubu) gruplar, ayırt edici istatistiksel araçlar kullanılarak doğru bir şekilde ayırt edilmiş ve doğrulanmıştır. Ayrıca değişen çevresel koşullara yanıt olarak metabolitlerin olası rolü ortaya konulmuştur.
Anahtar Kelimeler: ATR-FTIR, Kuraklık, Uçucu yağ, GC-MS Headspace, Biberiye, Rosmarinus officinalis.
1. Introduction
In agricultural production, abiotic and biotic stress factors cause significant changes in quality and quantity properties of the plants. Of those abiotic stress factors, drought stress is considered and classified as of the most devastating stress factors limiting plant growth and shifting the plant metabolism. However, plants might exhibit positive behaviors concerned with secondary metabolite synthesis, production, secretion, and storage in response to the drought circumstances [1-3]. Shifting secondary metabolism as a response to the drought was considered as a strategy for sustaining life of the plant itself. The reaction of plants to drought stress induced impairments has been thoroughly discussed for several species, postulating and confirming that the shift in plant metabolism due to the stress factors. It has been proposed and considered as an advantageous phenomenon favouring for the cultivation of medicinal and aromatic plants [4-5].
It is worthy to note that today’s agricultural trend and approaches are not only addressed on agricultural production and trade significance but also quantity and quality of the metabolites of the plants since the efficacy of the plants for their aromatic, medicinal, pharmaceutical, therapeutic, cosmetic and industrial values are coupled with the secondary metabolite content. Of the great diversity of secondary metabolites, essential oil is of the most important secondary metabolites. In this context, numerous researches on various plants for essential oil content and composition under water-limited stress conditions have been performed [6-17].
168
Of the medicinal and aromatic plants, rosemary (Rosmarinus officinalis) belonging to the Lamiaceae is an evergreen plant species distributed under a wide range of climates but mainly in the Mediterranean region. Rosemary is an aromatic plant and considered as an important source for its essential uses in perfume and medicinal purposes [18]. The essential oil content of rosemary was reported to range from 0.86 % [19] to 1.43 % [20]. Of the essential oil composition of rosemary, camphor, α-pinene, β-pinene, 1,8cineole, bornyl acetate, and borneol were predominant compounds [21-22] but the percentage of the compounds might change in response to environmental conditions.
Fourier transform infrared (FTIR) spectroscopy is a method measuring the vibrations of molecular bonds and generating a spectrum that corresponds to the metabolic fingerprint of a sample [23-25]. In this context, many reports in various fields have been documented using FTIR techniques [26-31]. Herewith, FTIR was considered as a fast tool and probe for rapid measure and estimation of the molecular changes [23].
Along with the present study, the effects of drought stress on essential oil composition of the rosemary leaves were investigated through water-holding for three days and then recovery for three days. Furthermore, changes in amide, lipid and carbohydrate regions of the leaf samples were screened using FTIR.
2. Material and Methods 2.1 Plant Material
Uniform transplants of rosemary were kindly provided from Agricultural Application and Research Center, Kilis 7 Aralik University, Kilis, Turkey.
2.2 Time Course Experiments
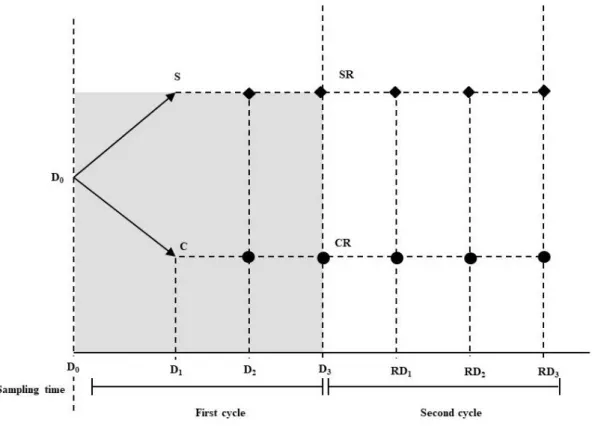
Experimental design scheme of the present study is given in Figure 1. Briefly, a pot experiment was conducted at greenhouses of the Agricultural Application and Research Center. The pots were arranged in complete randomized block designs with the three replicates corresponding to ten seedlings. Rosemary transplants were grown
169
under control and drought conditions. After adaptation of the transplants to greenhouse conditions, the plants were subjected to the drought stress for three days and leaf samples were collected on successive days for three days at the same time for each day. After three-day stress, the seedlings were irrigated with their 100% field capacity for three days. The leaves were sampled on successive days for three days at the same time for each day, as well. Experiments were conducted in a greenhouse with a 14 h photoperiod. Mean temperature and relative humidity were 26-30 ºC during day and 16-20 ºC at night, 60 % respectively. After harvest, leaf samples were left for drying under shadow in laboratory conditions for chromatographic analysis.
Figure 1. Experimental design scheme of the present study 2.3 Gas Chromatography Headspace Analysis
Headspace conditions were as follows: GC Cycle Time (min): 63; Sample Volume (mL): 2.5; Incubation Time (min):30; Incubation Temperature (°C): 70; Syringe Temperature (°C): 70. After optimization of running conditions, essential oil analysis was performed by GC equipped with HP-5 MS capillary column (30 m x 0.25 μm x 250 µm) and 5977 (Agilent Technologies) with mass selective detector 7890B
170
(Agilent Technologies) model GC-MS. An electron ionization system with ionization energy of 70 eV was used for GC-MS detection. Helium was a carrier gas at a flow rate of 1 mL/min. Injector and MS transfer line temperature were set at 250°C. Column temperature was initially kept at 50°C for 2 min, then gradually increased to 200°C at 6°C/min and finally raised to 250°C at 10°C/min. Samples were injected automatically with split ratio 10:1. Individual components were identified by electronic libraries (W10N14 and NIST14).
2.4 Attenuated Total Reflectance Fourier Transform Infrared (ATR-FTIR) Spectroscopy
The ATR-FTIR spectra of 10 mg of the dried leaf samples of rosemary were recorded in Agilent Cary 600 Series FTIR. The cumulative scanning frequency was 32 min-1. The scanned region was set to be 4000 to 400 cm-1, with a spectral resolution of 4 cm-1.
2.5 Statistical Analysis
XLSTAT statistical program was used to determine statistical significance levels by employing the independent one-way ANOVA followed by Duncan multiple range test and the differences between individual means were considered to be statistically important at p<0.05. Also, cluster analysis of the results was performed using XLSTAT. Moreover, the discrimination for experimental groups was done with the principal component analysis using PAST software.
3. Results and Discussion
3.1 Changes in essential oil compounds under experimental conditions
Essential oil compounds identified in rosemary leaves are listed in Table 1-3. following their elution order on the HP-5 column. Also, the changes in percentage of the compounds were visualized using Heat map (Table 4), indicating the increase from lowest (blue) to highest (red) colour scale for essential percentage for each compound obtained from different treatments. The variance analysis showed that all identified compounds were significantly affected by drought stress, highlighting that essential oil compounds were sensitive to drought due to the plausible induction or suppression of
171
specific enzymes involved in biosynthesis of the compounds. In leaf samples of the D0
group corresponding to the first sampling before treatments, 26 compounds were identified. Of the compounds, α-pinene (42.920 %), camphene (9.460 %), β-pinene (1.683 %), β-myrcene (3.657 %), p-cymene (2.317 %), D-limonene (7.487 %), eucalyptol (12.993 %), and camphor (4.357 %) are of the major compounds, representing the 84.874 % of the identified compounds (Table 1). Those compounds are common to essential composition of rosemary leaves but the percentage and content of the compounds vary with the season, geographic origin, environmental factors, extraction methods and plant organs [32-33].
Herein, the study was addressed on two main objectives. The first one was to determine the essential oil compound changes by the sampling on successive days (D0,
CD1, CD2, CD3, CDR1, CDR2, CDR3 for control group). Along with the results obtained
after six day-samplings, the relationship between six-day-development of the plant and its essential oil composition was issued. For the later one (D0, SD1, SD2, SD3, SRD1,
SRD2, SRD3 for stress group), the drought stress specific or stress-induced compounds
were identified after three-successive samplings under water-held conditions. Moreover, three-day stressed groups were irrigated as a recovery group in order to determine or improve the essential compounds.
Of the major compounds identified herein, percentage of α-pinene was more pronounced under drought stress conditions and the biosynthesis of α-pinene was positively induced by the first day of drought (SD1) and then decreased for the next two
days (SD2, SD3) but the percentage was higher than the control group. However, the
percentage of the compound reached the highest value during the first day of the recovery (SRD1) and then decreased during the following two days (SD2, SD3).
Similarly, drought [22, 34] and salt stress [35-36] increased α-pinene in rosemary. Also, severe water stress increased α-pinene in different aromatic plant species such as Salvia officinalis [37], Petroselinum crispum [38], Foeniculum vulgare [39] and Satureja hortensis L. [40].
172
However, water stress-induced reduction in α-pinene percentage was observed in Ocimum basilicum and Ocimum americanum [41], Carum copticum L. [42 and (Carum carvi L.) [2]. Furthermore, the α-pinene percentage in regularly irrigated group (control group) decreased steadily from D0 to CRD1 but then increased for the next two
experimental days (CRD1 and CRD2). It is worthy to note that quality and quantities of
the essential oil composition depend on the environmental, ontogenetic, annual and diurnal variations. The components which are not present at the current stage of the plant may emerge in the following developmental stages for sustainable developments of the plant itself [43-44].
Even though the effect of different harvesting time and drought stress affected significantly the percentage of camphene (p<0.001), there were no clear and obvious differences in quantity of the compound. However, the highest value was obtained in the first day of recovery on stress group. Decrease in camphene in the percentage was reported in R. officinalis under mild and severe water stress [22] but increased in S. officinalis [37] and F. vulgare [39].
With drought stress, the percentage of β-pinene decreased. However, recovery did not affect very much the percentage of the compound in drought stressed group. Noteworthy that β-pinene increased under irrigated conditions (control group) for six days. However, mild and severe water stress increased the percentage of β-pinene in R. officinalis [22], S. hortensis L. [40], S. officinalis [37], O. basilicum L. [41], F. vulgare [39], and P. crispum [38].
β-myrcene percentage differed among experimental groups (p< 0.0001) and increased with the drought. Moreover, there were no clear differences in percentages on the consecutive samplings for both groups but the changes were significant for days in each experimental group (p< 0.0001). Increases in β-myrcene percentages were also reported under severe drought stress [22, 39, 40].
p-cymene percentage was maintained with the drought but decreased by the time in the control group. The percentage of the compound under drought exhibited a decline after second day of the recovery stage. The changes in the percentages were significant (p< 0.0001). For the consecutive days in control group, a decline in the percentage was
173
recorded except CRD1 corresponding to the fourth day of the experiments. Zali et al. (2018) [39] reported an increase in p-cymene in Foeniculum vulgare under drought. In Satureja hortensis L. the content of the compound peaked under severe water stress treatment from near to full flowering stage [40].
D-limonene percentage decreased under both group but it was higher under drought conditions (p< 0.0001), suggesting that the decline in the percentage might be contributed to the normal developmental stage but the decline might be slightly improved with water holding. A slight increase but maintained changes for limonene content in Satureja hortensis L were also reported [40]. A strong rise in content was documented for Foeniculum vulgare under drought [39].
Eucalyptol percentage was not very much affected with the drought stress but the percentage increased during recovery period. Moreover, the percentage in samples under continuously and regularly irrigation increased. There were statistically significant differences for consecutively harvest for regularly irrigated samples, stressed and recovered samples (p<0.0001) (Table 1-3). However, the percentage significantly augmented with the moderate and severe stress in rosemary [22].
With drought, the percentage of camphor increased and peaked at the third day of stress (SD3) but there were slight decreases after recovery (p=0.02). For the regularly
irrigated plants, there were decreases in the percentage of the compound by the time (p< 0.0001). Similar stress induced increases were also documented in Foeniculum vulgare [39].
The changes in secondary metabolites have been explained in different way by different authors but the most common idea is about the accumulation of the metabolites is about the decline in uptake of CO2 due to stomatal closure driven by water stress
conditions. Subsequently, the consumption of reduction equivalents (NADPH+H+) for the CO2-fixation via Calvin cycle decreases substantially, causing surplus of
NADPH+H+. It is worthy to note that enhancement or decline is considered as a consequence of adaptive strategies of the plant. Since plant system is complex, dynamic and variable within the plant species, genotypes, varieties, chemotypes, and ecotypes, a common, uniform and universal explanation cannot be easily illustrated for metabolite
174
accumulation. Moreover, the severity, duration or combination with another simultaneous stress factors may bring about the compositional and content changes [44-46].
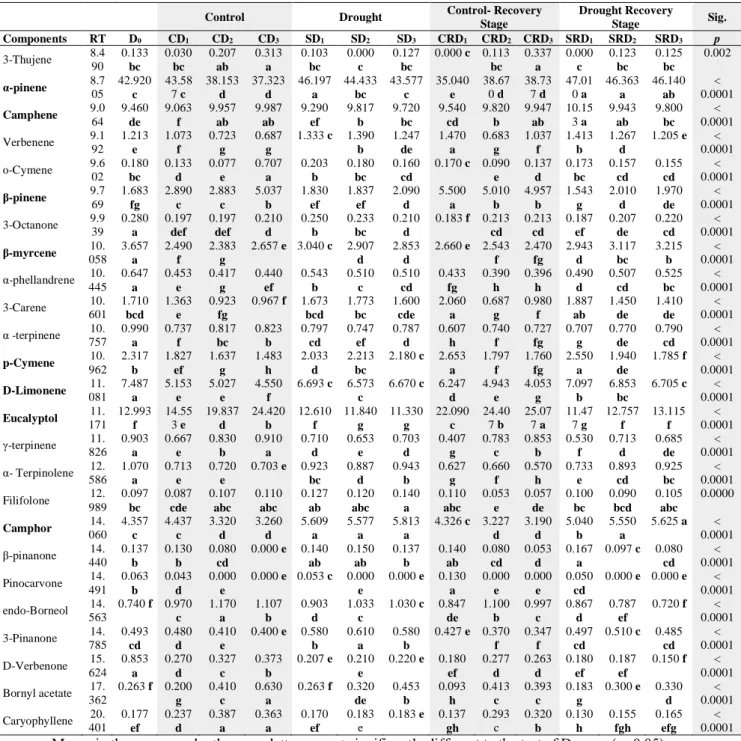
Table 1. Essential oil compounds identified in rosemary leaves
Control Drought Control- Recovery Stage Drought Recovery Stage Sig. Components RT D0 CD1 CD2 CD3 SD1 SD2 SD3 CRD1 CRD2 CRD3 SRD1 SRD2 SRD3 p 3-Thujene 8.4 90 0.133 bc 0.030 bc 0.207 ab 0.313 a 0.103 bc 0.000 c 0.127 bc 0.000 c 0.113 bc 0.337 a 0.000 c 0.123 bc 0.125 bc 0.002 α-pinene 8.7 05 42.920 c 43.58 7 c 38.153 d 37.323 d 46.197 a 44.433 bc 43.577 c 35.040 e 38.67 0 d 38.73 7 d 47.01 0 a 46.363 a 46.140 ab < 0.0001 Camphene 9.064 9.460 de 9.063 f 9.957 ab 9.987 ab 9.290 ef 9.817 b 9.720 bc 9.540 cd 9.820 b 9.947 ab 10.15 3 a 9.943 ab 9.800 bc < 0.0001 Verbenene 9.1 92 1.213 e 1.073 f 0.723 g 0.687 g 1.333 c 1.390 b 1.247 de 1.470 a 0.683 g 1.037 f 1.413 b 1.267 d 1.205 e < 0.0001 o-Cymene 9.602 0.180 bc 0.133 d 0.077 e 0.707 a 0.203 b 0.180 bc 0.160 cd 0.170 c 0.090 e 0.137 d 0.173 bc 0.157 cd 0.155 cd < 0.0001 β-pinene 9.7 69 1.683 fg 2.890 c 2.883 c 5.037 b 1.830 ef 1.837 ef 2.090 d 5.500 a 5.010 b 4.957 b 1.543 g 2.010 d 1.970 de < 0.0001 3-Octanone 9.9 39 0.280 a 0.197 def 0.197 def 0.210 d 0.250 b 0.233 bc 0.210 d 0.183 f 0.213 cd 0.213 cd 0.187 ef 0.207 de 0.220 cd < 0.0001 β-myrcene 10. 058 3.657 a 2.490 f 2.383 g 2.657 e 3.040 c 2.907 d 2.853 d 2.660 e 2.543 f 2.470 fg 2.943 d 3.117 bc 3.215 b < 0.0001 α-phellandrene 10. 445 0.647 a 0.453 e 0.417 g 0.440 ef 0.543 b 0.510 c 0.510 cd 0.433 fg 0.390 h 0.396 h 0.490 d 0.507 cd 0.525 bc < 0.0001 3-Carene 601 10. 1.710 bcd 1.363 e 0.923 fg 0.967 f 1.673 bcd 1.773 bc 1.600 cde 2.060 a 0.687 g 0.980 f 1.887 ab 1.450 de 1.410 de < 0.0001 α -terpinene 10. 757 0.990 a 0.737 f 0.817 bc 0.823 b 0.797 cd 0.747 ef 0.787 d 0.607 h 0.740 f 0.727 fg 0.707 g 0.770 de 0.790 cd < 0.0001 p-Cymene 10. 962 2.317 b 1.827 ef 1.637 g 1.483 h 2.033 d 2.213 bc 2.180 c 2.653 a 1.797 f 1.760 fg 2.550 a 1.940 de 1.785 f < 0.0001 D-Limonene 081 11. 7.487 a 5.153 e 5.027 e 4.550 f 6.693 c 6.573 c 6.670 c 6.247 d 4.943 e 4.053 g 7.097 b 6.853 bc 6.705 c < 0.0001 Eucalyptol 11. 171 12.993 f 14.55 3 e 19.837 d 24.420 b 12.610 f 11.840 g 11.330 g 22.090 c 24.40 7 b 25.07 7 a 11.47 7 g 12.757 f 13.115 f < 0.0001 γ-terpinene 11. 826 0.903 a 0.667 e 0.830 b 0.910 a 0.710 d 0.653 e 0.703 d 0.407 g 0.783 c 0.853 b 0.530 f 0.713 d 0.685 de < 0.0001 α- Terpinolene 12. 586 1.070 a 0.713 e 0.720 e 0.703 e 0.923 bc 0.887 d 0.943 b 0.627 g 0.660 f 0.570 h 0.733 e 0.893 cd 0.925 bc < 0.0001 Filifolone 12. 989 0.097 bc 0.087 cde 0.107 abc 0.110 abc 0.127 ab 0.120 abc 0.140 a 0.110 abc 0.053 e 0.057 de 0.100 bc 0.090 bcd 0.105 abc 0.0000 Camphor 060 14. 4.357 c 4.437 c 3.320 d 3.260 d 5.609 a 5.577 a 5.813 a 4.326 c 3.227 d 3.190 d 5.040 b 5.550 a 5.625 a < 0.0001 β-pinanone 14. 440 0.137 b 0.130 b 0.080 cd 0.000 e 0.140 ab 0.150 ab 0.137 b 0.140 ab 0.080 cd 0.053 d 0.167 a 0.097 c 0.080 cd < 0.0001 Pinocarvone 14. 491 0.063 b 0.043 d 0.000 e 0.000 e 0.053 c 0.000 e 0.000 e 0.130 a 0.000 e 0.000 e 0.050 cd 0.000 e 0.000 e < 0.0001 endo-Borneol 14. 563 0.740 f 0.970 c 1.170 a 1.107 b 0.903 d 1.033 c 1.030 c 0.847 de 1.100 b 0.997 c 0.867 d 0.787 ef 0.720 f < 0.0001 3-Pinanone 14. 785 0.493 cd 0.480 d 0.410 e 0.400 e 0.580 b 0.610 a 0.580 b 0.427 e 0.370 f 0.347 f 0.497 cd 0.510 c 0.485 cd < 0.0001 D-Verbenone 624 15. 0.853 a 0.270 d 0.327 c 0.373 b 0.207 e 0.210 e 0.220 e 0.180 ef 0.277 d 0.263 d 0.180 ef 0.187 ef 0.150 f < 0.0001 Bornyl acetate 17. 362 0.263 f 0.200 g 0.410 c 0.630 a 0.263 f 0.320 de 0.453 b 0.093 h 0.413 c 0.393 c 0.183 g 0.300 e 0.330 d < 0.0001 Caryophyllene 401 20. 0.177 ef 0.237 d 0.387 a 0.363 a 0.170 ef 0.183 e 0.183 e 0.137 gh 0.293 c 0.320 b 0.130 h 0.155 fgh 0.165 efg < 0.0001
175
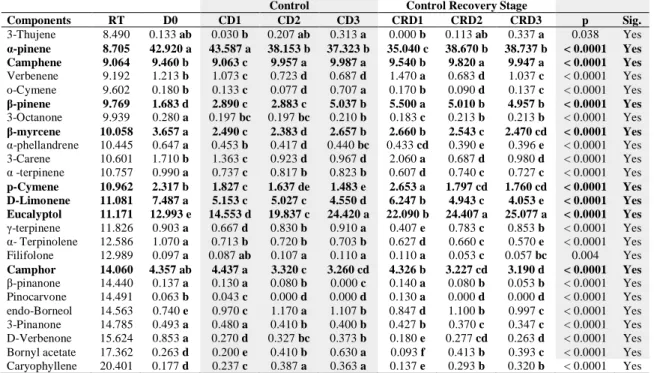
Table 2. Essential oil compounds identified in rosemary grown under continuous
irrigation for six days
Control Control Recovery Stage
Components RT D0 CD1 CD2 CD3 CRD1 CRD2 CRD3 p Sig. 3-Thujene 8.490 0.133 ab 0.030 b 0.207 ab 0.313 a 0.000 b 0.113 ab 0.337 a 0.038 Yes α-pinene 8.705 42.920 a 43.587 a 38.153 b 37.323 b 35.040 c 38.670 b 38.737 b < 0.0001 Yes Camphene 9.064 9.460 b 9.063 c 9.957 a 9.987 a 9.540 b 9.820 a 9.947 a < 0.0001 Yes Verbenene 9.192 1.213 b 1.073 c 0.723 d 0.687 d 1.470 a 0.683 d 1.037 c < 0.0001 Yes o-Cymene 9.602 0.180 b 0.133 c 0.077 d 0.707 a 0.170 b 0.090 d 0.137 c < 0.0001 Yes β-pinene 9.769 1.683 d 2.890 c 2.883 c 5.037 b 5.500 a 5.010 b 4.957 b < 0.0001 Yes 3-Octanone 9.939 0.280 a 0.197 bc 0.197 bc 0.210 b 0.183 c 0.213 b 0.213 b < 0.0001 Yes β-myrcene 10.058 3.657 a 2.490 c 2.383 d 2.657 b 2.660 b 2.543 c 2.470 cd < 0.0001 Yes α-phellandrene 10.445 0.647 a 0.453 b 0.417 d 0.440 bc 0.433 cd 0.390 e 0.396 e < 0.0001 Yes 3-Carene 10.601 1.710 b 1.363 c 0.923 d 0.967 d 2.060 a 0.687 d 0.980 d < 0.0001 Yes α -terpinene 10.757 0.990 a 0.737 c 0.817 b 0.823 b 0.607 d 0.740 c 0.727 c < 0.0001 Yes p-Cymene 10.962 2.317 b 1.827 c 1.637 de 1.483 e 2.653 a 1.797 cd 1.760 cd < 0.0001 Yes D-Limonene 11.081 7.487 a 5.153 c 5.027 c 4.550 d 6.247 b 4.943 c 4.053 e < 0.0001 Yes Eucalyptol 11.171 12.993 e 14.553 d 19.837 c 24.420 a 22.090 b 24.407 a 25.077 a < 0.0001 Yes γ-terpinene 11.826 0.903 a 0.667 d 0.830 b 0.910 a 0.407 e 0.783 c 0.853 b < 0.0001 Yes α- Terpinolene 12.586 1.070 a 0.713 b 0.720 b 0.703 b 0.627 d 0.660 c 0.570 e < 0.0001 Yes Filifolone 12.989 0.097 a 0.087 ab 0.107 a 0.110 a 0.110 a 0.053 c 0.057 bc 0.004 Yes Camphor 14.060 4.357 ab 4.437 a 3.320 c 3.260 cd 4.326 b 3.227 cd 3.190 d < 0.0001 Yes β-pinanone 14.440 0.137 a 0.130 a 0.080 b 0.000 c 0.140 a 0.080 b 0.053 b < 0.0001 Yes Pinocarvone 14.491 0.063 b 0.043 c 0.000 d 0.000 d 0.130 a 0.000 d 0.000 d < 0.0001 Yes endo-Borneol 14.563 0.740 e 0.970 c 1.170 a 1.107 b 0.847 d 1.100 b 0.997 c < 0.0001 Yes 3-Pinanone 14.785 0.493 a 0.480 a 0.410 b 0.400 b 0.427 b 0.370 c 0.347 c < 0.0001 Yes D-Verbenone 15.624 0.853 a 0.270 d 0.327 bc 0.373 b 0.180 e 0.277 cd 0.263 d < 0.0001 Yes Bornyl acetate 17.362 0.263 d 0.200 e 0.410 b 0.630 a 0.093 f 0.413 b 0.393 c < 0.0001 Yes Caryophyllene 20.401 0.177 d 0.237 c 0.387 a 0.363 a 0.137 e 0.293 b 0.320 b < 0.0001 Yes
Means in the same row by the same letter are not significantly different to the test of Duncan (α=0.05)
Table 3. Essential oil compounds identified in rosemary grown under drought
conditions for three days and then under regular irrigation (recovery) for three days
Drought Stage Drought Recovery Stage
Components RT D0 SD1 SD2 SD3 SRD1 SRD2 SRD3 p Sig. 3-Thujene 8.490 0.133 a 0.103 b 0.000 c 0.127 a 0.000 c 0.123 a 0.125 a < 0.0001 Yes α-pinene 8.705 42.920 c 46.197 a 44.433 b 43.577 bc 47.010 a 46.363 a 46.140 a < 0.0001 Yes Camphene 9.064 9.460 cd 9.290 d 9.817 b 9.720 bc 10.153 a 9.943 ab 9.800 b 0.000 Yes Verbenene 9.192 1.213 c 1.333 b 1.390 ab 1.247 c 1.413 a 1.267 c 1.205 c < 0.0001 Yes o-Cymene 9.602 0.180 ab 0.203 a 0.180 ab 0.160 b 0.173 ab 0.157 b 0.155 b 0.119 No β-pinene 9.769 1.683 d 1.830 c 1.837 c 2.090 a 1.543 e 2.010 b 1.970 b < 0.0001 Yes 3-Octanone 9.939 0.280 a 0.250 b 0.233 bc 0.210 d 0.187 e 0.207 de 0.220 cd < 0.0001 Yes β-myrcene 10.058 3.657 a 3.040 cd 2.907 e 2.853 e 2.943 de 3.117 bc 3.215 b < 0.0001 Yes α-phellandrene 10.445 0.647 a 0.543 b 0.510 cd 0.510 cd 0.490 d 0.507 cd 0.525 bc < 0.0001 Yes 3-Carene 10.601 1.710 c 1.673 c 1.773 b 1.600 d 1.887 a 1.450 e 1.410 f < 0.0001 Yes α -terpinene 10.757 0.990 a 0.797 b 0.747 d 0.787 bc 0.707 e 0.770 c 0.790 bc < 0.0001 Yes p-Cymene 10.962 2.317 b 2.033 d 2.213 c 2.180 c 2.550 a 1.940 e 1.785 f < 0.0001 Yes D-Limonene 11.081 7.487 a 6.693 cd 6.573 d 6.670 cd 7.097 b 6.853 bc 6.705 cd 0.001 Yes Eucalyptol 11.171 12.993 ab 12.610 b 11.840 c 11.330 d 11.477 cd 12.757 ab 13.115 a < 0.0001 Yes γ-terpinene 11.826 0.903 a 0.710 b 0.653 c 0.703 b 0.530 d 0.713 b 0.685 b < 0.0001 Yes α- Terpinolene 12.586 1.070 a 0.923 bc 0.887 c 0.943 b 0.733 d 0.893 c 0.925 bc < 0.0001 Yes Filifolone 12.989 0.097 b 0.127 ab 0.120 ab 0.140 a 0.100 b 0.090 b 0.105 ab 0.065 No Camphor 14.060 4.357 c 5.609 ab 5.577 ab 5.813 a 5.040 bc 5.550 ab 5.625 ab 0.02 Yes β-pinanone 14.440 0.137 b 0.140 ab 0.150 ab 0.137 b 0.167 ab 0.097 c 0.080 c 0.000 Yes Pinocarvone 14.491 0.063 a 0.053 a 0.000 b 0.000 b 0.050 a 0.000 b 0.000 b < 0.0001 Yes endo-Borneol 14.563 0.740 cd 0.903 b 1.033 a 1.030 a 0.867 bc 0.787 cd 0.720 d < 0.0001 Yes 3-Pinanone 14.785 0.493 cd 0.580 ab 0.610 a 0.580 b 0.497 c 0.510 c 0.485 c < 0.0001 Yes D-Verbenone 15.624 0.853 a 0.207 b 0.210 b 0.220 b 0.180 c 0.187 c 0.150 d < 0.0001 Yes Bornyl acetate 17.362 0.263 cd 0.263 d 0.320 bc 0.453 a 0.183 e 0.300 bcd 0.330 b < 0.0001 Yes Caryophyllene 20.401 0.177 a 0.170 b 0.183 a 0.183 a 0.130 d 0.155 c 0.165 b < 0.0001 Yes
176
Table 4. Heat map of the essential oil profile under irrigated and drought conditions
Initial stage Control Control-Recovery Stage Drought Drought -Recovery Stage
Components D0 CD1 CD2 CD3 CRD1 CRD2 CRD3 SD1 SD2 SD3 SRD1 SRD2 SRD3 3-Thujene 0.133 0.03 0.207 0.313 0 0.113 0.337 0.103 0 0.127 0 0.123 0.125 α-pinene 42.92 43.587 38.153 37.323 35.04 38.67 38.737 46.197 44.433 43.577 47.01 46.363 46.14 Camphene 9.46 9.063 9.957 9.987 9.54 9.82 9.947 9.29 9.817 9.72 10.153 9.943 9.8 Verbenene 1.213 1.073 0.723 0.687 1.47 0.683 1.037 1.333 1.39 1.247 1.413 1.267 1.205 o-Cymene 0.18 0.133 0.077 0.707 0.17 0.09 0.137 0.203 0.18 0.16 0.173 0.157 0.155 β-pinene 1.683 2.89 2.883 5.037 5.5 5.01 4.957 1.83 1.837 2.09 1.543 2.01 1.97 3-Octanone 0.28 0.197 0.197 0.21 0.183 0.213 0.213 0.25 0.233 0.21 0.187 0.207 0.22 β-myrcene 3.657 2.49 2.383 2.657 2.66 2.543 2.47 3.04 2.907 2.853 2.943 3.117 3.215 α-phellandrene 0.647 0.453 0.417 0.44 0.433 0.39 0.396 0.543 0.51 0.51 0.49 0.507 0.525 3-Carene 1.71 1.363 0.923 0.967 2.06 0.687 0.98 1.673 1.773 1.6 1.887 1.45 1.41 α -terpinene 0.99 0.737 0.817 0.823 0.607 0.74 0.727 0.797 0.747 0.787 0.707 0.77 0.79 p-Cymene 2.317 1.827 1.637 1.483 2.653 1.797 1.76 2.033 2.213 2.18 2.55 1.94 1.785 D-Limonene 7.487 5.153 5.027 4.55 6.247 4.943 4.053 6.693 6.573 6.67 7.097 6.853 6.705 Eucalyptol 12.993 14.553 19.837 24.42 22.09 24.407 25.077 12.61 11.84 11.33 11.477 12.757 13.115 γ-terpinene 0.903 0.667 0.83 0.91 0.407 0.783 0.853 0.71 0.653 0.703 0.53 0.713 0.685 α- Terpinolene 1.07 0.713 0.72 0.703 0.627 0.66 0.57 0.923 0.887 0.943 0.733 0.893 0.925 Filifolone 0.097 0.087 0.107 0.11 0.11 0.053 0.057 0.127 0.12 0.14 0.1 0.09 0.105 Camphor 4.357 4.437 3.32 3.26 4.326 3.227 3.19 5.609 5.577 5.813 5.04 5.55 5.625 β-pinanone 0.137 0.13 0.08 0 0.14 0.08 0.053 0.14 0.15 0.137 0.167 0.097 0.08 Pinocarvone 0.063 0.043 0 0 0.13 0 0 0.053 0 0 0.05 0 0 endo-Borneol 0.74 0.97 1.17 1.107 0.847 1.1 0.997 0.903 1.033 1.03 0.867 0.787 0.72 3-Pinanone 0.493 0.48 0.41 0.4 0.427 0.37 0.347 0.58 0.61 0.58 0.497 0.51 0.485 D-Verbenone 0.853 0.27 0.327 0.373 0.18 0.277 0.263 0.207 0.21 0.22 0.18 0.187 0.15 Bornyl acetate 0.263 0.2 0.41 0.63 0.093 0.413 0.393 0.263 0.32 0.453 0.183 0.3 0.33 Caryophyllene 0.177 0.237 0.387 0.363 0.137 0.293 0.32 0.17 0.183 0.183 0.13 0.155 0.165
3.2 Correlation between major essential oil compounds
Herewith correlation analysis, it was aimed to determine whether the coefficient and directions of correlation vary with the drought or not. Hence, correlation analysis for both drought and control group were separately performed. Accordingly, correlation coefficients between major essential compounds of rosemary leaves under irrigated and drought conditions were given in Table 5-6. According to the correlation matrix of the major compounds in leaves, under regular irrigated conditions (control), there were positive correlations between α-pinene and β-myrcene (r=0,428), α-pinene and D-limonene (r=0,285), α-pinene and camphor (r=0,435), camphene and eucalyptol (r=0,774), β-myrcene and p-cymene (r=0,497), β-myrcene and D-limonene (r=0,844), β-myrcene and camphor (r=0,495), p-cymene and D-limonene (r=0,780), p-cymene and D-camphor (r=0,732) and D-limonene and camphor (r=0,754). The remained correlations were negative (Table 5).
177
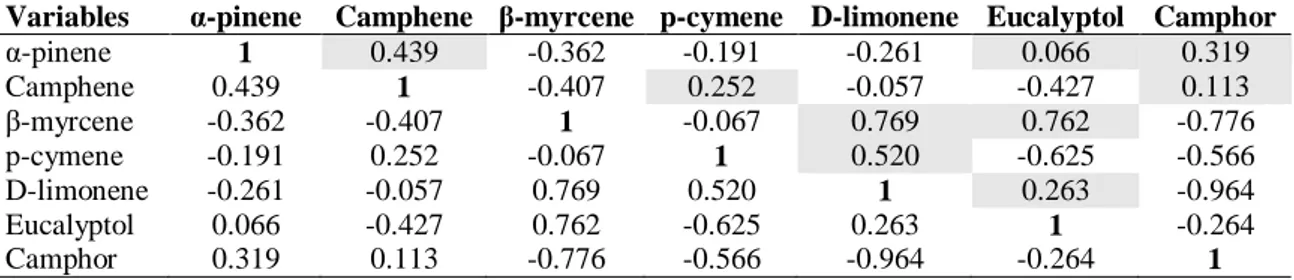
For drought, there were positive correlations between α-pinene and camphene (r=0,439), α-pinene and eucalyptol (r=0,066), α-pinene and camphor (r=0,319), camphene and p-cymene (r=0,252), camphene and camphor (r=0,113), β-myrcene and D-limonene (r=0,769), β-myrcene and eucalyptol (r=0,762), p-cymene and D-limonene (r=0,520) and D-limonene and eucalyptol (r=0,263) (Table 6).
Based on the correlation analysis, changes in coefficient and directions of correlation were observed with drought. Correlation coefficient between α-pinene and camphene, α-pinene and β-myrcene, α-pinene and D-limonene, α-pinene and eucalyptol, camphene and p-cymene, camphene and D-limonene, camphene and eucalyptol, camphene and camphor, myrcene and p-cymene, myrcene and eucalyptol, β-myrcene and camphor, p-cymene and camphor, D-limonene and eucalyptol, D-limonene and camphor. Those results suggest that the coefficient and directions of correlations are not constant but dynamic in response to the varying growth conditions since drought caused metabolic perturbations through inducing or inhibiting biosynthesis pathway of the metabolites, highlighting the responsive structure of the plants against environmental conditions.
Table 5. Correlation matrix (Pearson (n) of essential oil compounds under control
Variables α--pinene Camphene β-myrcene p-cymene D-limonene Eucalyptol Camphor α--pinene 1 -0.638 0.428 -0.097 0.285 -0.793 0.435 Camphene -0.638 1 -0.288 -0.477 -0.509 0.774 -0.908 β-myrcene 0.428 -0.288 1 0.497 0.844 -0.590 0.495 p-cymene -0.097 -0.477 0.497 1 0.780 -0.328 0.732 D-limonene 0.285 -0.509 0.844 0.780 1 -0.698 0.754 Eucalyptol -0.793 0.774 -0.590 -0.328 -0.698 1 -0.782 Camphor 0.435 -0.908 0.495 0.732 0.754 -0.782 1
Table 6. Correlation matrix (Pearson (n) of essential oil compounds under drought
conditions
Variables α-pinene Camphene β-myrcene p-cymene D-limonene Eucalyptol Camphor
α-pinene 1 0.439 -0.362 -0.191 -0.261 0.066 0.319 Camphene 0.439 1 -0.407 0.252 -0.057 -0.427 0.113 β-myrcene -0.362 -0.407 1 -0.067 0.769 0.762 -0.776 p-cymene -0.191 0.252 -0.067 1 0.520 -0.625 -0.566 D-limonene -0.261 -0.057 0.769 0.520 1 0.263 -0.964 Eucalyptol 0.066 -0.427 0.762 -0.625 0.263 1 -0.264 Camphor 0.319 0.113 -0.776 -0.566 -0.964 -0.264 1
178
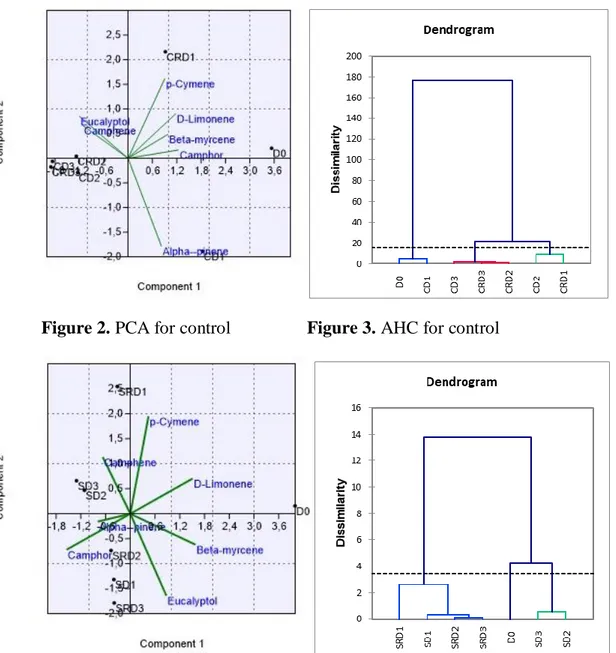
3.3 Principal component analysis (PCA) and Agglomerative hierarchical clustering (AHC)
The discrimination can be evaluated from the principal component analysis scores plot between experimental groups using identified essential oil compounds as shown in Table 7 and Figure 2,4,6. This pair of graphs is a biplot, i.e., essential oil components were more expressed in rosemary leaf samples in the same area of the graph. The experimental groups (D0, SD1, SD2, SD3, CD1, CD2, CD3, SRD1, SRD2,
SRD3, CRD1, CRD2, CRD3) in each group represent a similar essential oil composition,
illustrating that there are significant differences between groups on the level of essential oil components. Along with the present study, we discriminated the groups using the major essential components (α-pinene, camphene, β-myrcene, p-cymene, D-limonene, eucalyptol, camphor) identified herein. Moreover, three principal component analysis were performed to visualize each experimental group (drought and control) and combined group including both groups. In this context, it was aimed to determine whether the compositional changes are stress and developmental dependent or not. For control group, a better discrimination was revealed on the 2-D visualization of the plotted scores, where the two principal components accounted for 84,21 % of total variance. As shown in Table 7 and Figure 2, the first axis and second axis explained 64,195 % and 20,015 % of total variance. As previously stated, that for control group, plants were regularly irrigated for six days. CD2, CD3, CRD2, and CRD3 were clearly
differed from the first day of the treatments (D0 and D1). For stress group, the similar
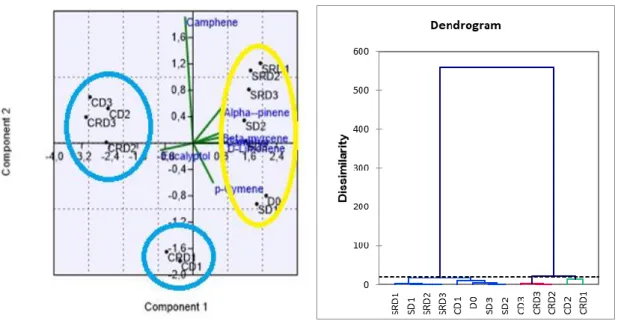
but clearer discrimination was observed, accounting the 76.561 % of total variance (first axis:46. 491 % and second axis: 30.07 %). Considered all experimental groups, results obtained from the principal component analysis showed the presence of the well-discriminated and defined groups for drought and control groups, suggesting that leaf essential oils of rosemary significantly respond to the environmental conditions through not only biomass production but also secondary metabolites. The results were supported and coupled with cluster analysis, as well (Table 8 and Figure 3, 5, 7). For three analysed groups (drought, control and drought + control), three clusters were composed. Of those groups, three classes were observed through cluster analysis for Control + Drought, Class 1 included D0, SD1, SD3, SD2, SRD2, SRD3, SRD, CD1; Class 2
179
all groups, D0 and CD1 were similar to drought groups, indicating that responses against
drought emerged after second day of the treatment (CD2). Furthermore, recovery did not
affect significantly the essential oil composition of drought for clustering discrimination.
Table 7. Principal components (PC) with their eigenvalue and % variance
Control Drought Control + Drought
PC Eigenvalue % variance Eigenvalue % variance Eigenvalue % variance
1 4.49362* 64.195 3.25437 46.491 4.37187 62.455 2 1.40106* 20.015 2.10492 30.07 0.981412 14.02 3 0.860912 12.299 1.17926 16.847 0.913603 13.051 4 0.151363 2.1623 0.409436 5.8491 0.494968 7.071 5 0.066729 0.95327 0.049061 0.70088 0.144715 2.0674 6 0.026314 0.37591 0.002962 0.042313 0.072528 1.0361 *In factor analysis, factors with an eigenvalue greater than or equal to 1 are generally considered to be significant.
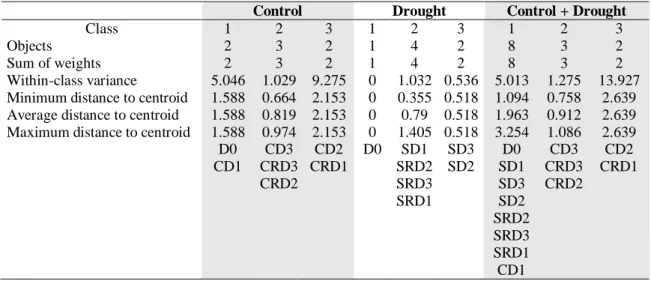
Table 8. Classes by clustering analysis for experimental groups
Control Drought Control + Drought
Class 1 2 3 1 2 3 1 2 3
Objects 2 3 2 1 4 2 8 3 2
Sum of weights 2 3 2 1 4 2 8 3 2
Within-class variance 5.046 1.029 9.275 0 1.032 0.536 5.013 1.275 13.927 Minimum distance to centroid 1.588 0.664 2.153 0 0.355 0.518 1.094 0.758 2.639 Average distance to centroid 1.588 0.819 2.153 0 0.79 0.518 1.963 0.912 2.639 Maximum distance to centroid 1.588 0.974 2.153 0 1.405 0.518 3.254 1.086 2.639
D0 CD3 CD2 D0 SD1 SD3 D0 CD3 CD2 CD1 CRD3 CRD1 SRD2 SD2 SD1 CRD3 CRD1 CRD2 SRD3 SD3 CRD2 SRD1 SD2 SRD2 SRD3 SRD1 CD1
180
Figure 2. PCA for control Figure 3. AHC for control
181
Figure 6. PCA for control and drought Figure 7. AHC for control and drought
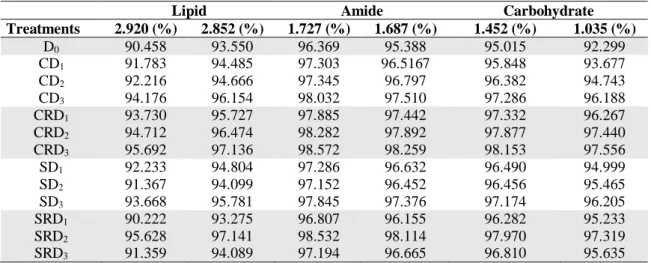
3.4 ATR-FTIR analysis of the samples
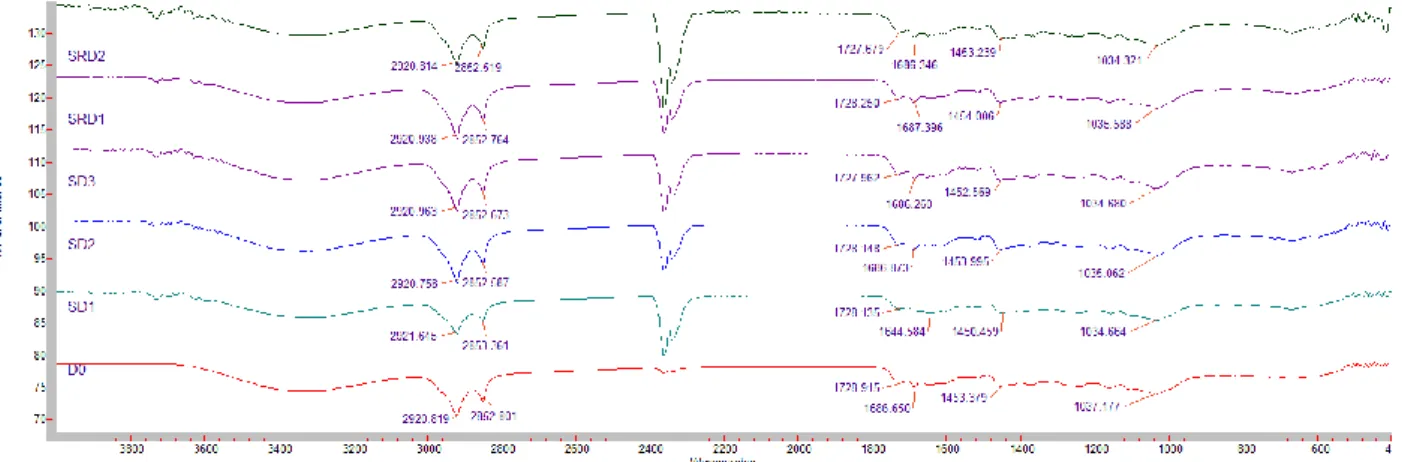
As reported in many and various studies, it has been emphasized on the possible and plausible uses of FTIR spectroscopy regarding providing quick and high throughput data on drought stress [23, 47]. After normalization of FTIR spectra, the changes in lipids, amides, and carbohydrates in the control and drought stressed plants were determined. The results concerned with the intensities of the experimental groups were given in Table 9, Figure 8, 9, 10. The intensities: 2920 to 2852, 1727 to 1687 and 1452 to 1035 cm-1 bands corresponding to the lipids, amides, and carbohydrates, respectively were higher in CRD1, CRD2, CRD3, CD3, SD3, SRD1. Considered all experimental
groups, the intensities were partially higher in control group. The similar results were reported in Zea mays exposed to progressive drought [23].
Herewith, the lowest bands were seen at SRD1 for lipid, amide and carbohydrate
regions (except at band 1035). However, there were differential responses in the intensities at lipid, amide and carbohydrate regions for other drought stressed and recovered stress groups. Furthermore, we should note that the highest bands were observed at SRD2 out of stressed groups and lipid, amide and carbohydrate regions for
182
developmental stage and stress dependent protein, lipid and carbohydrate profiles can be revealed.
Table 9. Changes in lipid, amide and carbohydrate regions
Lipid Amide Carbohydrate
Treatments 2.920 (%) 2.852 (%) 1.727 (%) 1.687 (%) 1.452 (%) 1.035 (%) D0 90.458 93.550 96.369 95.388 95.015 92.299 CD1 91.783 94.485 97.303 96.5167 95.848 93.677 CD2 92.216 94.666 97.345 96.797 96.382 94.743 CD3 94.176 96.154 98.032 97.510 97.286 96.188 CRD1 93.730 95.727 97.885 97.442 97.332 96.267 CRD2 94.712 96.474 98.282 97.892 97.877 97.440 CRD3 95.692 97.136 98.572 98.259 98.153 97.556 SD1 92.233 94.804 97.286 96.632 96.490 94.999 SD2 91.367 94.099 97.152 96.452 96.456 95.465 SD3 93.668 95.781 97.845 97.376 97.174 96.205 SRD1 90.222 93.275 96.807 96.155 96.282 95.233 SRD2 95.628 97.141 98.532 98.114 97.970 97.319 SRD3 91.359 94.089 97.194 96.665 96.810 95.635
The values are of the means of three replicates
183
Figure 9. FTIR results for the drought stressed groups
Figure 10. FTIR results for control groups
3.5 Highlights and Limitations of the study& Future outlook
Up to best knowledge, this is the first study concerned with essential oil changes on successive days under irrigated and non-irrigated conditions. Along with the study, the essential oil components in leaves of rosemary were monitored for six days for both experimental groups but the essential oil yield was not reported. In the first forthcoming studies, the essential oil yield coupled with components might be examined since the quality and bio-efficacy or other uses of essential oil are dependent on yield and its components.
4. Conclusion
Herewith, the possible influence of the drought stress on rosemary leaf essential oil profiles was monitored. In this context, leaf samples were harvested on consecutive days in order to screen the changes by the time and severity caused by drought.
184
Accordingly, the expected major compounds were determined but in different percentage, which was hypothesized as consequences of stress and developmental stages. Along with the current study, α-pinene, camphene, β-pinene, β-myrcene, p-cymene, D-limonene, eucalyptol, and camphor are of the major compounds, representing the 84.874 % of the identified compounds. Of those compounds, α-pinene, myrcene, and camphor percentage increased with the drought but the percentage of β-pinene decreased. Moreover, the changes in lipid, amide, and carbohydrate regions for the samples were monitored and considered all experimental groups, the intensities of the leaves of groups were partially higher in control group, suggesting that major metabolites might be consumed or allocated into different parts of the plant. Finally, the experimental groups were clearly discriminated and confirmed using differential statistical tools, suggesting the plausible role of metabolites in response to the changing environmental conditions.
5. Acknowledgments
Thanks to those who do their best for humanity and for a better world. Thanks to those who do good in all circumstances throughout their lives.
References
[1] Hamrouni, I., Salah, H. B., Marzouk, B., Effects of water-deficit on lipids of safflower aerial parts, Phytochem., 58, 277–80, 2001.
[2] Laribi, B., Bettaieb, I., Kouki, K., Sahli, A., Mougou, A., Marzouk, B., Water deficit effects on caraway (Carum carvi L.) growth, essential oil and fatty acid composition, Ind Crops Prod., 30, 372–379, 2009.
[3] Sangwan, N. S., Farooqi, A. H. A., Shabih, F., Sangwan, R.S., Regulation of essential oil production in plants, Plant Growth Regul., 34, 3–21, 2001.
[4] Kleinwächter, M., Paulsen, J., Bloem, E., Schnug, E., Selmar, D., Moderate drought and signal transducer induced biosynthesis of relevant secondary metabolites in thyme (Thymus vulgaris), greater celandine (Chelidonium majus) and parsley (Petroselinum crispum), Ind Crops Prod., 64, 158–166, 2015.
185
[5] Szabó, K., Radácsi, P., Rajhárt, P., Ladányi, M., Németh, É., Stress-induced changes of growth, yield and bioactive compounds in lemon balm cultivars, Plant Physiol Biochem., 119, 170–177, 2017.
[6] Laribi, B., Kouki, K., Sahli, A., Mougou, A., Marzouk, B., Essential oil and fatty acid composition of a Tunisian caraway (Carum carvi L.) seed ecotype cultivated under water deficit, Adv. Environ. Biol., 257–265, 2011.
[7] Bettaieb, I., Knioua, S., Hamrouni, I., Limam, F., Marzouk, B., Water-deficit impact on fatty acid and essential oil composition and antioxidant activities of cumin (Cuminum cyminum L.) aerial parts, J Agric Food Chem., 59, 328–334, 2011.
[8] Baghalian, K., Abdoshah, S., Khalighi-Sigaroodi, F., Paknejad, F., Physiological and phytochemical response to drought stress of German chamomile (Matricaria recutita L.), Plant Physiol Biochem., 49, 201–207, 2011.
[9] Khorasaninejad, S., Mousavi, A., Soltanloo, H., Hemmati, K., Khalighi, A., The effect of drought stress on growth parameters, essential oil yield and constituent of Peppermint (Mentha piperita L.). J. Med. Plants Res., 5, 5360–5365, 2011.
[10] Corell, M., Garcia, M. C., Contreras, J. I., Segura, M. L., Cermeño, P., Effect of Water Stress on Salvia officinalis L. Bioproductivity and Its Bioelement Concentrations, Commun Soil Sci Plant Anal., 43, 419–425, 2012.
[11] Bettaib-Rebey, I. B., Jabri-Karoui, I., Hamrouni-Sellami, I., Bourgou, S., Limam, F., Marzouk, B., Effect of drought on the biochemical composition and antioxidant activities of cumin (Cuminum cyminum L.) seeds, Ind Crops Prod., 36(1), 238–245, 2012.
[12] Farhoudi, R., Effect of drought stress on growth, physiology and flower essential oil yield of Iranian chamomile (Matricaria recutita L.) in south of Iran, Res Crop., 13, 694–699, 2012.
[13] Bahreininejad, B., Razmjoo, J., Mirza, M., Influence of water stress on morphophysiological and phytochemical traits in Thymus daenensis. Int J Plant Pro., 7, 151–166, 2013.
186
[14] Yadav, R. K., Sangwan, R. S., Sabir, F., Srivastava, A. K., Sangwan, N. S., Effect of prolonged water stress on specialized secondary metabolites, peltate glandular trichomes, and pathway gene expression in Artemisia annua L., Plant Physiol Biochem., 74, 70–83, 2014.
[15] Bahreininejad, B., Razmjoo, J., Mirza, M., Effect of water stress on productivity and essential oil content and composition of Thymus carmanicus, J Essent Oil Bear Pl., 17, 717–725, 2014.
[16] Farhoudi, R., Lee, D. J., Hussain, M., Mild drought improves growth and flower oil productivity of German chamomile (Matricaria recutita L.), J Essent Oil Bear Pl., 17, 26–31, 2014.
[17] Alinian, S., Razmjoo, J., Phenological, yield, essential oil yield and oil content of cumin accessions as affected by irrigation regimes, Ind Crops Prod., 54, 167– 174, 2014.
[18] Miguel, M. G., Guerrero, C., Rodrigues, H., Brito, J., International Conference on Energy, Environment, Ecosystems and Sustainable Development, Agios Nikolaos, Greece, 24–26, 2007.
[19] Chahboun, N., Esmail, A., Rhaiem, N., Abed, H., Amiyare, R., Barrahi, M., ... & Ouhssine, M., Extraction and study of the essential oil Rosmarinus officinalis cuellie in the region of Taza, Morocco, Der Pharma Chem., 6(3), 367–372, 2014.
[20] Zaouali, Y., Messaoud, C., Ben Salah, A., Boussaid M., Oil composition variability among populations in relationship with their ecological areas in Tunisian Rosmarinus officinalis L., Flavour Fragrance J., 20 (5), 512–520, 2005.
[21] Szumny, A., Figiel, A., Gutiérrez-Ortíz, A., Carbonell-Barrachina, Á. A., Composition of rosemary essential oil (Rosmarinus officinalis) as affected by drying method, J Food Eng., 97(2), 253–260, 2010.
[22] Farhoudi, R., Effect of drought stress on chemical constituents, photosynthesis and antioxidant properties of Rosmarinus officinalis essential oil, Journal of Medicinal Plants and By-Products, 2(1), 17–22, 2013.
187
[23] Ogbaga, C. C., Miller, M. A., Johnson, G. N., Fourier transform infrared spectroscopic analysis of maize (Zea mays) subjected to progressive drought reveals involvement of lipids, amides and carbohydrates, Afr J Biotechnol., 16(18), 1061–1066, 2017.
[24] Amir, R. M., Anjum, F. M., Khan, M. I., Khan, M. R., Pasha, I., Nadeem, M., Application of Fourier transform infrared (FTIR) spectroscopy for the identification of wheat varieties, J. Food Sci. Technol., 50, 1018–1023, 2013.
[25] Kuhnen S., Ogliari, J. B., Dias, P. F., Boffo, E. F., Correia, I., Ferreira, A. G., Delgadillo, I., Maraschin, M., ATR-FTIR spectroscopy and chemometric analysis applied to discrimination of landrace maize flours produced in southern Brazil, Int. J. Food Sci., Technol., 45, 1673–1681, 2010.
[26] Yang, J., Yen, H. E., Early salt stress effects on the changes in chemical composition in leaves of ice plant and Arabidopsis. A Fourier transform infrared spectroscopy study, Plant Physiol., 130(2), 1032–1042, 2002.
[27] Zhou, G., Taylor, G., Polle, A., FTIR-ATR-based prediction and modelling of lignin and energy contents reveals independent intra-specific variation of these traits in bioenergy poplars, Plant Methods, 7(1), 9, 2011.
[28] Baciu, A., Ranga, F., Fetea, F., Zavoi, S., Socaciu, C., Fingerprinting food supplements and their botanical ingredients by coupled UV/Vis/FTIR spectrometry, Bulletin of University of Agricultural Sciences and Veterinary Medicine Cluj-Napoca: Food Science and Technology, 70(1), 8–15, 2013.
[29] Lakshmi, C. N. D. M., Raju, B. D. P., Madhavi, T., Sushma, N. J., Identification of bioactive compounds by FTIR analysis and in vitro antioxidant activity of Clitoria ternatea leaf and flower extracts, Indo Am. J. Pharm., 3894–3903, 2014. [30] Lakshmi, T., Ramasamy, R., Thirumalaikumaran, R. Preliminary Phytochemical analysis and In vitro Antioxidant, FTIR Spectroscopy, Anti-diabetic activity of Acacia catechu ethanolic seed extract, Pharmacogn Mag., 7(6), 356–362, 2015.
188
[31] Lan, F., Kong, D., Li, Y., Huang, R., Studies on the changes of protein secondary structure and carbohydrate contents in seedling-stage of Abrus cantoniensis hance in drought stress based on FTIR and chemometrics, Pak. J. Bot, 47(4), 1311– 1316, 2015.
[32] Santos-Gomes, P. C., Fernandes-Ferreira, M., Organ-and season-dependent variation in the essential oil composition of Salvia officinalis L. cultivated at two different sites, J. Agric. Food Chem., 49(6), 2908–2916, 2001.
[33] Taarit, M. B., Msaada, K., Hosni, K., Marzouk, B., Changes in fatty acid and essential oil composition of sage (Salvia officinalis L.) leaves under NaCl stress, Food Chem., 119(3), 951–956, 2010.
[34] Hassan, F. A. S., Bazaid, S., Ali, E. F. Effect of deficit irrigation on growth, yield and volatile oil content on Rosmarinus officinalis L. plant, J. Med. Plant. Stud., 1(3), 12–21, 2013.
[35] Tounekti, T., Vadel, A. M., Bedoui, A., Khemira, H., NaCl stress affects growth and essential oil composition in rosemary (Rosmarinus officinalis L.), Hortic Sci Biotechnol., 83(2), 267–273, 2008.
[36] Langroudi, M. E., Sedaghathoor, S., Bidarigh, S., Effect of different salinity levels on the composition of rosemary (Rosmarinus officinalis) essential oils, Am. Eur. J. Agric. Environ. Sci., 13, 68–71, 2013.
[37] Bettaieb, I., Zakhama, N., Wannes, W. A., Kchouk, M. E., Marzouk, B., Water deficit effects on Salvia officinalis fatty acids and essential oils composition, Sci Hortic., 120(2), 271–275, 2009.
[38] Petropoulos, S. A., Daferera, D., Polissiou, M. G., Passam, H. C., The effect of water deficit stress on the growth, yield and composition of essential oils of parsley, Sci Hortic., 115(4), 393–397, 2008.
[39] Zali, A. G., Ehsanzadeh, P., Szumny, A., Matkowski, A., Genotype-specific response of Foeniculum vulgare grain yield and essential oil composition to proline treatment under different irrigation conditions, Ind Crops Prod., 124, 177–185, 2018.
189
[40] Baher, Z. F., Mirza, M., Ghorbanli, M., Bagher Rezaii, M., The influence of water stress on plant height, herbal and essential oil yield and composition in Satureja hortensis L., Flavour Fragr. J., 17(4), 275–277, 2002.
[41] Khalid, K. A., Influence of water stress on growth, essential oil, and chemical composition of herbs (Ocimum sp.), Int. Agrophys., 20(4), 289–296, 2006.
[42] Razavizadeh, R., Komatsu, S., Changes in essential oil and physiological parameters of callus and seedlings of Carum copticum L. under in vitro drought stress, Food Meas Charact., 1–12, 2018.
[43] Toncer, O., Karaman, S., Kizil, S., Diraz, E., Changes in essential oil composition of oregano (Origanum onites L.) due to diurnal variations at different development stages, Notulae Botanicae Horti Agrobotanici Cluj-Napoca, 37(2), 177– 181, 2009.
[44] Cetinkaya, H., Kulak, M., Karaman, M., Karaman, H. S., Kocer, F., Flavonoid Accumulation Behavior in Response to the Abiotic Stress: Can a Uniform Mechanism Be Illustrated for All Plants? In: Flavonoids-From Biosynthesis to Human Health, Justino, G. C. (eds), InTech., Rijeka, Croatia, pp. 151–165, 2017.
[45] Selmar, D., Kleinwächter, M., Influencing the product quality by deliberately applying drought stress during the cultivation of medicinal plants, Ind Crops Prod., 42, 558–566, 2013.
[46] Tátrai, Z. A., Sanoubar, R., Pluhár, Z., Mancarella, S., Orsini, F., Gianquinto, G., Morphological and physiological plant responses to drought stress in Thymus citriodorus. Int. J. Agron., 1–9, 2016.
[47] Lahlali, R., Jiang, Y., Kumar, S., Karunakaran, C., Liu, X., Borondics, F., ... & Bueckert, R., ATR–FTIR spectroscopy reveals involvement of lipids and proteins of intact pea pollen grains to heat stress tolerance, Front Plant Sci., 5, 747, 2014.