An Integration of Neural Network and Shuffled Frog-Leaping
Algorithm for CNC Machining Monitoring
Alireza Goli1,*, Erfan Babaee Tirkolaee2, Gerhard-Wilhelm Weber3,4
Abstract. This paper addresses Acoustic Emission (AE) from Computer Numerical Control (CNC) machining operations. Experimental measurements are performed on the CNC lathe sensors to provide the power consumption data. To this end, a hybrid methodology based on the integration of an Artificial Neural Network (ANN) and a Shuffled Frog-Leaping Algorithm (SFLA) is applied to the data resulting from these measurements for data fusion from the sensors which is called SFLA-ANN. The initial weights of ANN are selected using SFLA. The goal is to assess the potency of the signal periodic component among these sensors. The efficiency of the proposed SFLA-ANN method is analyzed compared to hybrid methodologies of Simulated Annealing (SA) algorithm and ANN (SA-ANN) and Genetic Algorithm (GA) and ANN (GA-ANN).
Keywords: Artificial Neural Network, Shuffled Frog-Leaping Algorithm, Simulated Annealing, Genetic Algorithm, CNC machining; Multi-sensor data fusion.
1. Introduction
NomenclatureACO Ant Colony Optimization AE Acoustic Emission
AFSA Artificial Fish Swarm Algorithm ANN Artificial Neural Network CNC Computer Numerical Control COA Cuckoo Optimization Algorithm CoD Coefficient of Determination
1Department of Industrial Engineering, University of Isfahan, Isfahan, Iran, [email protected]
2Department of Industrial Engineering, Istinye University, Istanbul, Turkey, [email protected]
3Faculty of Engineering Management, Poznan University of Technology, Poznan, Poland, [email protected]
4Institute of Applied Mathematics, Middle East Technical University, Ankara, Turkey
ISSN 0867-6356 e-ISSN 2300-3405 DOI: 10.2478/fcds-2021-0003
ELM Extreme Learning Machines GA Genetic Algorithm
LLA Largest Lyapunov Exponent
GA-ANN Genetic Algorithm and Artificial Neural Network MSE Mean Squared Error
PCC Pearson Correlation Coefficient PSO Particle Swarm Optimization RMSE Root Mean Square Error RRA Runner Root Algorithm SA Simulated Annealing
SA-ANN Simulated Annealing and Artificial Neural Network SFLA Shuffled Frog-Leaping Algorithm
SFLA-ANN Shuffled Frog-Leaping Algorithm and Artificial Neural Network
TS Tabu Search
Computer Numerical Control (CNC) machining process necessitates quality improvement as well as minimizing the production time and cost. A CNC system appertains to the reliability and robustness of a monitoring system while there are numerous difficulties in the monitoring system. As an example, new advanced components consist of complex geometry and need complex tools with an assortment of machining methods. Moreover, some materials have cutting issues where it may lead to a tool failure [24]. An inclusive review of sensor machinery, signal processing, and decision-making approaches have been presented by Teti et al. [33] for process monitoring. Wang et al. [3] have developed an efficient procedure (with open design) for instantaneous observation in addition to the distant control of CNC machines. Xu et al. [43] created an efficient sign of unfaltering fault specification by the implementation of the wavelet energy approach and suggested a new plan to determine the cut-in and cut-out situations, consequently successfully providing an unparalleled definition quantitatively of the specification of various faults and cutting circumstances in the monitoring system. The impact of three kinds of signals for the on-line inspection and analysis of the surface finishes in automated taper turning operations is described in the study [17]. The system is prepared using Artificial Neural Network (ANN) and regression analysis. Acoustic emission, cutting force signals and mechanical vibration were considered by the proposed system.
One of the well-known techniques is to measure and analyze Acoustic Emission (AE) from machining operations. AE has already been employed in numerous engineering systems with the aim of fault recognition [20, 14]. Guo and Ammula [19] described the basic information required in the development of applied on-line AE monitoring system to check the surface integrity in hard machining. However, AE procedure is not completely reliable since some other sources can emanate sound and distract the sensors. Masmoudi et al. [26] demonstrated that the positions of the source of damages in acoustic events are far from the positions of the coordinated sensors. Caesarendra et al. [8] studied a feature extraction technique of AE waveform by implementing the Largest Lyapunov Exponent (LLA) algorithm and could show that the suggested algorithm can identify the failure signs prior to the AE hit parameters with improved prediction of the advancing trend of the defect. Furthermore, a lot of research has been made on different prediction methods like Extreme Learning Machines (ELM) [6,31,40,42]. Liao and Axinte [25] have demonstrated
micro-drilling of the bovine rib bone using the AE sensory methods. It proves the efficiency of AE sensory methods in controlling the micro-drilling procedure. They investigated the signals emitted from three AE sensors to identify the sensor with the best-represented signal and the best position of the sensor for being consistent with the highest periodic component potency which is relevant to the rotation period of cutting tools. Dai and Zhu [11] introduced a machine vision system for monitoring micro-milling tool conditions. They designed some image processing algorithms to minimize downtime.
Formerly, several numerical techniques have been suggested for modeling of the AE derived from CNC machining, however, this research designs a feed-forward ANN method hybridized with a Shuffled Frog-Leaping Algorithm (SFLA) for data fusion from three sensors in order to evaluate the signal periodic component potency among the existing sensors. ANN is a nonlinear analysis method which is widely adopted in the analysis of well logs data with the objective to estimate the properties of the reservoir [41]. The organization of neurons and related parameters plays a key role in the efficiency of the ANN method. Some evolutionary methods like Genetic Algorithm (GA) [27], Pruning Algorithm [2], and Simulated Annealing (SA) [9] were applied in the structure optimization of ANN. Besides that the social behavior based evolutionary algorithms were also established to solve the earlier issue. SFLA is one of these types of algorithms according to the simulation of the social behaviors of the frogs. In the current study, the SFLA method is deployed in the feed-forward ANN method specifically to optimize its weight values. The analysis outcomes exhibit the efficiency and perspective of the SFLA-ANN method for multi-sensor data fusion compared to SA-ANN and GA-ANN methods.
The remaining sections are organized as follows. Section 2 introduces the methodology of the research and the proposed model of SFLA-ANN is discussed in Section 3. The obtained results and consequent analyses are provided in Section 4. Finally, the concluding remarks and outlook of the research are presented in Section 5.
2. Methodology
2.1. Experimental measurement
Stress wave emission denotes AE and represents a sound specification such that elastic energy is transformed into mechanical vibration due to the fracture and deformation process on the tool, workpiece and machine body [15]. AE can be an impermanent or persistent signal emitted from cutting operations. AE sensor can be utilized for checking machining processes such as roughness, peculiarities, tool wear and so forth [21]. The corrupted response of the AE sensor can be disintegrated into real signal and noise constituents. The signal component represents a waveform of k periods in line with the cutting tool rotation; i.e., k denotes the period of cutting tool rotation. Noise is regarded as an aperiodic component. In order to assess the potency of the periodic component in time-discrete signal with N points {𝑥[0], 𝑥[1], … , 𝑥[𝑁 − 1]}, the auto-correlation coefficient is expressed as follows [22]:
𝑪[𝒌] = 𝟏
(𝑵 − 𝒌)𝝈𝒙𝟐 4 (𝒙[𝒏] − 𝝁𝒙)(𝒙[𝒏 + 𝒌] − 𝝁𝒙) 𝑵$𝒌$𝟏
𝒏(𝟎
. (1)
where 𝜇* and 𝜎*+ denote the average and variance of the signal 𝑥[𝑛], respectively. The fault model of CNC machining can be described as follows [43].
𝒀(𝒕) = 𝒇(𝒙(𝒕),𝚯) + 𝜺𝒕+ 𝜼𝜹𝒕,𝝉, (2)
𝜹𝒕,𝝉= C𝟏, 𝒕 ≥ 𝝉,𝟎, 𝒕 < 𝝉. (3) where Y(t) is the output vector of the CNC monitoring progress. Moreover, Θ is the model parameter and determines the complexity of the monitoring, and 𝜀/ is the model noise which is caused by uncontrolled variables. Moreover, after time τ, the system needs to be reviewed and it is defined by 𝛿/,0. In other words, 𝛿/,0 indicates the reviewing requirement for the CNC monitoring. Here, 𝜂 denotes the output change rate. Then, the energy of the low-frequency signal can be calculated by Eq. (4):
𝑬𝑱= 4‖𝒙𝒊‖𝟐. 𝒊
(4)
The wavelet coefficients of the smooth part can be calculated to prevent signals from being disturbed by the noises. For this purpose, parameter NS is determined, which is the perfect frequency segment of finding features from the original signals [43].
𝑬𝑯 𝑬𝑳 = 𝑬𝑯(𝑵𝑺) + ∑ 𝑬𝒊 𝑯(𝒅𝒊) 𝑬𝑳(𝑵𝒔) + ∑ 𝑬𝒊 𝑳(𝒅𝒊) ≥ 𝟏 + 𝑽𝟐 𝑽𝟏 = 𝑲. (5)
where EL and EH denote the minimum and maximum energy released by cutting noises. Here,
V1 and V2 are the root of squares of frequency signals in the standard and cutting noise signals respectively.
The measure of the samples’ similarity is provided by the coefficient. As an instance, the coefficient can estimate the stability of the system. If the coefficient takes value near to 1, the system is considered to be stable, else if it takes value near to 0, the system is regarded to be unstable. In fact, the coefficient implicates the periodic component potency as the rotation period of the cutting tool. Accordingly, the signal measurement quality during the CNC machining process can be estimated such that it involves rotary tools. This procedure is employed in multi-sensor data fusion to identify the best signal representation [22]. Furthermore, three cutting factors are chosen as inputs. The output parameter defines the potency of the signal periodic component among the sensors which is calculated according to the above analysis. Table 1 represents three input and output factors that are studied in this research.
Table 1. Input and output factors.
Input/output Factors description
Input 1 Speed of Spindle (rpm)
Input 2 Feed rate (mm/min)
Input 3 Cutting Depth (mm)
Output Potency of the signal periodic component
2.2. Artificial neural network
ANN method progresses the information in a parallel way to explore the complicated and nonlinear relationship between the input-output variables of any experimental data set. It generates a nonlinear mapping between the latter two variables during the training [24]. The mapping efficiency of ANN is affected by many factors, including the pre-processing procedure of the data set, the structure of ANN (number of hidden layers, and number of neurons in hidden layers), transfer function, training algorithm, etc. [12]. The feed-forward neural network is the most accepted and simplest type of ANN in which the signal transmits from the input to output layers through the hidden layers in a forward direction while error propagates in the backward direction to optimize the weights with the objective to achieve the closest value of target output variables [23,5].
ANN includes an input layer, one or more hidden layers, and an output layer. Each layer has a number of processing units, and each unit is fully linked with weighted connections to units in the next layer. The N input converts to L output through nonlinear functions. The units of the neural network are calculated by Eq. (6):
𝑥5= 𝑓 U4 𝑥6𝑤65 6
W. (6)
In Eq. (6), f(X) is activation function, xh is activation of hth hidden layer node and who is
the interconnection between hth hidden layer node and oth output layer node. The most
common activation function to the sigmoid that is based on Eq. (7).
𝑥5= 1
1 + exp (− ∑ 𝑥66 𝑤65). (7)
The quality of the output of ANN is specified by comparing output (y) and available targets (o).
During the training weights and bias of all neurons in the network were optimized till the output layer neurons produce approximate values of the target. Mean Squared Error (MSE) of the network is determined for in between the output layer neurons and the target values [29]: 𝑴𝑺𝑬 =𝟏 𝟐4 4 ]𝒀𝒋(𝒌) − 𝑻𝒋(𝒌)_ 𝟐 . 𝒎 𝒋(𝟏 𝑮 𝒌(𝟏 (8)
where G and m respectively represent the number of training samples and output variables, 𝑌:(𝑘) denotes the jth output of the variable k obtained by proposed ANN method, and 𝑇:(𝑘) is the jth target value of variable k. The experimental data set is divided into two
parts as 1. training and 2 . validation in the analysis with the ANN. The model is built up using the training data set. The accuracy of the model is predicted using the validation data set. During the training of the model, the weights and bias values of each neuron in the network are optimized to minimize the MSE, which lead to an increase in the accuracy of the prediction. As MSE is a quadratic objective, the optimization should be applied by using a novel meta-heuristic algorithm which is fast and accurate enough. In this research, SFLA is suggested and implemented.
2.3. Shuffled frog leaping algorithm
Eusuff and Lansey [16] suggested a post-empirical computing expertise of swarm intelligence referred to SFLA. The SFLA is a novel evolutionary algorithm that has several advantageous features including simplicity, limited parameters and quick computation, global optimization and simple realization, etc. In SFLA the frog population is distributed into numerous sub-populations with diverse beliefs. Each of the sub-populations was involved in the deep-searching of a confined area in the solution space using a specific approach. This is affected by the individual and combined thoughts of frog in the sub-population evolution [37].
After a fixed number of epochs thoughts were switched in the sub-population. The balanced approach between the global information interchange and limited area deep-searching assists SFLA to move toward global optimization by jumping out the local extreme. In a target search space of D-dimensions, the random population of P frogs represents the solution, for instance, the ith frog denotes the clarification of the problem The arrangement of the frog population into several sub-populations (in good to bad) is done based on their fitness. For example, the frog of rank 1 is allocated into the 1st sub-population, frog of rank 2 is allocated into the 2nd sub-population, and the frog of rank M is allocated into the Mth sub-population. This process is continued till all the frogs were assigned onto some sub-population [10].
Each of the sub-population was employed for limited area deep-searching, which decides the poorest individual , the finest one and overall best one from the sub-population in each of the iterations. The worst individual is updated further. A novel is produced randomly if no enhancement in the fitness value of is observed, which is continued until it satisfies the updated algebra condition. All frogs from different sub-population were mixed into a new sub-population after completing the local area deep-searching. Then, the local area deep-searching process is continued till the decided iteration number reached [44,1].
During the splitting process, the order of frog locations is defined as follows. The first frog is located in the first memeplex, the second frog in the second memeplex, mth frog in the mth memeplex, but m+1th frog is located again in the first memeplex, and the process continues in the same manner. Each memeplex represents the frogs with the best and worst levels of merit, respectively by andThe frog with the best level of merit in the entire population is . represented by . Next, an interactive process is used to alter the merit of worst frogs of each
1 2 ( , ,..., ). i i i iD X = x x x w x xb
x
g w x xw w x bx
wx
g xiteration (not all frogs). During the evolution process, frogs modify their positions to get closer to the best frog. This modification is done using the following relationship [4]:
Step size
New position of = Current position of + (9)
where rand () shows a random value which takes value in the range of {0, 1} and denotes the maximum permissible range that frogs can leap once affected by others. If a better solution is found during this process, the worst frog will be replaced, but otherwise, the above relationship will be recalculated with the best frog in the entire population (i.e., will be replaced with and this relationship will be recalculated). If it does not lead to any improvement, a new randomly generated solution will be substituted with the worst frog, and then the calculations will be repeated for a limited number of times [16]. The flowchart of SFLA is depicted in Figure 1.
Figure 1. Flowchart of SFLA [4].
() ( ), i b w s =rand ´ x -x w x xw
s
i,
max i max.
s
s
s
-
£ £
maxs
bx
x
g2.4. Simulated annealing
The optimizations conducted by SA algorithm provide solutions that are sufficiently good but might nevertheless be sub-optimal. This approach is perfect for finding quick or initial solutions for not so critical optimization problems [34]. For more complex or more critical problems, it is best to use or combine other optimization approaches such as hill-climbing, GAs, gradient descent, etc. However, one advantage of SA is its ability to avoid convergence to the points of local optimum, which seem to be optimal with respect to their immediate vicinity but are quite sub-optimal with respect to a larger area of search space [32].
2.5. Genetic algorithm
The notion of genetics and natural evolution of selection acts as the source of inspiration for the development of a series of adaptive heuristic search algorithms which are known as GAs. GA seeks to combine random searches with intelligent selection to solve optimization problems. This combination means that the mentioned search is not random as such, but instead relies on historical information to shift the focus to more desirable areas of search space. As mentioned, the central idea of GAs has been inspired by Darwin’s theory of natural selection commonly known by the phrase “survival of the fittest”, which points to the better ability of fitter organisms to compete for scarce resources [13]. In GAs, the solutions with the fittest genetics breed the next generation and this process continues for a number of iterations. The population of each generation contains a number of character strings that display chromosomes. In the search space of GA, each possible solution is represented by a single organism that must compete for the right of survival [28].
The above-mentioned competition transforms into the competition of genetic structures and chromosomes of organisms based on the following notions [39].
I. Competition of organisms for resources and mates,
II. Higher reproduction rate of fitter organisms as compared to their weaker counterparts,
III. Propagation of good genes from fit parents to their offspring, possibly leading to even fitter children,
IV. Higher fitness of each generation with respect to the environment, i.e., search space.
3. SFLA-ANN Model
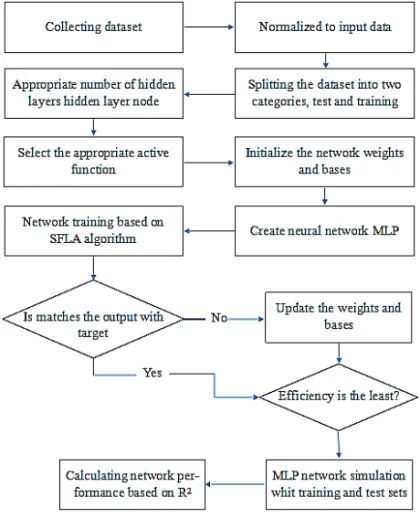
In this section, feed-forward back-propagation ANN is employed to build fusion models. The experimental data from the three sensors were used as the input of ANN. The perfect structure of ANN is (3×7×1); i.e. three neurons in the input layer, seven neurons in the hidden layer and one neuron in the output layer. Levenberg-Marquardt algorithm is used to train the ANN using the sigmoid and linear transfer functions in the hidden and output layers, respectively. The ANN is optimized by SFLA while using MSE as the cost function which is minimized by the latter. The initial weights of the neurons in the network were assumed between -1 to +1. The primary particles of the SFLA were considered equal to the randomly generated weights in between -1 to +1. The 70% samples of the experimental data set are selected by
random for the training of ANN while the rest 30% of samples were used as the validation set to test the efficiency of the method. Figure 2 illustrates ANN’s flowchart including SFLA.
Figure 2. Flowchart of the proposed SFLA-ANN.
4. Analysis
4.1. Estimation of accuracy evaluation
The performance of the suggested methods was assessed based on three statistical measures. The mathematical descriptions of statistical measures are given below to enumerate three measures of Root Mean Square Error (RMSE), Pearson Correlation Coefficient (PCC) and Coefficient of Determination (CoD).
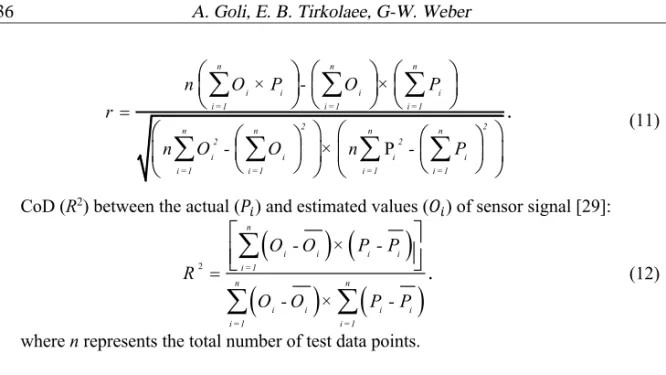
RMSE between the actual (𝑃;) and estimated values (𝑂;) of sensor signal [29]:
(10)
PCC (𝑟) between the actual (𝑃;) and estimated values (𝑂;) of sensor signal [29]: 2 1 ( )
.
n i i i P O RMSE n = -=å
(11)
CoD (R2) between the actual (𝑃;) and estimated values (𝑂;) of sensor signal [29]:
(12)
where n represents the total number of test data points.
4.2. Algorithms’ output
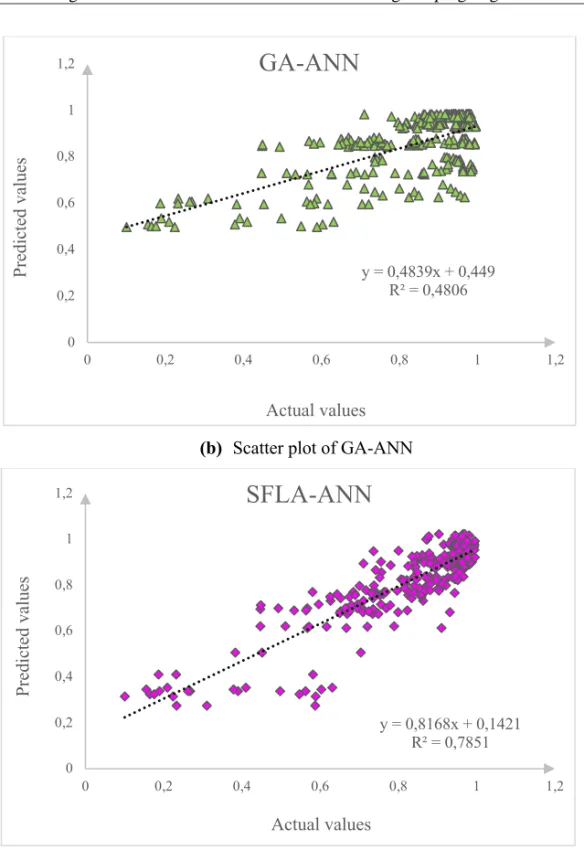
Figure 4 exhibits the scatter plots for the signal periodic component estimation from sensors in a CNC lathe by using three different algorithms. The large value of the coefficient determination for the SFLA-ANN method (Figure 3 (c)) compare to the SA-ANN (Figure 3 (a)) and GA-ANN (Figure 3 (b)) is quite noticeable. There are a minimum number of overestimated and underestimated samples by using the SFLA-ANN method compared to rest two methods. Therefore, the SFLA-ANN has maximum estimation accuracy.
(a) Scatter plot of SA-ANN P
.
n n n i i i i i =1 i =1 i =1 2 2 n n n n 2 2 i i i i i =1 i =1 i =1 i =1 n O × P - O × P r n O - O × n - P =æ
ö æ
ö æ
ö
ç
÷ ç
÷ ç
÷
è
ø è
ø è
ø
æ
æ
ö
ö æ
æ
ö
ö
ç
÷
ç
÷
ç
è
ø
÷ ç
è
ø
÷
è
ø è
ø
å
å
å
å
å
å
å
(
) (
)
(
) (
)
2.
n i i i i i =1 n n i i i i i =1 i =1 O - O × P - P R O - O × P - P =é
ù
ê
ú
ë
å
û
å
å
y = 0,602x + 0,3617 R² = 0,5432 0 0,2 0,4 0,6 0,8 1 1,2 0 0,2 0,4 0,6 0,8 1 1,2 Pr edi ct ed va lue s Actual valuesSA-ANN
(b) Scatter plot of GA-ANN
(c) Scatter plot of SFLA-ANN
Figure 3. Scatter plots for the strength prediction of the signal periodic component in a CNC lathe.
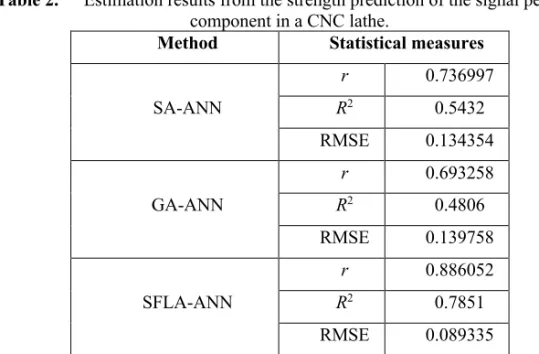
Furthermore, the performance of SFLA-ANN method is evaluated compared to SA-ANN and GA-ANN methods on the basis of the other three statistical measures of RMSE, PCC (r) and CoD (R2). The estimated accuracy of three methods in terms of the three earlier stated measures is shown in Table 2.
y = 0,4839x + 0,449 R² = 0,4806 0 0,2 0,4 0,6 0,8 1 1,2 0 0,2 0,4 0,6 0,8 1 1,2 Pr edi ct ed va lue s Actual values
GA-ANN
y = 0,8168x + 0,1421 R² = 0,7851 0 0,2 0,4 0,6 0,8 1 1,2 0 0,2 0,4 0,6 0,8 1 1,2 Pr edi ct ed va lue s Actual valuesSFLA-ANN
Table 2. Estimation results from the strength prediction of the signal periodic component in a CNC lathe.
Method Statistical measures SA-ANN r 0.736997 R2 0.5432 RMSE 0.134354 GA-ANN r 0.693258 R2 0.4806 RMSE 0.139758 SFLA-ANN r 0.886052 R2 0.7851 RMSE 0.089335
According to Table 2, SFLA- ANN with RMSE equal to 0.089335 and Coefficient of determination (R2) equal to 0.7851 has better performance compares to GA-ANN and SA-ANN for estimation CNC lathe.
5. Conclusion and Outlook
This research aimed to design and study a hybrid methodology including Shuffled Frog Leaping Algorithm (SFLA) and Artificial Neural Network (ANN) for data fusion from three sensors in order to evaluate and estimate the potency of the signal periodic component strength among the existing sensors. Three components including Speed of Spindle, Feed rate and Cutting Depth are considered as inputs of SFLA, and strength of the signal periodic component was considered as its output. A comparison of data processing the results showed that results of SFLA have a coefficient of determination (R2) of 0.7851 and RMSE of 0.089335, which are better than the results of Genetic Algorithm (GA) and Simulated Annealing (SA) algorithm applied in the previous studies on this subject. Therefore, SFLA is more suited for the estimation and prediction of CNC signals than the mentioned algorithms. Finally, the main concluding remarks are as follows:
(a) SFLA-ANN is the most efficient for the data fusion with the objective to predict the potency of the periodic component of the signal from the sensors,
(b) SFLA is a leading optimization method for ANN, particularly in the presence of numerous local minima of the objective function,
(c) SFLA-ANN model incorporates the local search capability of the ANN and global searching capability of SFLA.
As one of the main possible future research directions, other efficient metaheuristics may be integrated with ANN and tested compared to the existing methods such as Ant Colony Optimization (ACO) algorithm [39], Cuckoo Optimization Algorithm (COA) [7,30] Particle
Swarm Optimization (PSO) algorithm [35], Runner Root Algorithm (RRA) [18], Artificial Fish Swarm Algorithm (AFSA) [36] and Tabu Search (TS) algorithm [3].
References
[1] Ahmadi, M.A., Shadizadeh, S.R., Permeability prediction of carbonate reservoir by combining neural network and shuffled frog-leaping, Journal of American Science, 8, 2, 2012, 529-534.
[2] Alencar, A.S.C., Rocha Neto, A.R., Gomes, L.P.P., A new pruning method for extreme learning machines via genetic algorithms, Applied Soft Computing, 44, 2016, 101-107.
[3] Alinaghian, M., Tirkolaee, E. B., Dezaki, Z. K., Hejazi, S. R., and Ding, W. An augmented Tabu search algorithm for the green inventory-routing problem with time windows. Swarm and Evolutionary Computation, 60, 2021, 100802.
[4] Amiri, B., Fathian, M., Maroosi, A., Application of shuffled frog-leaping algorithm on clustering, The International Journal of Advanced Manufacturing Technology, 45, 1-2, 2009, 199-209.
[5] Amirkhani, S., Nasirivatan, S.H., Kasaeian, A.B., Hajinezhad, A., ANN and ANFIS models to predict the performance of solar chimney power plants, Renewable Energy, 83, 2015, 597-607.
[6] Anicic, O., Jović, S., Skrijelj, H., and Nedić, B., Prediction of laser cutting heat affected zone by extreme learning machine, Optics and Lasers in Engineering, 88, 2017, 1-4.
[7] Bouyer, A., An optimized k-harmonic means algorithm combined with modified particle swarm optimization and Cuckoo Search algorithm, Foundations of Computing and Decision Sciences, 41, 2, 2016, 99-121.
[8] Caesarendra, W., Kosasih, B., Tieu, A.K, Zhu, H., Moodie, C.A.S., Zhu, Q., Acoustic emission-based condition monitoring methods: Review and application for low speed slew bearing, Mechanical Systems and Signal Processing, 72, 2016, 134– 159.
[9] Chen, H. C., Lin, J. C., Yang, Y. K., & Tsai, C. H., Optimization of wire electrical discharge machining for pure tungsten using a neural network integrated simulated annealing approach, Expert Systems with Applications, 37, 10, 2010, 7147-7153. [10] Cheng, X., Zhang, X., Zhao, L., Deng, A., Bao, Y., Liu, Y., Jiang, Y., The
application of Shuffled Frog Leaping Algorithm to Wavelet Neural Networks for acoustic emission source location, Comptes Rendus Mecanique, 342, 2014, 229-233.
[11] Dai, Y., and Zhu, K., A machine vision system for micro-milling tool condition monitoring, Precision Engineering, 52, 2018, 183-191.
[12] Deniz, E., Aydogmus, O., Aydogmus, Z., Implementation of ANN-based Selective Harmonic Elimination PWM using Hybrid Genetic Algorithm-based optimization, Measurement, 85, 2016, 32-42.
[13] Ding, Y., Fu, X., Kernel-based fuzzy c-means clustering algorithm based on genetic algorithm, Neuro Computing, 188, 2016, 233-238.
[14] Downey, J., and Raghavendra, R., Comparison and analysis of audible sound energy emissions during single point machining of HSTS with PVD TiCN cutter insert across full tool life, Wear, 313, 1-2, 2014, 53-62.
[15] Ernst, R., Zwimpfer, F., and Dual, J., One sensor acoustic emission localization in plates, Ultrasonics, 64, 2016, 139-150.
[16] Eusuff, M., Lansey, K.E., Shuffled frog-leaping algorithm: A memetic meta-heuristic for discrete optimization, Engineering Optimization, 38, 2, 2006, 129-154. [17] Garcia-Plaza, E., Nunez, J.P., Salgado, D.R., Camber, I., Herrera Olivenz, A.J. M, Garcia Sanz Calcedo J., Surface Finish Monitoring in Taper Turning CNC Using Artificial Neural Network and Multiple Regression Methods. Procedia Engineering, 63, 2013, 599-607.
[18] Goli, A., Zare, H.K., Tavakkoli-Moghaddam, R., and Sadeghieh, A. Hybrid artificial intelligence and robust optimization for a multi-objective product portfolio problem Case study: The dairy products industry. Computers and Industrial Engineering, 137, 2019, 106090.
[19] Guo, Y.B., Ammula, S.C., Real-time acoustic emission monitoring for surface damage in hard machining, International Journal of Machine Tools and Manufacture, 45, 2005, 1622-1627.
[20] Heck, B.V., Yoon, J., He, D., Low speed bearing fault diagnosis using acoustic emission sensors, Applied Acoustics, 105, 2016, 35-44.
[21] Hekmati, A., Proposed method of partial discharge allocation with acoustic emission sensors within power transformers, Applied Acoustics, 100, 2015, 26-33.
[22] Jabha, D.F., Selvi, K., Joselin, R., A new approach for the failure prediction in XLPE power cables using acoustic emission technique, International Journal of Electrical Power and Energy Systems, 81, 2016, 336-345.
[23] Khehra, B.S., Pharwaha, A.P.S., Classification of Clustered Microcalcifications using MLFFBP-ANN and SVM, Egyptian Informatics Journal, 17, 1, 2016, 11-20. [24] Lauro, H.C., Brandao, L.C., Baldo D, Reis R.A, Davim J.P., Monitoring and
processing signal applied in machining processes – A review, Measurement, 58, 2014, 73–86.
[25] Liao, Z., and Axinte, D. A., On monitoring chip formation, penetration depth and cutting malfunctions in bone micro-drilling via acoustic emission, Journal of Materials Processing Technology, 229, 2016, 82-93.
[26] Masmoudi S, Mahi A.E, Turki S., Use of piezoelectric as acoustic emission sensor for in situ monitoring of composite structures, Composites Part B, 80, 2015, 307-320.
[27] Oktem, H., Erzurumlu, T., & Erzincanli, F., Prediction of minimum surface roughness in end milling mold parts using neural network and genetic algorithm, Materials and design, 27, 9, 2006, 735-744.
[28] Pawlak, J., Hercman, H., Numerical correlation of speleothem stable isotope records using a genetic algorithm, Quaternary Geochronology, 33, 2016, 1-12.
[29] Petkovic, D., Shamshirband, S.H., Kamsin, A., Lee M., Anicic, O., Nicolic, V., Survey of the most influential parameters on the wind farm net present value (NPV) by adaptive neuro-fuzzy approach, Renewable and Sustainable Energy Reviews, 57, 2016, 1270-1278.
[30] Sangaiah, A.K., Tirkolaee, E.B., Goli, A., and Dehnavi-Arani, S. Robust optimization and mixed-integer linear programming model for LNG supply chain planning problem, Soft Computing, 2019, 1-21.
[31] Slimani, I., El Farissi, I., and Achchab, S., The Comparison of Neural Networks' Structures for Forecasting, International Journal of Supply and Operations Management, 4, 2, 2017, 105-114.
[32] Sousa, T., Morais, H., Castro, R., Val, Z., Simulated annealing to handle energy and ancillary services joint management considering electric vehicles, Electric Power Systems Research, 136, 2016, 383-397.
[33] Teti, R, Jemielniak, K., Donnell, J.O., Dornfeld, D., Advanced monitoring of machining operations, CIRP Annals-Manufacturing Technology, 59, 2010, 717– 739.
[34] Tirkolaee, E. B., Goli, A., and Weber, G. W. Fuzzy mathematical programming and self-adaptive artificial fish swarm algorithm for just-in-time energy-aware flow shop scheduling problem with outsourcing option. IEEE Transactions on Fuzzy Systems, 28, 11, 2020, 2772-2783.
[35] Tirkolaee, E.B., Mahdavi, I., and Esfahani, M.M.S., A robust periodic capacitated arc routing problem for urban waste collection considering drivers and crew’s working time, Waste Management, 76, 2018, 138-146.
[36] Tirkolaee, E.B., Mahmoodkhani, J., Bourani, M.R., and Tavakkoli-Moghaddam, R., A Self-Learning Particle Swarm Optimization for Robust Multi-Echelon Capacitated Location-Allocation-Inventory Problem, Journal of Advanced Manufacturing Systems, 18, 4, 2019, 677-694.
[37] Venkatesana, T., Sanavullah, M.Y., SFLA approach to solve PBUC problem with emission limitation, International Journal of Electrical Power and Energy Systems, 46, 2013, 1-9.
[38] Wang, L., Orban, P., Cunningham, A., and Lang, S., Remote real-time CNC machining for web-based manufacturing, Robotics and Computer-Integrated Manufacturing, 20, 6, 2004, 563-571.
[39] Wieczorek, W., Inductive Synthesis of Cover-Grammars with the Help of Ant Colony Optimization, Foundations of Computing and Decision Sciences, 41, 4, 2016, 297-315.
[40] Wu, L., and Zhang, J., The variance-covariance method using IOWGA operator for tourism forecast combination, International Journal of Supply and Operations Management, 1, 2014, 152.
[41] Xiangqian, F, Shaowei H, Jun L, Congji W., Acoustic emission properties of concrete on dynamic tensile test, Construction and Building Materials, 114, 2016, 66-75.
[42] Xu, J., Yamada, K., Seikiya, K., Tanaka, R., and Yamane, Y., Effect of different features to drill-wear prediction with back propagation neural network, Precision Engineering, 38, 4, 2014 791-798.
[43] Xu, S.X., Zhao, J., Zhan, J.M., Le, G., Research on a fault monitoring system in free-form surface CNC machining based on wavelet analysis, Journal of Materials Processing Technology, 129, 2002, 588–591.
[44] Yammani, C.H., Maheswarapu, S., Kumari Matam, S., A Multi-objective Shuffled Bat algorithm for optimal placement and sizing of multi distributed generations with different load models, International Journal of Electrical Power and Energy Systems, 79, 2016, 120-131.
![Figure 1. Flowchart of SFLA [4].](https://thumb-eu.123doks.com/thumbv2/9libnet/4465081.77592/7.892.113.788.501.1147/figure-flowchart-of-sfla.webp)