Soft x-ray photoemission studies of Hf oxidation
S. Suzer, S. Sayan, M. M. Banaszak Holl, E. Garfunkel, Z. Hussain, and N. M. Hamdan
Citation: Journal of Vacuum Science & Technology A: Vacuum, Surfaces, and Films 21, 106 (2003); doi: 10.1116/1.1525816
View online: http://dx.doi.org/10.1116/1.1525816
View Table of Contents: http://avs.scitation.org/toc/jva/21/1
Published by the American Vacuum Society
Articles you may be interested in
Hafnium oxide thin film grown by ALD: An XPS study
Surface Science Spectra 14, 34 (2009); 10.1116/11.20080401
interface chemistry studied by synchrotron radiation x-ray photoelectron spectroscopy
Applied Physics Letters 81, 3627 (2002); 10.1063/1.1520334
Thermal stability and electrical characteristics of ultrathin hafnium oxide gate dielectric reoxidized with rapid thermal annealing
Applied Physics Letters 76, 1926 (2000); 10.1063/1.126214
Atomic and electronic structure of amorphous and crystalline hafnium oxide: X-ray photoelectron spectroscopy and density functional calculations
Journal of Applied Physics 101, 053704 (2007); 10.1063/1.2464184
Electrical and spectroscopic comparison of interfaces on nitrided and un-nitrided Si(100)
Journal of Applied Physics 91, 4353 (2002); 10.1063/1.1455155
Thermal stability and structural characteristics of films on Si (100) grown by atomic-layer deposition
S. Suzera)
Department of Chemistry, Bilkent University, 06533 Ankara, Turkey
S. Sayan
Department of Chemistry, Rutgers University, Piscataway, New Jersey 08854
M. M. Banaszak Holl
Department of Chemistry, The University of Michigan, Ann Arbor, Michigan 48109-1055
E. Garfunkel
Department of Chemistry, Rutgers University, Piscataway, New Jersey 08854
Z. Hussain and N. M. Hamdan
Advanced Light Source, Lawrence Berkeley Laboratory, Berkeley, California 94720
共Received 8 May 2002; accepted 7 October 2002; published 2 December 2002兲
Soft x-ray photoemission spectroscopy has been applied to determine the binding energy shifts and the valance band offset of HfO2 grown on Hf metal. Charging of oxide films upon x-ray exposure is found to be very severe and special care is taken to eliminate it. Photoemission results show the presence of metallic Hf共from the substrate兲 with a 4 f7/2binding energy of 14.22 eV, fully oxidized Hf共from HfO2) with a 4 f7/2binding energy of 18.16 eV, and at least one clearly defined suboxide peak. The position of the valence band of HfO2 with respect to the Hf共metal兲 Fermi level is 4.23 eV. © 2003 American Vacuum Society. 关DOI: 10.1116/1.1525816兴
I. INTRODUCTION
Although photoelectron spectroscopy is widely used for elucidating the electronic structure of numerous materials, interfaces, and surfaces, systematic studies of hafnium and its oxides are scarce.1–3Sarma et al. employed x-ray photo-electron spectroscopy共XPS兲 to investigate oxides of second-and third-row transition metals, including those of rare earths.1They described the spin-orbit splittings and the bind-ing energies of core levels of the metals. Specific features of individual oxides concerning satellites, multiplet structure, configuration mixing, and other properties were also dis-cussed and binding energies of 29.8 and 16.4 eV were as-signed to the 5 p3/2 and 4 f7/2 levels of HfO2, respectively, Nyholm et al. reported the binding energies of all core levels in the N and O shells for the elements from hafnium to bismuth 共that are accessible with Al K␣ radiation兲 using x-ray photoelectron spectroscopy.2They reported binding en-ergies of 29.9 and 14.2 eV for the metallic 5 p3/2 and 4 f7/2 levels of Hf as referenced to the Au 4 f7/2 level共84.00 eV兲. The Handbook of X-ray Photoelectron Spectroscopy gives the binding energies of the Hf 4 f7/2as 14.4 and 16.7 eV for Hf共metal兲 and HfO2, respectively.3 Morant et al. were the first to report on a systematic XPS investigation of the initial stages of oxidation of hafnium.4 They studied the oxidation kinetics of polycrystalline hafnium at room temperature un-der low oxygen pressures (⬃10⫺7Torr) and reported that suboxides are formed in the early stages, and that HfO2 for-mation proceeded through oxidation of suboxides. The film thickness saturates to a value of 12 Å 共under their condi-tions兲 with an average Hf:O stoichiometry of 1:1.8. They
also reported 14.31 and 18.13 eV binding energies for the Hf 4 f7/2levels of the metallic Hf and HfO2, respectively. As can be deduced from these studies, although the reported binding energies for Hf共metal兲 are in agreement with each other, those for the HfO2have a large scatter共as much as 1.7 eV兲.
Interest in hafnium dioxide has grown enormously since 1998 because of its promise for use as a high-k dielectric in future highly scaled memory and logic metal–oxide– semiconductor field effect transistor devices.5–9As a result, extensive use of XPS and other surface techniques have re-cently been reported on hafnium oxide and related systems.6 – 8,10–12Although HfO2 has a moderately high di-electric constant and band gap 共both useful for ultrathin di-electric applications in micro- or nano-electronics兲, charging during photon or electron irradiation can make it difficult to determine the binding energies and/or the chemical states accurately. This, in turn, may lead to incorrect assignments and conclusions. For example, the binding energy of the Hf 4 f7/2levels of a thick film HfO2 can be estimated as 17.3 and 17.4 eV from the recently published data of Wilk et al. and Cosnier et al., respectively,6 – 8again differing by about 1 eV from the previously reported values. Additional confusion may arise from incorrect assignment of the surface and the bulk states. Finally, we note that understanding the position of the valence band edges of oxides next to metals will be-come critical for future devices in which doped polysilicon is replaced by metal electrodes.
In this article, we present results from an investigation of the stepwise oxidation of polycrystalline hafnium foil using high-resolution 共and surface sensitive兲 soft x-ray photoemis-sion to accurately determine the binding energies, electronic states, and valence band offsets for the Hf/HfO2 system.
a兲Author to whom correspondence should be addressed; electronic mail:
II. EXPERIMENT
Polycrystalline hafnium foil 共0.025 mm thick兲 with a 3% Zr nominal content共Alfa Aesar兲 was used in this work. After cleaning with acetone and alcohol the foil was placed into the sample holder and loaded into the ultrahigh vacuum 共UHV兲 chamber 共base pressure 1⫻10⫺10Torr) for in situ cleaning and controlled oxidation. Cleaning was accom-plished in UHV by resistive heating of the foil. Controlled and stepwise oxidation was also accomplished in the UHV chamber by heating the foil to ca. 200 °C and exposing it to 1⫻10⫺5Torr oxygen for various durations. Soft x-ray pho-toemission spectroscopy has been performed with mono-chromatic radiation at 共i兲 the U8B beamline of the National Synchrotron Light Source 共NSLS兲 at Brookhaven National Laboratory in the 120– 400 eV range, and共ii兲 the 9.3 beam-line of the Advanced Light Source 共ALS兲 at Lawrence Ber-keley Laboratory in the 70– 400 eV range. We report our results to 10 meV accuracy for relative binding energies while the uncertainty in the absolute energy scale is slightly larger.
III. RESULTS AND DISCUSSION
The spectral features of the Hf foil immediately after in-troduction into UHV are presented in Fig. 1. The spectra clearly indicate the presence of a ‘‘native’’ oxide 关Fig. 共1a兲兴 and only after in situ heating do features belonging to the metal emerge 关Fig. 1共b兲兴. The deconvolution of the Hf4 f spin-orbit couple is done after a Shirley background subtrac-tion with the theoretical area ratio 共3:4兲 held constant. The binding energy of the Hf 4 f7/2 feature is reported as refer-enced to the Fermi energy of the cleaned hafnium foil. The Fermi energy is modeled by a Boltzmann broadened step function and the inflection point is found by fitting this func-tion to the experimental data using a standard least-squares fitting method. As shown in Fig. 1(b
⬘
), the Hf4 f region canbe fit to four spin-orbit doublets, each with 1.66 eV separa-tion, with the corresponding 4 f7/2binding energies at 14.22, 14.58, 15.41, and 18.16 eV共see Table I兲. The first two dou-blets have relatively narrow linewidths (⬃0.4 eV) and can be assigned to the Hf0 共bulk metal兲 and to the Hf0 共surface metal兲. The energy separation between the 4 f7/2levels of the bulk and surface metal共surface core level shift兲 was 0.36 eV, in good agreement with single crystal13and polycrystalline14 studies, the latter reporting a shift of 0.42 eV. The difference in core-level binding energies for the bulk and surface metal atoms results from a narrowing of the d bands at the surface; the narrowing requires a charge transfer to align the Fermi level. For transition metals with d bands less than half full such as Hf, the surface core levels are shifted to larger bind-ing energies since the surface acquires positive charge.15The last two doublets exhibit larger widths (⬎0.9 eV) and can accordingly be assigned to a suboxide Hfx⫹, and the fully oxidized hafnium Hf4⫹. The 1.19 and 3.94 eV chemical shifts for the suboxide and the full oxide are in qualitative agreement with the previously reported XPS values of 0.90 and 3.64 eV respectively.4Similarly, the chemical shift in the binding energy of the Hf 5 p3/2level is determined as 3.9 eV exactly the same共within our experimental uncertainty兲 as the 4 f7/2 shift.
FIG. 1. Valence band, 4 f and 5 p photoemission spec-trum of polycrystalline Hf foil recorded at 100 eV pho-ton energy before关共a兲 and (a⬘)] and after关共b兲 and (b⬘)] in situ heating. The figure also contains the deconvo-luted 4 f region.
TABLE I. Binding energies共in eV兲 together with their full width at half maximum共in eV兲 and assignments of the peaks of clean and oxidized poly-crystalline Hf foil.
VB onset
共eV兲 4 f共eV兲7/2 5 p共eV兲3/2
Hf0共metal, bulk兲 0.00 14.22共0.37兲 29.9 Hf0共metal, surface兲 14.58共0.40兲 Hfx⫹O y共suboxide兲 15.41共0.97兲 Hf4⫹O 2 4.23 18.16共0.92兲 33.8
107 Suzeret al.: Soft x-ray photoemission studies of Hf oxidation 107
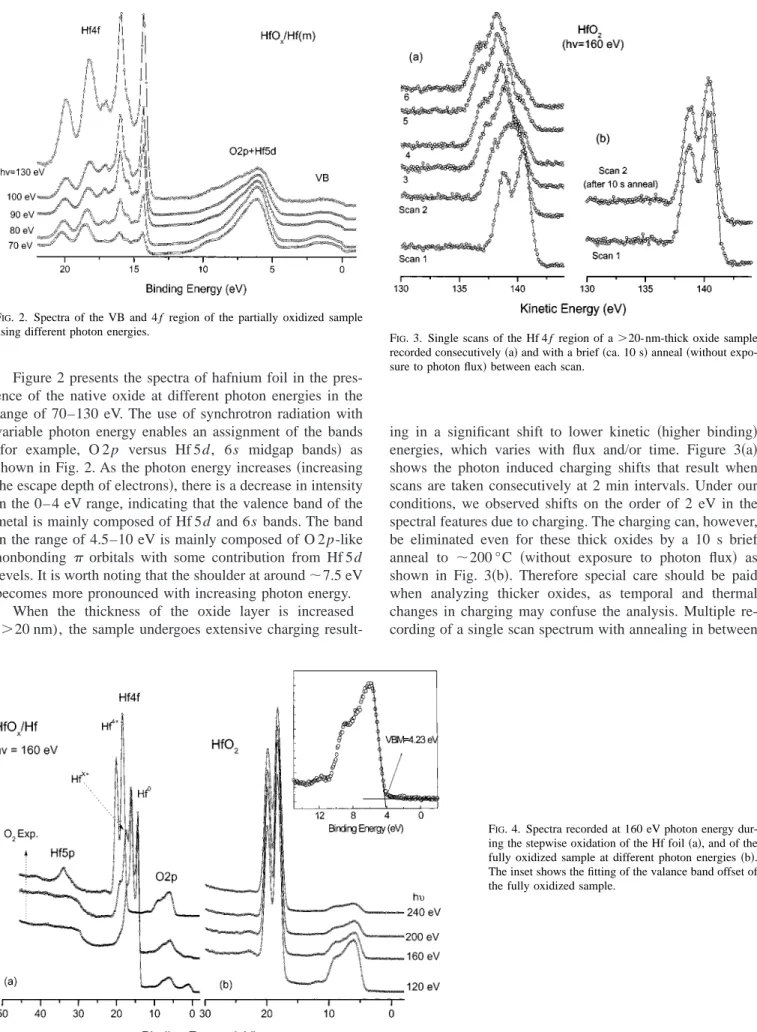
Figure 2 presents the spectra of hafnium foil in the pres-ence of the native oxide at different photon energies in the range of 70–130 eV. The use of synchrotron radiation with variable photon energy enables an assignment of the bands 共for example, O 2p versus Hf 5d, 6s midgap bands兲 as shown in Fig. 2. As the photon energy increases共increasing the escape depth of electrons兲, there is a decrease in intensity in the 0– 4 eV range, indicating that the valence band of the metal is mainly composed of Hf 5d and 6s bands. The band in the range of 4.5–10 eV is mainly composed of O 2 p-like nonbonding orbitals with some contribution from Hf 5d levels. It is worth noting that the shoulder at around⬃7.5 eV becomes more pronounced with increasing photon energy.
When the thickness of the oxide layer is increased (⬎20 nm), the sample undergoes extensive charging
result-ing in a significant shift to lower kinetic 共higher binding兲 energies, which varies with flux and/or time. Figure 3共a兲 shows the photon induced charging shifts that result when scans are taken consecutively at 2 min intervals. Under our conditions, we observed shifts on the order of 2 eV in the spectral features due to charging. The charging can, however, be eliminated even for these thick oxides by a 10 s brief anneal to ⬃200 °C 共without exposure to photon flux兲 as shown in Fig. 3共b兲. Therefore special care should be paid when analyzing thicker oxides, as temporal and thermal changes in charging may confuse the analysis. Multiple re-cording of a single scan spectrum with annealing in between
FIG. 4. Spectra recorded at 160 eV photon energy dur-ing the stepwise oxidation of the Hf foil共a兲, and of the fully oxidized sample at different photon energies共b兲. The inset shows the fitting of the valance band offset of the fully oxidized sample.
FIG. 2. Spectra of the VB and 4 f region of the partially oxidized sample
using different photon energies. F
IG. 3. Single scans of the Hf 4 f region of a⬎20-nm-thick oxide sample recorded consecutively共a兲 and with a brief 共ca. 10 s兲 anneal 共without expo-sure to photon flux兲 between each scan.
the scans共without photon exposure兲 is one way to minimize charging.
The spectra corresponding to different O2 exposures are given in the left panel of Fig. 4. As the oxygen exposure increases, the intensity in the valence band region decreases 共0–4 eV兲 and the band corresponding to O 2p-like levels 共4–10 eV兲 increases in intensity. The right panel presents the spectra of the fully oxidized sample in the energy range of 120–240 eV. This data set depicts the excitation energy de-pendence of the valence band cross section. The cross sec-tion of the valence band decreases as excitasec-tion energy in-creases as noted above. By sequentially oxidizing the sample, spectra can be obtained free from any charging ef-fects. Hence stepwise and controlled oxidation is found to be a solution to accurately determine the chemical shift共s兲, valence-band offset共s兲, etc. of the oxide/metal system, as de-picted in Fig. 4.
The position of the valence band maximum with respect to the Fermi level is determined using several different meth-ods. We present a method that employs a best straight line fit to represent the decay in valence band photoemission and the point of intersection of this line with the baseline is taken to be the valence band edge. In the inset of Fig. 4, the result of the fitting is given, showing valence band offsets of 4.23 eV. This is the first report on the position of the valence band with respect to the Fermi level to the best of the authors’ knowledge.
IV. CONCLUSION
Charging of oxide films under x rays共or other irradiation兲 is an important issue that must be taken into consideration for determination of core-level binding energies as well as valence band offsets. Measurements were taken as a function of time, thickness, and annealing condition. Photoemission
results show the presence of metallic Hf共from the substrate兲 with the 4 f7/2binding energy of 14.22 eV, fully oxidized Hf 共from HfO2) with the 4 f7/2binding energy of 18.16 eV, and at least one clear suboxide peak. The Hf 5 p3/2chemical shift is exactly the same as that of 4 f7/2. The position of the valence band of HfO2with respect to the Hf(m) Fermi level is determined as 4.23 eV.
ACKNOWLEDGMENTS
This work was partially supported by the NSF through Grant No. INT-0096583. S. S. would also like to acknowl-edge the travel fund provided by the U.S. Department of Energy Cooperative Research Grant which supports the SESAME project.
1D. D. Sarma and C. N. R. Rao, J. Electron Spectrosc. Relat. Phenom. 20,
25共1980兲.
2
R. Nyholm, A. Berndtsson, and N. Martensson, J. Phys. C 13, L1091
共1980兲.
3C. D. Wagner et al., Handbook of X-ray Photoelectron Spectroscopy
共Perkin-Elmer Corporation, Physical Electronics Division, Eden Prairie,
MN, 1979兲.
4
C. Morant, L. Galan, and J. M. Sanz, Surf. Interface Anal. 16, 304共1990兲.
5C. T. Hsu, Y. K. Su, and M. Yokoyama, Jpn. J. Appl. Phys., Part 1 31,
2501共1992兲.
6G. D. Wilk and R. M. Wallace, Appl. Phys. Lett. 74, 2854共1999兲. 7
G. D. Wilk, R. M. Wallace, and J. M. Anthony, J. Appl. Phys. 87, 484
共2000兲.
8V. Cosnier, M. Olivier, G. Theret, and B. Andre, J. Vac. Sci. Technol. A
19, 2267共2001兲.
9
A. I. Kingon, J. P. Maria, and S. K. Streiffer, Nature共London兲 406, 1032
共2000兲.
10S. Sayan, E. Garfunkel, and S. Suzer, J. Appl. Phys. 80, 2135共2002兲. 11M. Belyansky and M. Trenary, J. Vac. Sci. Technol. A 15, 3065共1997兲. 12H. Lee, S. Jeon, and H. Hwang, Appl. Phys. Lett. 79, 2615共2001兲. 13
N. Martensson et al., Phys. Rev. B 39, 8181共1989兲.
14R. Nyholm and J. Schmidt-May, J. Phys. C 17, L113共1984兲. 15W. F. Egelhoff, Jr., Surf. Sci. Rep. 6, 253共1987兲.
109 Suzeret al.: Soft x-ray photoemission studies of Hf oxidation 109