International Journal on Magnetic Particle Imaging Vol 6, No 2, Suppl 1, Article ID 2009039, 3 Pages
Proceedings Article
Magnetic Particle Fingerprinting using
Arbitrary Waveform Relaxometer
E. Yagiz
1,2,∗·
M. Utkur
1,2·
C. B. Top
3·
E. U. Saritas
1,2,41Department of Electrical and Electronics Engineering, Bilkent University, Ankara,TurkeyA 2National Magnetic Resonance Research Center (UMRAM), Bilkent University, Ankara, Turke 3ASELSAN Research Center, Ankara, Turkey
4Neuroscience Program, Sabuncu Brain Research Center, Bilkent University, Ankara, Turkey ∗Corresponding author, email: [email protected]
©2020 Yagiz et al.; licensee Infinite Science Publishing GmbH
This is an Open Access article distributed under the terms of the Creative Commons Attribution License (http://creativecommons.org/licenses/by/4.0), which permits unrestricted use, distribution, and reproduction in any medium, provided the original work is properly cited.
Abstract
In magnetic particle imaging (MPI), the information about the local environment, such as its viscosity and tempera-ture, can be inferred via the relaxation behavior of the nanoparticles. As the nanoparticle signal also changes with drive field (DF) parameters, one potential problem for quantitative mapping applications is the optimization of these parameters. In this work, an accelerated framework is proposed for characterizing the unique response of a nanoparticle under different environmental settings. The proposed technique, called magnetic particle finger-printing (MPF), rapidly sweeps a wide range of DF parameters, mapping the uniqueτ-fingerprint of a sample. This technique can enable simultaneous mapping of several parameters (e.g., viscosity, temperature, nanoparticle type, etc.) with reduced scan time.
I Introduction
Magnetic particle imaging (MPI) offers promising capa-bility for quantifying viscosity and temperature, and dis-tinguishing different nanoparticle types[1,2]. Recently, we have proposed to estimate the relaxation time con-stant,τ via a technique called TAURUS (TAU estimation via Recovery of Underlying mirror Symmetry)[3-4]. This technique estimatesτ without any calibration or prior information about the nanoparticles, and can be used to distinguish viscosity in the biologically relevant range, or distinguish different types of nanoparticles[3-4].
As the nanoparticle signal changes with drive field (DF) parameters[5], one potential problem for quanti-tative mapping applications of MPI is the optimization of these parameters. Unlike standard MPI and magnetic particle spectrometer (MPS) systems that operate at a fixed frequency[6], an arbitrary waveform relaxometer (AWR) that can operate at any frequency was recently
proposed to enable rapid optimization of DF parameters [7].
In this work, we propose characterization of nanopar-ticle response by a rapid coverage of the “excitation space”, i.e., by rapidly sweeping a wide range of DF pa-rameters. We refer to this technique as “magnetic particle fingerprinting” (MPF), as we map theτ-fingerprint of the nanoparticle in an accelerated framework using an AWR, across a wide range of field strengths/frequencies.
II Material and methods
II.I Theory
The relaxation of nanoparticles is governed by Brownian and Néel relaxation mechanisms, where the former has viscosity and temperature dependence, and the latter has temperature dependence[8]. The overall delay in
International Journal on Magnetic Particle Imaging 2
Figure 1:(a) Schematic of the in-house AWR setup. (b) A spiral
trajectory in excitation space (Bpeak- f0space). (c) The drive field waveform corresponding to the trajectory in (b). The excitation space is traversed starting from the center of the spiral.
Table 1:Prepared samples at 5 different viscosity levels. Viscosity (mPa·s) 0.89 1.15 1.54 2.16 3.18 5.04
Glycerol (µL) 0 2 4 6 8 10
DI Water (µL) 10 8 6 4 2 0
Glycerol Volume % 0 10 20 30 40 50
the MPI signal is a combination of these two effects. In x-space MPI, the relaxation effects are modeled as the convolution of the adiabatic signal with the following kernel[9]:
r(t ) =1
τ· exp(−t /τ)u(t ) (1)
Here, u(t ) is the Heaviside step function. TAURUS tech-nique estimatesτ directly from the acquired signal by using the underlying mirror symmetry of the adiabatic signal during back and forth scanning[3, 4],
τ(f ) = S ∗ p o s(f ) +Sn e g(f ) j 2πf (S∗ p o s(f ) −Sn e g(f )) (2)
where Sp o s(f ) and Sn e g(f ) are Fourier transforms of the
signals from positive and negative scanning directions, respectively.
II.II In-house AWR Setup
The experiments were performed on an in-house AWR setup, shown in Fig. 1a[10]. This setup consists of a drive coil with 18 turns, with a relatively small 3.1µH induc-tance that obviates impedance matching. The receive coil has a three-section gradiometer geometry, with 17, 20, and 5 turns. The shortest section can be adjusted manually via a knob to achieve 80 dB decoupling be-tween drive/receive coils. The bore can fit a 0.2 ml PCR tube. The DF waveform was sent to a power amplifier (AE Techron 7224) through a data acquisition (NI USB-6383) card. The waveform was verified using a current probe (LFR 06/6/300, PEM) before each measurement. The received signal was amplified with a low-noise voltage pre-amplifier (SRS SR560). The entire setup was con-trolled via MATLAB.
Figure 2:(a) Estimatedτ values for 0.89 mPa·s sample, using
linear (line-by-line) and spiral trajectories show excellent agree-ment. (b)τ values normalized by the period (i.e., by T0= 1/f0) at each point on the trajectory.
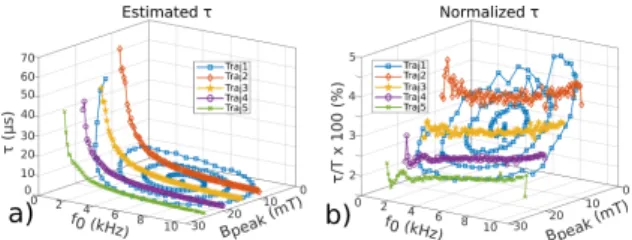
Figure 3:(a) Estimatedτ values and (b) normalized τ values
for 0.89 and 5.04 mPa·s samples using a spiral trajectory.
II.III Rapid Excitation Space Coverage
The low inductance of the AWR setup obviates impedance matching, enabling rapid coverage of the “excitation space” (i.e., Bpeak- f0parameters of the DF)
using a variety of trajectories. Figure 1 shows an example spiral trajectory, together with the corresponding DF waveform. For the first set of experiments, the excitation space was traversed via two different trajectories: linear (line-by-line) and spiral trajectories. Then, TAURUS technique was used to mapτ at each (Bpeak, f0) point on
the trajectory. Next,τ was mapped for samples with different viscosities using a spiral trajectory with 0.6 s duration.
II.IV Sample Preparation
Samples at six different viscosities ranging between 0.89-5.04 mPa·s were prepared [11], as listed in Table 1. Each sample contained 10µL of Nanomag-MIP nanoparti-cles (Micromod GmbH, Germany) with 89 mmol Fe/L. Deionized (DI) water and glycerol were added at varying volumes to reach a total volume of 20µL for each sample. All measurements were performed at room temperature.
III Results and discussion
Figure 2a shows the estimatedτ values for 0.89 mPa·s sample for linear (line-by-line) and spiral trajectories. Both trajectories show excellent agreement in the esti-matedτ values, demonstrating the consistency of the
International Journal on Magnetic Particle Imaging 3
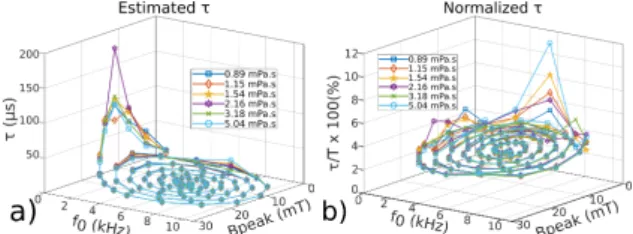
Figure 4:(a) Estimatedτ values and (b) normalized τ values
for all six samples with different viscosities, using a spiral tra-jectory. Each sample has a uniqueτ-fingerprint, especially at low-Bpeakand low- f0regions of the excitation space.
proposed MPF method. Figure 2b showsτ values nor-malized by the period (i.e., by T0= 1/f0) at each point on
the trajectory, to better demonstrate the trends. For this sample,τ remains less than 5 % of the period on the cov-ered excitation space, reduces with Bpeak, and increases
with f0.
Figure 3 showsτ values for 0.89 and 5.04 mPa·s sam-ples. The trends for these two samples are different, especially at low-Bpeak or low- f0 regions of the
excita-tion space. Figure 4 showsτ values for all six samples with different viscosities. Each sample has a unique τ-fingerprint, especially at low-Bpeakand low- f0regions of
the excitation space.
These results indicate that different viscosities can be distinguished using the proposed MPF technique. We expect to see uniqueτ trends at different temperatures, as well, enabling simultaneous mapping of viscosity and temperature with the proposed technique.
IV Conclusions
In this work, an accelerated framework is proposed to rapidly cover the excitation space and characterize the uniqueτ-fingerprint of a nanoparticle under different environmental settings. This technique has a variety of potential applications, including rapid and simultane-ous quantification of several parameters (e.g., viscosity, temperature, nanoparticle type, etc.). In addition, it can
be used to determine the optimum DF parameters for a given mapping application.
Author’s Statement
Research funding: This work was supported by the Sci-entific and Technological Research Council of Turkey (TUBITAK 115E677, 217S069). Conflict of interest: Au-thors state no conflict of interest.
References
[1] A. Rauwerdink et al.,"Viscous effects on nanoparticle magnetization harmonics," J Magn Magn Mater, vol. 322, no.6, pp.60913, 2010. [2] M. Möddel et al., "Viscosity quantification using multi-contrast magnetic particle imaging," New Journal of Physics, vol. 20, no. 8, p. 083001, 2018.
[3] Y. Muslu et al., "Calibration-Free Relaxation-Based Multi-Color Mag-netic Particle Imaging," IEEE Trans Med Imaging, vol.37,no.8, pp.1920-31,2018.
[4] M. Utkur et al. "Relaxation-based color magnetic particle imag-ing for viscosity mappimag-ing,"Applied Physics Letters, vol.115,no.15, p. 152403, 2019.
[5] J. Weizenecker et al "Micro-magnetic simulation study on the mag-netic particle imaging performance of anisotropic mono-domain par-ticles,"Phys Med Biol, vol. 57, no. 22, pp. 731727, 2012.
[6] S. Biederer et al, “Magnetization response spectroscopy of super-paramagnetic nanoparticles for magnetic particle imaging,”Journal of Physics D: Applied Physics“, vol. 42, no. 20, p. 205007, 2009. [7] Z. W. Tay et al., "A High-Throughput, Arbitrary-Waveform, MPI Spec-trometer and Relaxometer for Comprehensive Magnetic Particle Opti-mization and Characterization," Scientific Reports, vol. 6, no. 34180, 2016.
[8] R. M. Ferguson et al., "SizeDependent Relaxation Properties of Monodisperse Magnetite Nanoparticles Measured Over Seven Decades of Frequency byAC Susceptometry, IEEE Trans Magn,vol.49,no.7, pp.3441-3444,2013.
[9] L. R. Croft et al., "Relaxation in x-space Magnetic Particle Imaging," IEEE Trans Med Imaging, vol.31, no.12, pp. 23342, 2012.
[10] C. B. Top, "An Arbitrary waveform magnetic particle relaxometer with an asymmetrical three-section gradiometric receive coil," Turk J Elec Eng & Comp Sci., In press.
[11] M. Sheely, "Glycerol Viscosity Tables," Industrial & Engineering Chemistry, vol. 24, no. 9, pp. 1060-1064, 1932.