An Analysis into the Effect of Voltage Harmonics on
the Maximum Loading Capability of Transformers
Emrah Arslan
1BEST Transformers Co.
1Balikesir, TURKEY [email protected]
Murat E. Balci
2Balikesir University
2 Balikesir, TURKEY [email protected]Mehmet H. Hocaoglu
3Gebze Institute of Technology
3Gebze, TURKEY [email protected]
Abstract—In this paper, some exemplary cases are presented to
show the effect of voltage total harmonic distortion (THDV) and its spectrum on the harmonic loss factors (FHL and FHL-STR) of
the six-pulse rectifiers accompanied with a constant power dc load and a battery. Accordingly, the winding losses and maximum loading capability of a transformer supplying both linear load types are investigated for sinusoidal and non-sinusoidal bus voltage conditions. The obtained numerical results clearly shows that the current harmonics of the considered non-linear load types are highly dependent on the
THDV level and spectrum of the supply voltage, thus, the voltage
harmonic profile should be considered in the design stage of the transformers, which are under influence of particular to supply them.
Index Terms—Transformers, winding losses, harmonics,
maximum loading capability.
I. INTRODUCTION
Power systems are planned to operate under sinusoidal load currents with supply voltage-frequency. However, nonlinear loads cause non-sinusoidal or harmonically distorted currents and voltages in the systems [1]. Harmonics have a number of adverse effects on power system components and loads. One of the most important adverse effects is overheating of the transformers [2]. The overheating problem is mainly caused by the current harmonics since the additional winding loss related with current harmonics is considerably larger than the additional core loss related with voltage harmonics [3], [4]. Thus, an efficient technique, called as derating, is employed to prevent overheating of the transformers under non-sinusoidal current conditions in several studies [5]-[8]. Derating can be interpreted as the intentional reduction in loading capability of a transformer supplying a non-linear load [6], [8]. In these studies, two indices named as (i) the harmonic loss factor (FHL) defined in
IEEE standard C57.110 [9] and (ii) K factor [6] defined in UL standard 1561 [10] are generally employed for the determination of the derating factor (maximum permissible loading capability ratio) of a transformer supplying a non-linear load. On the other hand, it is well known from the
literature that supply voltage harmonics may affect the current harmonic distortion of the non-linear loads [11]-[13]. This case means that voltage harmonic profile may indirectly affect the winding loss or maximum permissible loading capability of a transformer under non-sinusoidal conditions.
In this paper, FHL and FHL-STR values of two kinds of the
six-pulse rectifiers accompanied with a constant power dc load and a battery are investigated under sinusoidal and non-sinusoidal voltage cases. Therefore, it is aimed to analyze the indirect effect of voltage harmonics on the winding loss and the maximum permissible loading capability of the transformers, which are dedicated to supply both kinds of non-linear loads.
II. IEEESTANDARD C57.110DERATING METHOD
Winding or load loss (PLL) of the transformers can be
divided into three kinds of losses such as dc or Ohmic loss (PDC), eddy-current loss (PEC) in windings and other stray loss
(POSL):
LL DC EC OSL
P =P +P +P (1)
POSL is sum of the losses in structural parts of transformer such
as tank, clamps, and PDC can be expressed in terms of winding
dc resistance (RDC) and square of the total rms value of the
load individual harmonic currents (Ih);
2 2
DC DC DC h
h
P =R I =R
∑
I (2) Note that according to IEEE standard C57.110, PEC is 67%and 33% of the total stray losses (PTSL =PLL−PDC) for
dry-type and liquid-filled transformers, respectively. For linear rated load case, eq. (1) can be written as;
( )
1( )
( )
LL R EC R OSL R
P − pu = +P − pu +P − pu (3)
where PLL-Ris rated load loss, PEC-R is rated winding
eddy-current loss, and POSL-Ris rated other stray loss at rated current.
In IEEE standard C57.110, for the maximum permissible loading capability of the transformers under balanced non-sinusoidal current conditions, FHL and FHL-STR indices were
defined:
This work is supported by Republic of Turkey Ministry of Science, Industry and Technology and BEST Transformers Co. under the project number of 01008.STZ.2011-2.
2 2 2 1 1 h h HL h h I I F h I I ⎛ ⎞ ⎛ ⎞ = ⎜ ⎟ ⎜ ⎟ ⎝ ⎠ ⎝ ⎠
∑
∑
(4) 2 2 0.8 1 1 h h HL STR h h I I F h I I − ⎛ ⎞ ⎛ ⎞ = ⎜ ⎟ ⎜ ⎟ ⎝ ⎠ ⎝ ⎠∑
∑
(5)By using FHL and FHL-STR indices, the same standard
expressed PLL as follows;
( )
2( )
1( )
( )
LL HL EC R HL STR OSL R
P pu =I pu ⎣⎡ +F P − pu +F − P − pu ⎤⎦ (6) Thus, the ratio of the transformer’s maximum permissible current to the rated current (IR) or the transformer maximum
loading capability was derived from eq. (6):
( )
( )
( )
max 1 LL R R HL EC R HL STR OSL R P pu I I F P pu F P pu − − − − = + + (7)Note that since the temperature rise in the non-winding parts generally is not very critical for dry-type transformers [9], for that kind of transformers, eq. (6) and (7) can be rearranged as follows;
( )
2( )
1( )
] LL HL EC R P pu =I pu ⎡⎣ +F P − pu (8)( )
( )
max 1 LL R R HL EC R P pu I I F P pu − − = + (9)III. ANALYSIS RESULTS
This study aims to analyze effect of voltage harmonics on
FHL, FHL-STRand Imax/IR values of the transformers supplying
the six-pulse rectifier based non-linear loads. For this goal, several voltage harmonic distortion and two load scenarios are simulated in the test system (see Figure 1). The test system consists of a variable voltage source, which is employed to result in any non-sinusoidal test voltage at the bus, a liquid-filled distribution transformer, of which ratings 12.5 MVA and 31.5 kV (star)/11 kV (delta), two different six-pulse rectifiers accompanied with (i) a constant power dc
load (P=10 MVA, C=600µF) and (ii) a battery (Vdc= 10600V, Rdc=5Ω, C=600µF). Note that pu values of the
rated PEC and POSL of the transformer are 0.055 and 0.110,
respectively.
Figure 1: The simulated system.
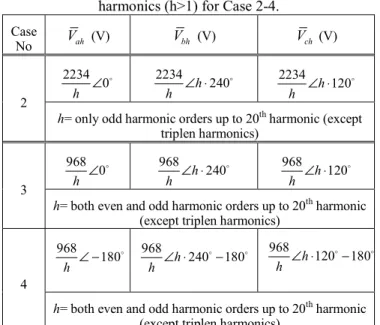
By means of the system, both types of six-pulse rectifiers are supplied under four different bus voltage cases. First one (Case 1) of these supply cases is sinusoidal voltage condition. On the other hand, for three non-sinusoidal bus voltage cases (Case 2-4) with 10% of THDV level. The non-sinusoidal voltages considered in Case 2-4 have different harmonic spectrums to figure out the effect of voltage harmonic spectrum on the transformer derating (see Table I). For all four
cases, the phase-to-neutral bus voltages are balanced, and phasor values of their fundamental frequency components are kept as 6350 0∠ DV, 6350 240∠ DV and 6350 120∠ DV.
Table I: Phasor values of the phase-to-neutral bus voltage harmonics (h>1) for Case 2-4.
Case No Vah (V) Vbh (V) Vch (V) 2 2234 0 h ∠ D 2234 h 240 h ∠ ⋅ D 2234 h 120 h ∠ ⋅ D
h= only odd harmonic orders up to 20th harmonic (except triplen harmonics) 3 968 0 h ∠ D 968 h 240 h ∠ ⋅ D 968 h 120 h ∠ ⋅ D
h= both even and odd harmonic orders up to 20th harmonic (except triplen harmonics)
4 968 180 h ∠ − D 968 h 240 180 h ∠ ⋅ − D D 968 h120 180 h ∠ ⋅ − D D
h= both even and odd harmonic orders up to 20th harmonic (except triplen harmonics)
For the six-pulse rectifier with a constant power dc load (Type 1 load) and the six-pulse rectifier with a battery (Type 2 load), the harmonic loss factor or the maximum permissible loading capability of the transformer are found under the above mentioned four different bus voltage cases (Case 1-4) with using Simulink/MATLAB software [14]. The results are detailed below.
A. Transformer derating results for Type 1 load under Case 1-4 bus voltage conditions
For four bus voltage cases from Case 1 to Case 4, the harmonic current spectrums, FHL and FHL-STR terms of the
Type 1 load are given in Table II, III, IV and V, respectively. One can observe from these tables that under the sinusoidal bus voltage and the non-sinusoidal bus voltage cases with only odd harmonics (Case 1 and 2), phase currents of Type 1 load have its typical current harmonic orders (h=1, 5, 7, 11, 13, 17, 19). However, for the non-sinusoidal bus voltage cases with all (even and odd) harmonic orders (Case 3 and 4), phase currents of the same load have both typical and non-typical harmonic orders. In addition, it is also seen from these tables that current harmonics of the load are sensitive to both voltage total harmonic distortion (THDV) and voltage harmonic spectrum. For Case 1-4 of the three-phase bus voltages, the FHL values of the Type 1 load are
calculated as 25.60, 40.85, 23.20 and 32.73, respectively. On the other hand, for Case 1-4, the FHL-STR values are found as
2.54, 2.70, 2.30 and 2.75, respectively. Additionally, Table VI shows that eddy current loss (PEC) has the pu values
as 1.41, 2.23, 1.25 and 1.80 for Case 1-4. It is also pointed out from the same table that other stray loss (POSL) are
Thus, it can be concluded for the transformer supplying Type 1 load that FHL and PEC are highly dependent on THDV level
and voltage harmonic spectrum. But, this is not the case for
FHL-STRand POSL. As a result, considerably different Imax IR
values such as 66%, 57%, 68% and 61% are observed for Case 1-4 of the bus voltages, and the maximum difference among the calculated Imax IR values is 11%.
Table II: Harmonic current spectrums, FHLand FHL-STR terms
of the Type 1 load for Case 1 of the bus voltages.
h Ih(pu)
[
I puh( )]
2[
]
2 2 ( ) h h I pu h0.8[
I puh( )]
2 1 1.0000 1.0000 1.0000 1.0000 2 0.0001 2.27x10⁻⁸ 9.07x10⁻⁸ 3.95x10⁻⁸ 3 0.0001 2.27x10⁻⁸ 2.04x10⁻⁷ 5.46x10⁻⁸ 4 0.0001 2.27x10⁻⁸ 3.63x10⁻⁷ 6,88x10⁻⁸ 5 0.6566 0.4311 10.7789 1.5624 6 0.0001 2.27x10⁻⁸ 8.17x10⁻⁷ 9.51x10⁻⁸ 7 0.4231 0.1790 8.7755 0.8494 8 0.0001 2.27x10⁻⁸ 1.45x10⁻⁶ 1.2x10⁻⁷ 9 0.0001 2.27x10⁻⁸ 1.84x10⁻⁶ 1.32x10⁻⁷ 10 0.0001 2.27x10⁻⁸ 2.27x10⁻⁶ 1.43x10⁻⁷ 11 0.2093 0.0438 5.3024 0.2984 12 0.0001 2.27x10⁻⁸ 3.27x10⁻⁶ 1.66x10⁻⁷ 13 0.2078 0.0431 7.2997 0.3361 14 0.0001 2.27x10⁻⁸ 4.45x10⁻⁶ 1.87x10⁻⁷ 15 0.0001 2.27x10⁻⁸ 5.1x10⁻⁶ 1.98x10⁻⁷ 16 0.0001 2.27x10⁻⁸ 5.81x10⁻⁶ 2.08x10⁻⁷ 17 0.1400 0.0196 5.6692 0.1892 18 0.0001 2.27x10⁻⁸ 7.35x10⁻⁶ 2.29x10⁻⁷ 19 0.1234 0.0152 5.5055 0.1608 20 0.0001 2.27x10⁻⁸ 9.07x10⁻⁶ 2.49x10⁻⁷ FHL 25.60 FHL-STR 2.54Table III: Harmonic current spectrums, FHLand FHL-STR terms
of the Type 1 load for Case 2 of the bus voltages.
h Ih(pu)
[
I puh( )]
2[
]
2 2 ( ) h h I pu 0.8[
( )]
2 h h I pu 1 0.9728 0.9465 0.9465 0.9465 2 0.0001 2.27x10⁻⁸ 9.07x10⁻⁸ 3.95x10⁻⁸ 3 0.0001 2.27x10⁻⁸ 2.04x10⁻⁷ 5.46x10⁻⁸ 4 0.0001 2.27x10⁻⁸ 3.63x10⁻⁷ 6.88x10⁻⁸ 5 0.5135 0.2637 6.5934 0.9557 6 0.0001 2.27x10⁻⁸ 8.17x10⁻⁷ 9.51x10⁻⁸ 7 0.2771 0.0767 3.7626 0.3642 8 0.0001 2.27x10⁻⁸ 1.45x10⁻⁶ 1.2x10⁻⁷ 9 0.0001 2.27x10⁻⁸ 1.84x10⁻⁶ 1.32x10⁻⁷ 10 0.0001 2.27x10⁻⁸ 2.27x10⁻⁶ 1.43x10⁻⁷ 11 0.2334 0.0544 6.5934 0.3710 12 0.0001 2.27x10⁻⁸ 3.27x10⁻⁶ 1.66x10⁻⁷ 13 0.1686 0.0284 4.8082 0.2214 14 0.0001 2.27x10⁻⁸ 4.45x10⁻⁶ 1.87x10⁻⁷ 15 0.0001 2.27x10⁻⁸ 5.1x10⁻⁶ 1.98x10⁻⁷ 16 0.0001 2.27x10⁻⁸ 5.81x10⁻⁶ 2.08x10⁻⁷ 17 0.2153 0.0463 13.4039 0.4473 18 0.0001 2.27x10⁻⁸ 7.35x10⁻⁶ 2.29x10⁻⁷ 19 0.2605 0.0678 24.5054 0.7157 20 0.0001 2.27x10⁻⁸ 9.07x10⁻⁶ 2.49x10⁻⁷ FHL 40.85 FHL-STR 2.70Table IV: Harmonic current spectrums, FHLand FHL-STRterms
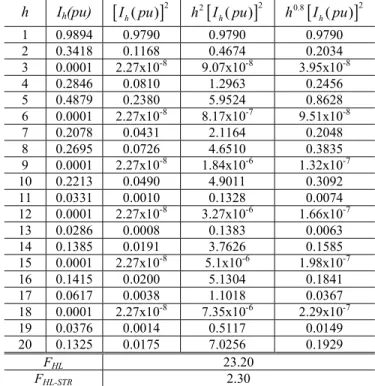
of the Type 1 load for Case 3 of the bus voltages.
h Ih(pu)
[
I puh( )]
2[
]
2 2 ( ) h h I pu 0.8[
( )]
2 h h I pu 1 0.9894 0.9790 0.9790 0.9790 2 0.3418 0.1168 0.4674 0.2034 3 0.0001 2.27x10⁻⁸ 9.07x10⁻⁸ 3.95x10⁻⁸ 4 0.2846 0.0810 1.2963 0.2456 5 0.4879 0.2380 5.9524 0.8628 6 0.0001 2.27x10⁻⁸ 8.17x10⁻⁷ 9.51x10⁻⁸ 7 0.2078 0.0431 2.1164 0.2048 8 0.2695 0.0726 4.6510 0.3835 9 0.0001 2.27x10⁻⁸ 1.84x10⁻⁶ 1.32x10⁻⁷ 10 0.2213 0.0490 4.9011 0.3092 11 0.0331 0.0010 0.1328 0.0074 12 0.0001 2.27x10⁻⁸ 3.27x10⁻⁶ 1.66x10⁻⁷ 13 0.0286 0.0008 0.1383 0.0063 14 0.1385 0.0191 3.7626 0.1585 15 0.0001 2.27x10⁻⁸ 5.1x10⁻⁶ 1.98x10⁻⁷ 16 0.1415 0.0200 5.1304 0.1841 17 0.0617 0.0038 1.1018 0.0367 18 0.0001 2.27x10⁻⁸ 7.35x10⁻⁶ 2.29x10⁻⁷ 19 0.0376 0.0014 0.5117 0.0149 20 0.1325 0.0175 7.0256 0.1929 FHL 23.20 FHL-STR 2.30Table V: Harmonic current spectrums, FHLand FHL-STR terms
of the Type 1 load for Case 4 of the bus voltages.
h Ih(pu)
[
I puh( )]
2[
]
2 2 ( ) h h I pu h0.8[
I puh( )]
2 1 1.0136 1.0273 1.0273 1.0273 2 0.3193 0.1019 0.4078 0.1775 3 0.0001 2.27x10⁻⁸ 9.07x10⁻⁸ 3.95x10⁻⁸ 4 0.2952 0.0871 1.3941 0.2641 5 0.6220 0.3869 9.6717 1.4020 6 0.0001 2.27x10⁻⁸ 8.17x10⁻⁷ 9.51x10⁻⁸ 7 0.3584 0.1285 6.2953 0.6094 8 0.2666 0.0711 4.5477 0.3750 9 0.0001 2.27x10⁻⁸ 1.84x10⁻⁶ 1.32x10⁻⁷ 10 0.2425 0.0588 5.8792 0.3710 11 0.0753 0.0057 0.6861 0.0386 12 0.0001 2.27x10⁻⁸ 3.27x10⁻⁶ 1.66x10⁻⁷ 13 0.0572 0.0033 0.5535 0.0255 14 0.2139 0.0457 8.9639 0.3777 15 0.0001 2.27x10⁻⁸ 5.1x10⁻⁶ 1.98x10⁻⁷ 16 0.2184 0.0477 12.2079 0.4382 17 0.0633 0.0040 1.1563 0.0386 18 0.0001 2.27x10⁻⁸ 7.35x10⁻⁶ 2.29x10⁻⁷ 19 0.1160 0.0134 4.8546 0.1418 20 0.1401 0.0196 7.8467 0.2155 FHL 32.73 FHL-STR 2.75Table VI: Imax/IR, PEC and POSL values for the transformer
supplying Type 1 load under the Case 1-4 of the bus voltages.
Cases PEC=F PHL EC R− POSL=FHL STR OSL R− P − Imax IR
1 1.41 pu 0.28 pu 66%
2 2.23 pu 0.30 pu 57%
3 1.25 pu 0.25 pu 68%
B. Transformer derating results for Type 2 load under Case 1-4 bus voltage conditions
Under four cases of the bus voltages from Case 1 to Case 4, the harmonic current spectrums, FHLand FHL-STR terms
of the Type 2 load are presented in Table VII, VIII, IX and X, respectively.
Table VII: Harmonic current spectrums, FHL and FHL-STR terms
of the Type 2 load for Case 1 of the bus voltages.
h Ih(pu)
[
I puh( )]
2[
]
2 2 ( ) h h I pu 0.8[
( )]
2 h h I pu 1 1.0000 1.0000 1.0000 1.0000 2 0.0001 2.27x10⁻⁸ 9.07x10⁻⁸ 3.95x10⁻⁸ 3 0.0001 2.27x10⁻⁸ 2.04x10⁻⁷ 5.46x10⁻⁸ 4 0.0001 2.27x10⁻⁸ 3.63x10⁻⁷ 6,88x10⁻⁸ 5 0.6434 0.4140 10.3516 1.5005 6 0.0001 2.27x10⁻⁸ 8.17x10⁻⁷ 9.51x10⁻⁸ 7 0.3985 0.1588 7.7832 0.7534 8 0.0001 2.27x10⁻⁸ 1.45x10⁻⁶ 1.2x10⁻⁷ 9 0.0001 2.27x10⁻⁸ 1.84x10⁻⁶ 1.32x10⁻⁷ 10 0.0001 2.27x10⁻⁸ 2.27x10⁻⁶ 1.43x10⁻⁷ 11 0.1840 0.0338 4.0991 0.2306 12 0.0001 2.27x10⁻⁸ 3.27x10⁻⁶ 1.66x10⁻⁷ 13 0.1927 0.0371 6.2790 0.2891 14 0.0001 2.27x10⁻⁸ 4.45x10⁻⁶ 1.87x10⁻⁷ 15 0.0001 2.27x10⁻⁸ 5.1x10⁻⁶ 1.98x10⁻⁷ 16 0.0001 2.27x10⁻⁸ 5.81x10⁻⁶ 2.08x10⁻⁷ 17 0.1246 0.0155 4.4894 0.1498 18 0.0001 2.27x10⁻⁸ 7.35x10⁻⁶ 2.29x10⁻⁷ 19 0.1101 0.0121 4.3796 0.1279 20 0.0001 2.27x10⁻⁸ 9.07x10⁻⁶ 2.49x10⁻⁷ FHL 23.96 FHL-STR 2.42Table VIII: Harmonic current spectrums, FHLand FHL-STR
terms of the Type 2 load for Case 2 of the bus voltages.
h Ih(pu)
[
I puh( )]
2[
]
2 2 ( ) h h I pu h0.8[
I puh( )]
2 1 0.9246 0.8549 0.8549 0.8549 2 0.0001 2.27x10⁻⁸ 9.07x10⁻⁸ 3.95x10⁻⁸ 3 0.0001 2.27x10⁻⁸ 2.04x10⁻⁷ 5.46x10⁻⁸ 4 0.0001 2.27x10⁻⁸ 3.63x10⁻⁷ 6.88x10⁻⁸ 5 0.4942 0.2442 6.1059 0.8850 6 0.0001 2.27x10⁻⁸ 8.17x10⁻⁷ 9.51x10⁻⁸ 7 0.2565 0.0658 3.2243 0.3121 8 0.0001 2.27x10⁻⁸ 1.45x10⁻⁶ 1.2x10⁻⁷ 9 0.0001 2.27x10⁻⁸ 1.84x10⁻⁶ 1.32x10⁻⁷ 10 0.0001 2.27x10⁻⁸ 2.27x10⁻⁶ 1.43x10⁻⁷ 11 0.2072 0.0429 5.1970 0.2924 12 0.0001 2.27x10⁻⁸ 3.27x10⁻⁶ 1.66x10⁻⁷ 13 0.1565 0.0244 4.1403 0.1906 14 0.0001 2.27x10⁻⁸ 4.45x10⁻⁶ 1.87x10⁻⁷ 15 0.0001 2.27x10⁻⁸ 5.1x10⁻⁶ 1.98x10⁻⁷ 16 0.0001 2.27x10⁻⁸ 5.81x10⁻⁶ 2.08x10⁻⁷ 17 0.1927 0.0371 10.7374 0.3583 18 0.0001 2.27x10⁻⁸ 7.35x10⁻⁶ 2.29x10⁻⁷ 19 0.2463 0.0607 21.9132 0.6400 20 0.0001 2.27x10⁻⁸ 9.07x10⁻⁶ 2.49x10⁻⁷ FHL 39.21 FHL-STR 2.65Table VII-X show that for Case 1 and 2 of the bus voltages, phase currents of Type 2 load have its typical current harmonic orders, and for Case 3 and 4 of the bus voltages, it draws both typical and non-typical current harmonic orders. Similar to Type 1 load, it should be mentioned that current harmonics of the Type 2 load are sensitive to THDV level and harmonic spectrum of the bus voltage.
For Case 1-4 of the three-phase bus voltages, the FHL
values of the Type 2 load are calculated as 23.96, 39.21, 21.00 and 29.00, respectively. Under the same bus voltage cases, the observed FHL-STR values are 2.42, 2.65, 2.22 and
2.60. According to the determined FHL and FHL-STR values
(given in Table VII-X), PEC and POSL are found as in
Table XI. This table figure out that PEChas the pu values as
1.30, 2.18, 1.14 and 1.58 for Case 1-4. Pu values of POSL are
0.26, 0.29, 0.24 and 0.28 for the respective cases. Thus,
Imax/IR values of the transformer, which supplies Type 2 load
under Case 1-4 bus voltages, are determined as 67%, 57%, 69% and 63%, respectively. Here, it should be underlined that the maximum difference among the determined Imax/IR values
is about 12%. Above detailed results clearly interpret that voltage harmonic profile should be taken into account for the determination of the maximum loading capability (Imax/IR) of
a transformer supplying Type 1 or Type 2 load.
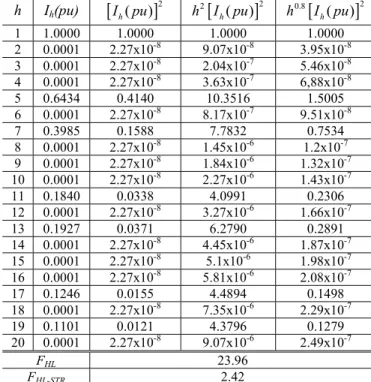
Table IX: Harmonic current spectrums, FHL and FHL-STR terms
of the Type 2 load for Case 3 of the bus voltages.
h Ih(pu)
[
I puh( )]
2[
]
2 2 ( ) h h I pu h0.8[
I puh( )]
2 1 0.9811 0.9626 0.9626 0.9626 2 0.3710 0.1376 0.5506 0.2396 3 0.0001 2.27x10⁻⁸ 2.04x10⁻⁷ 5.46x10⁻⁸ 4 0.2579 0.0665 1.0647 0.2017 5 0.4855 0.2357 5.8929 0.8542 6 0.0001 2.27x10⁻⁸ 8.17x10⁻⁷ 9.51x10⁻⁸ 7 0.2028 0.0411 2.0172 0.1952 8 0.2420 0.0585 3.7489 0.3091 9 0.0001 2.27x10⁻⁸ 1.84x10⁻⁶ 1.32x10⁻⁷ 10 0.2101 0.0441 4.4160 0.2786 11 0.0376 0.0014 0.1718 0.0096 12 0.0001 2.27x10⁻⁸ 3.27x10⁻⁶ 1.66x10⁻⁷ 13 0.0159 0.0002 0.0429 0.0019 14 0.1173 0.0137 2.7010 0.1138 15 0.0001 2.27x10⁻⁸ 5.1x10⁻⁶ 1.98x10⁻⁷ 16 0.1347 0.0181 4.6505 0.1669 17 0.0536 0.0028 0.8310 0.0277 18 0.0001 2.27x10⁻⁸ 7.35x10⁻⁶ 2.29x10⁻⁷ 19 0.0217 0.0004 0.1706 0.0049 20 0.1333 0.0177 7.1111 0.1952 FHL 21.00 FHL-STR 2.22Table X: Harmonic current spectrums, FHLand FHL-STR terms
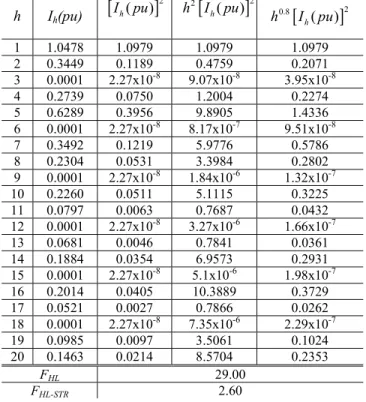
of the Type 2 load for Case 4 of the bus voltages.
h Ih(pu)
[
]
2 ( ) h I pu 2[
( )]
2 h h I pu 0.8[
( )]
2 h h I pu 1 1.0478 1.0979 1.0979 1.0979 2 0.3449 0.1189 0.4759 0.2071 3 0.0001 2.27x10⁻⁸ 9.07x10⁻⁸ 3.95x10⁻⁸ 4 0.2739 0.0750 1.2004 0.2274 5 0.6289 0.3956 9.8905 1.4336 6 0.0001 2.27x10⁻⁸ 8.17x10⁻⁷ 9.51x10⁻⁸ 7 0.3492 0.1219 5.9776 0.5786 8 0.2304 0.0531 3.3984 0.2802 9 0.0001 2.27x10⁻⁸ 1.84x10⁻⁶ 1.32x10⁻⁷ 10 0.2260 0.0511 5.1115 0.3225 11 0.0797 0.0063 0.7687 0.0432 12 0.0001 2.27x10⁻⁸ 3.27x10⁻⁶ 1.66x10⁻⁷ 13 0.0681 0.0046 0.7841 0.0361 14 0.1884 0.0354 6.9573 0.2931 15 0.0001 2.27x10⁻⁸ 5.1x10⁻⁶ 1.98x10⁻⁷ 16 0.2014 0.0405 10.3889 0.3729 17 0.0521 0.0027 0.7866 0.0262 18 0.0001 2.27x10⁻⁸ 7.35x10⁻⁶ 2.29x10⁻⁷ 19 0.0985 0.0097 3.5061 0.1024 20 0.1463 0.0214 8.5704 0.2353 FHL 29.00 FHL-STR 2.60Table XI: Imax IR, PEC and POSL values for the transformer
supplying Type 2 load under the Case 1-4 of the bus voltages.
Cases PEC=F PHL EC R−
(pu) OSL HL STR OSL R
P =F − P − (pu) Imax IR 1 1.30 0.26 67% 2 2.18 0.29 57% 3 1.14 0.24 69% 4 1.58 0.28 63% IV. CONCLUSION
In this study, the harmonic loss factors (FHLand FHL-STR) of
the six-pulse rectifiers, which are accompanied with a constant power dc load and a battery, are evaluated for sinusoidal voltage case (Case 1) and three-different non-sinusoidal voltage cases (Case 2-4). The non-sinusoidal voltage cases have the same
THDV level as 10% but consist of different harmonic spectrums. Accordingly, by means of the simulation results, the winding loss and maximum loading capability of the transformer supplying both nonlinear load types are analyzed for the considered supply voltage conditions.
It is concluded from the analysis results that the difference among the transformer maximum loading capability values, which are determined under the considered supply voltage cases, can be larger than 10%. This case means that the utility voltage’s harmonic profile should be taken into account for the design of the transformers, which are dedicated to supply the considered six-pulse rectifier-based load types.
V. REFERENCES
[1] G. K. Singh, “Power system harmonics research: a survey”, Eur. Trans. Electr. Power, vol. 19, no. 2, pp.151 -172, Aug. 2007.
[2] D. Henderson, P. J. Rose, “Harmonics: the effects on power quality and transformers”, IEEE Trans. on Industrial Appl., vol. 30, no.3, pp. 528-532, May./Jun. 1994.
[3] M. Shareghi, B. T. Phung, M. S. Naderi, T. R. Blackburn, E. Ambikairajah, “Effects of current and voltage harmonics on distribution transformer losses”, International Conf. on Condition Monitoring and Diagnosis (CMD) 2012, pp.633-636, 23-27 Sep. 2012.
[4] T. L. G. Soh, D. M. Said, N. Ahmad, K. M. Nor, F. Salim, “Experimental study on the impact of harmonics on transformer”, IEEE 7th International Power Engineering and Optimization Conf. (PEOCO), pp.686-690, 3-4 Jun. 2013. [5] D. Yildirim, E. F. Fuchs, “Measured transformer derating and
comparison with harmonic loss factor (FHL) approach”, IEEE Trans. on Power Del., vol. 15, no.1, pp.186 -191, Jan. 2000. [6] E. F. Fuchs, D. Yildirim, W. M. Grady, “Measurement of
eddy-current loss coefficient PEC-R, derating of single-phase transformers, and comparison with K-factor approach”, IEEE Trans. on Power Del., vol. 15, no. 1, pp.148 -154, Jan. 2000. [7] E. F. Fuchs , D. Lin, J. Martynaitis, “Measurement of
three-phase transformer derating and reactive power demand under nonlinear loading conditions”, IEEE Trans. on Power Del., vol. 21, no. 2, pp.665 -672, Apr. 2006.
[8] M. A. S. Masoum, P. S. Moses, A. S. Masoum, “Derating of asymmetric three-phase transformers serving unbalanced nonlinear loads”, IEEE Trans. on Power Del., vol. 23, no. 4, pp.2033 -2041, Oct. 2008.
[9] IEEE Recommended Practice for Establishing Transformer Capability When Supplying Nonsinusoidal Load Currents, ANSI/IEEE Standard C.57.110-2008,2008.
[10] Dry-Type General Purpose and Power Transformers, Underwriters Laboratories (UL) Standard 1561, 1994. [11] M. E. Balci, M. H. Hocaoglu, “Effects of source voltage
harmonics on power factor compensation in ac chopper circuits”, Electrical Power Quality and Utilisation Journal, vol. 14, no. 1, pp. 53-60, 2008.
[12] M. E. Balci, D. Ozturk, O. Karacasu, M. H. Hocaoglu, “Experimental verification of harmonic load models”, 43rd UPEC, pp. 1-4, 1-4 Sep. 2008.
[13] A. Mansoor, W. M. Grady, R. S. Thallam, M. T. Doyle, S. D. Krein, M. J. Samotyj, “Effect of supply voltage harmonics on the input current of single-phase diode bridge rectifier loads”, IEEE Trans. on Power Del., vol. 10, no. 3, pp. 1416–1422, Jul. 1995.
[14] Matlab/SIMULINK SimPowerSystems Documents, accessed
onlinefromhttp://www.mathworks.com/help/physmod/power