outlook for the middle east:
unfulfilled promises and
devastation
erinc yeldan
The Middle East, North Africa, and Central Asia, a region of almost 600 mil lion people, is a land of devastation, war, and unfulfilled promises. This region, known as the birthplace of civilization, is host to the three major reli gions of the world and encompasses a diverse cultural and historical heritage, which has been a source of mutual respect and peaceful coexistence for centuries. Yet, the strategic interests of the neoliberal 'Petro Core' have ignored these riches, focusing only on one aspect: oil.
It is oil that finally triggered the war in Iraq, which holds some 11 per cent of the world's oil reserves. This, in my view, was the strategic dimax of the con verging interests of the so-called 'Petro Core'-cmrently consisting of British Petroleum, Royal Dutch/Shell, Exxon-Mobil, and Texaco-Chevron, the world's four biggest private oil companies, which want the open flow of oil resomces at 'administered' (read oligopolistic) prices to the detriment of the supplying Arab nations, and the arms industry, whose interests have been under pressure as the aggregate military budgets of the world have fallen by over 30 per cent and trade in weapons has dwindled. This alliance is one of the most fearsome facets of the new collective imperialism which will profit from a permanent state of war in the world and which sees our planet merely as merchandise for sale. There is little doubt that the conflict in Iraq-and its repercussions in the region-will have long-lasting effects and will serve to exacerbate the already deep economic problems of the Middle East and Central Asian nations.
two decades of stagnation
It is no exaggeration to say that the economic performance of the region has been a complete failure. After the bonanza of economic expansion of the 1970s due to surging oil prices, the 1980s and I 990s have seen virtual stagnation for the economies of the Middle East and North Africa (MENA). In the 1980s, the
76 I REAL OUTLOOK FOR THE WORLD'S REGIONS
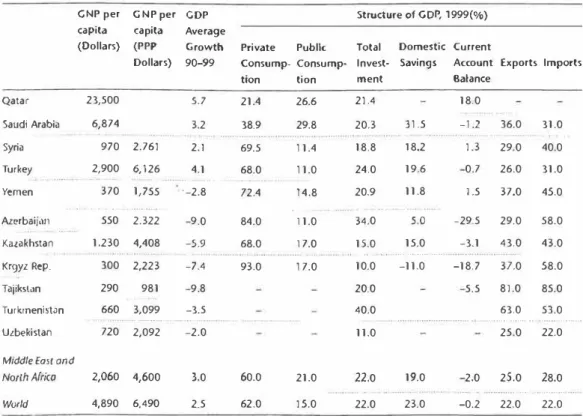
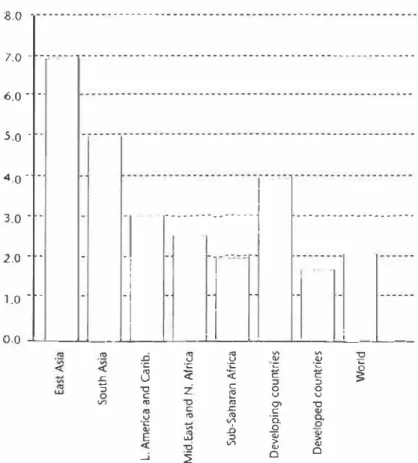
annual per capita average income fell by I per cent; in the I 990s, it grew by a mere I per cent, better only than Sub-Saharan Africa. Growth rates have been erratic, often following the zigzags of oil prices in the international markets. The real rate of growth of per capita GNP has been very low in comparison to the rest of the developing world (see Figure 5.1 ). As of 2000, average per capita GNP was $2060, less than half of the world average (see Table 5.1 ). There arc large differences in income levels from country to country with per capita GNP as high as $23,500 in Qatar and $19,710 in Israel but as low as $370, $970, and $976 in Yemen, Syria, and Iraq respectively.
In Central Asia, economies have suffered from 'transition', with established institutions being dismantled and regions being left open to the assault of ncoliberal globalization. Between 1990 and 1999, growth bas been falling, in some cases dramatically-by 9 per cent in Azerbaijan, 5.9 per cent in Kazakhstan, and 3.5 per cent in Turkmenistan (see Table 5.1 ).
Table 5.1 Structure of the economy in selected Middle East and Central Asian countries CNP per CNP per GDP Structure of GDP, 1999(%) capita capita Average
(Dollars) (PPP Growth Private Public Total Domestic Current
Dollars) 90-99 Consump- Consump- Invest- Savings Account Exports Imports
Qatar Saudi Arabia Syria Turkey Yemen Alerbaij,u1 KaLakhstan Krgyz Rep. Tajikslan Turkmenistan Uzbekistan
Middle East and North Africa World 23,500 6,874 970 2,900 . . . . 370 . .. 550 1.230 300 290 660 720 2,060 4,890 tion 5.7 21.4 3.2 38.9 2.761 2.1 69.5 6,126 4.1 68.0 1,755 ·-2.8 72.4 2.322 -9.0 84.0 4,408 -5.9 68.0 2,223 -7.4 93.0 981 -9.8 3,099 -3.5 2,092 -2.0 4,600 3.0 60.0 6,490 2.5 62.0 tion ment 26.6 21.4 29.8 20.3 31.5 11.4 18.8 18.2 11.0 24.0 19.6 14.8 20.9 11.8 11.0 34.0 5.0 17.0 15.0 .....15.0 .... ... 17.0 10.0 -11.0 20.0 40.0 11.0 21.0 22.0 19.0 15.0 22.0 23.0 Balance 18.0 -1.2 36.0 31.0 1.3 29.0 40.0 -0.7 26.0 31.0 1.5 37.0 45.0 -29.5 29.0 58.0 -3.1 43.0 43.0 -18.7 37.0 58.0 -5.5 81.0 85.0 63.0 53.0 ... ..
. ....
... 25.0 22.0 -2.0 25.0 28.0 ... -0.2 22.0 22.0 Sources: ERF, f<:onomic Trends in the MENA Region, (Cairo: American University in Cairo Press, 2003); World Bank, World8.0 ---7.0 - -:-0---6.0 · • 5.0 -
-1
4.0 . . 3.0 · -2.0 · · 1.0 --:
1
..
···:::::::l
.
···
i
I
····-_j �I
I
0.0 ...._..._�.J...1.�--'-'-�-'--'--� ... ���� ... �� ... --- �...�-"'
.ci "' V .=! "' "' Cl> "' "O·S
�·�
� �·s
.c u C: C: ::, :, "Oz
C: 0 0 C: � V V V) "' "O C: .c "' 0\ "O C: .=!"'
V) "'·a.
0 .:; "' i::, 0 � o:; o:; E ::, -0 V) > Cl> Cl> 0 __; � 0Figure 5.1 Average annual rate of growth of GDP, 1990-99 across the world
Sources: UNCTAD, Trode and Development Report, (Geneva: UNCTAD, 2003); World Bank, World Development Indicators, (Washington DC: World Bank, 2001).
The World Bank estimates that the transition economies will grqw by 3.3 per centt and 3.4 per cent respectively over 2003 and 2004 and that the non-oil exporting MENA region will be growing at rates of2.7 per cent and 3.6 per cent respectively. These growth rates arc significantly lower than those of develop ing countries, which are expected to see average growth of 3.9 per cent in 2003 and 4.7 per cent in 2004.
a crisis in savings and investment
The MENA region suffers, in particular, from low savings generation and con sequently a dismal investment performance. Savings-to-GNP ratios average 19 per cent <:ompnred with the world average of 23 per cent. Saudi Arabia has the
78 I REAL OUTLOOK FOR THE WORLD'S REGIONS
highest savings rate and Bahrain has an cxc.:eptionally high investment rnle. Yet overall, spending on fixed investments in the Arab countries grew by only I.I per cent between 1999 and 2000. This is largely because of cuts in public investment as part of government austerity measures.'
This meagre savings performance has a number of causes, one of which is·thc region's high proportion of young and dependant people who f-ind it hard to save out of scarce incomes. Another reason is the fragile and mostly shallow stnte of the region's financial systems, which fail to provide the necessary inter mediary role between savers and investors. Publicly controlled banks, with an excessive exposure to government debt, outdated or poor regulations, and weak management predominate.
Within this context, premature liberalization of weak financial systems has been disastrous, in most cases diverting savings into short-term speculative ventures rather than to productive activities in the real economy. Turkey, with the fresh memories of the severe financial crises of 2000/200 I is .i prime
example. After the complete liberalization of its foreign capital regime, Turkey suffered a fall in the c.:redit available to investors. As credit-to-GDP ratios fell, banks took on the role of financial rentiers and became prime movers in diverting priorities towards spewlative finance.
Adding to the region's problems, it has failed to attract more than a fraction
of the foreign direct investment going to the developing world, despite severe competition between countries that have offered an .irray of incentives includ
ing tax holidays, long-term leases, greater foreign ownership rights, and generous.entry rules.
International trade has been weak too, despite the signing of trade agree ments between the EU and Israel, Tunisia, Moroc.:c.:o, Jordan, Egypt, and Lebanon over the past few years and Turkey's formation of a full customs union with the EU in 1995. Export performance has varied across countries but, in gencrnl, volumes have fallen catastrophically. Overall, MENA-countries' share of the world exports market has fallen by more than half over the last two decades. Consequently, many countries in the region had to rely on workers' remittances as a source of foreign exchange earnings. Yet, coupled with the increased debt-servicing costs, the region has built up sizeable current account deficits averaging 2 per cent of GNP in comparison with the world average of -0.2 per cent in 1999 (sec 'foble 5.1 ).
labour markets under pressure
The region's economic.: weaknesses arc being exacerbated by the fact that its rate of population growth is one of the fastest in the world. MENA's population was
nearly 300 million in 1999. Between 1980 and 1998, it grew by an average of2.8 per cent. During the 1990s, the number of people of working age rose by 3.1 per cent, far exceeding the world average of 1.7 per cent (see Table 5.2). Estimates suggest that employment in the MENA region has to grow by more Table 5.2 Population and the structure of labor force
Bahrain Total Population (1999, Millions) 0.7 Egypt 62.4 Iran 63.0 Iraq 12.5 Jordan 4.7 Kuwait Lebanon Oman 1.9 4.3 2.3 Qatar ,, ···-··· ... 0.7 Saudi Arabia 21 .4 Syria .. ....... . . ,
..
Turkey . ... ... Yemen Azerbaijan ... Kazakhstan Kyrgyz Rep. Tajikistan Turkmenistan Uzbekistan Middle East 15.7 64.4 1 7.0 8.0 15.4 4.7 6.2 4.8 24.5 and N. Africa 291.0 World 5947.7 Labor Force ParticipationRate(%) Rate(%) Illiteracy
Growth Male Female Male Female
Public Exp on Education (1997, % of GNP) rate (90-99, %) 3.6• 62.8 21.9 2.9 52.3 23.5 2.4 44.3 17.0 ''"'"' ... ... 3.0• 43.9 1 1 .1 5.2 43.9 15.0 -1.6 52.9 ..... .26.7 .............. 3.1 42.4 ..............20.3 .... .... 2.0·' 41.6 9.6 1.4•' 71.0 23.3 3.1 49.9 1 1 .9 4.0 46.1 1 7.4 9.8 18.8 34.5 58.2 18.3 32.6 36.1 56.6 5.8 1 7.4 16.8 21.5 8.5 . ... 20.9 22.0 42.5 20.2 18.3 1 7.2 35.6 4.8 4.0 6.8 5.0 2.5 ... ... 7.5 12.8 41.9 3.1 .. , ... ... 2.8 59.2 36.4 4.7 45.0 1 7.9 7.1 34.3 25.0 2.2 77.3 7.0 1.7 3.0 -0.2 1.4 2.7 3.5 3.0 3.1 1.7 1.0 1.0 4.4 5.3 2.2 7.7 5.2 4.8
a. Av. Population growth rate for 1980-98
Sources: ERF, Economic Trends in the MENA Region 2002, (Cairo: American University in Cairo Press, 2003); World Bank, World Development Indicators, (Washington DC: World Bank, 2001 ).
80 I REAL OUTLOOK FOR THE WORLD'S REGIONS
than 4 per cent per year just to absorb the new additional workforce, leaving aside provision of new jobs for the existing army of unemployecl.! Given the lack of investment, this seems an impossible task.
With high unemployment giving employers the whip hand, workers' wages and conditions are under constant threat. In Egypt, workers are faced with a new law that allows employers to terminate contracts without compensation. In Turkey, new labour legislation aimed at raising standards to EU levels has been postponed for a third time under pressure from powerful business asso ciations that arc arguing that the change would 'inhibit flexibility in the Turkish labour market'.
Across the region, there is a process of working conditions being marginal ized. Widespread privatization and de-unionization arc undermining basic workers' rights (see 'fable 5.2 for a survey of MENA labour markets, which share low participation rates, deep gender inequalities, and high illiteracy rates, leading to low productivity, together with low shares of public investment in education). On average, the number of mlult females who can read and write reaches only two-thirds of that of men in MENA countries. The equivalent numbers arc 98 per cent in Latin America, 76 per cent in Sub-Saharan Africa, and 86 per cent in East Asia. The underlying cause of illiteracy is low public investment in education. Only Saudi Arabia (7.5 per cent), Jordan (6.8 per cent), Yemen (7 per cent), and Kuwait (5 per cent) have spending-to-GNP ratios higher than the world average of 4.8 per cent. Formerly part of socialist economies with generous social welfare programs, the economies of Central Asia tend to have higher investment in education but this will not last as these countries face up to the 'scourge of scrvic.:ing large debts, a phenomenon to whic.:h I now turn.
debt and the assault on welfare
External debt and the need to service this debt are a huge drain on the region's resources and arc contributing to a painful assault on welfare and social spend ing. /\!though there has been a gradual decline in the total external debt position (to $202.l billion in 2001 from $216 billion in 1995), many countries in the region arc still classified as 'severely indebted'. And, despite improve ments in the ratio of total external debt to GNP (from 37.3 per cent in 1995 to 3 1 .2 per cent in 2000) and that to total exports of goods and services (from 1 12.5 per cent in 1995 to 94 per cent in 2000), the pressure to service debt continues to exert a dangerous deflationary force onto the region.
a fifth of total debt-is a significant concern (see Table 5.3 for individual countries).
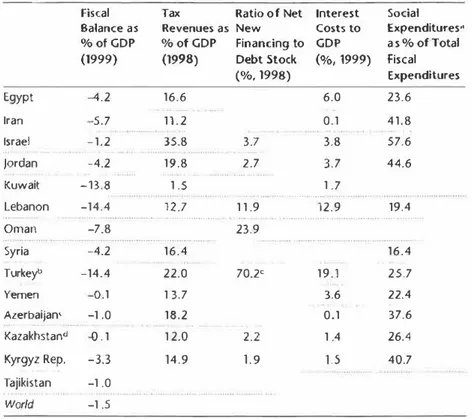
It is deeply damaging that indebted countries are often being forced lo meet their short-term repayment obligations by incurring even further debt. For example, Turkey and Qatar had to borrow more in 200 I , while Morocco was forced to liquidate its privatiz.ition revenues. In 200 I and 2002, Turkey, 10 <.:om ply with IMF targets, was forced to reduce its short-term external debt to less than $15 billion in 2002 from $26 billion in mid-2000. Yet total foreign debt rose to $125. 9 billion in the second quarter of 2002 from $ I 02.9 billion in 1999 and debt-servicing costs increased to 16.8 per cent of the GNP in 2000-2001 from 11 per cent previously and to 70.1 per cent of its export earnings from 69.3 per cent. Interest costs as a ratio to GDP has reached 19 per cent-higher Table 5.3 External indebtedness in the Middle East and Central Asia, averages for 1 9 9 9 -2001
Total Short Term
External Debt Debt (Billions USS) (Billions USS)
Egy(Pt 29.0 4.1 Iran 7.4 3.7 Jordan 7.6 0.7 Lebanon 12.5 2.5 Oman 5.9 ... 1.3 ... Syria 21.3 5.7 Turkey . ..... . ..... 1 1 5.0 20.1 Yemen Azerbaijan Kazakhstan Kyrgyz Rep. ··· ... Tajikistan Turkmenistan Uzbekistan Middle East and N. Africa World a. Doto for 1998 4.2 0.7 0.9 0.2 6.7 0.5 1.4 0.1 0.9 0.6 0.5·· 4.2 0.3 202.1 47.4 2,375.1"
Total Total Debt
External Debt/ Service/Exports
GDP (%) (%) 23.2 9.0 7.3 29.0 89.0 1 1 .0 71.0 27.0 7.0 1 36.0 5.0 78.6 70.0 61.0 5.0 18.8 8.0 36.6 17.0 102.9 29.0 94.9 11.0 32.0·· ... ... . ,. 30.4 26.0 31.2 94.0
Sources: ERF, Economic Trends in the MENA Region 2002, (Cairo: American University in Cairo Press,
82
I
REAL OUTLOOK FOR THE WORLD'S REGIONSTable 5.4 Fiscal balances and indicators
Fiscal Tax Balance as Revenues as % of GDP % of GDP (1999) (1998) Egypt -4.2 16.6 Iran - 5.7 11.2 ... Israel -1.2 35.8 Jordan -4.2 19.8 Kuwait -13.8 1 .5 Lebanon -14.4 12.7
Ratio of Net Interest
New Costs to Financing to GDP Debt Stock (%, 1999) (%, 1998) 6.0 0.1 3.7 3.8 2.7 3.7 1 .7 ·-···"''" ... 1 1 .9 12.9 Social Expenditures" as% of Total Fiscal Expenditures 23.6 41.8 57.6 44.6 19.4 ................. ....................... ··· Oman -7.8 23.9 Syria -4.2 16.4 16.4 Turkeyt> -14.4 22.0 70.2< 19.1 25.7 Yemen - 0.1 1 3.7 3.6 22.4 Azerbaijan' -1 .0 18.2 0.1 37.6 Kazakhstan° - 0 . 1 1 2.0 2.2 1 .4 26.4 Kyrgyz Rep. -3.3 14.9 1.9 1.5 40.7 Tajikistan -1 .0 World -1 .5
a. Social expenditures refer to education, health, social security, wclrMe, housing and community ilmenitie�. ( 1998)
b. Data refers to 2002; c. D.ita refers to 2001; d. Data refers to 2000
Sources: IMF, Government Finance Statistics Yearbook, (Washington DC: IMF, 2002); World B�nk, World Development Indicators, (Washington DC: World Bank, 2001).
than the aggregate value added of agriculture, which employs nearly 40 per cent of the labour force.
So, for the sake, as the IMF would put it, of'gaining credibility and trust in the foreign financial markets', Turkey has been forced to repay short-term debts to foreign creditors at the considerable and damaging price of increasing its debt to the IMF and crippling its economy even more with debt service (see "!able 5.4 for other country examples where new borrowing irns led to higher ratios of net new finance to existing debt stock).
As a result of low growth, high unemployment, and crippling debt service, public finances, particularly in the MENA region-Central Asian countries also have widening deficits but not to the same extent- are in crisis and social
welfare provision is facing draconian cuts. In I 999, the combined budget deficit of the Arab countries was over $30 billion- that is 5.7 per cent of their com bined GNP (sec 'fable 5.4 for individual countries). ·ro meet debHcrvicc obli gations, social investment in education, health, social security, and other amenities is being slashed.
the years ahead
The economic fate of the Middle East is, in the near future, very much depend ent on how the post-war social and political dynamics will evolve. Even with out these political uncertainties, however, the region faces a darkening economic future, not least because of the formidable pressure of debt service. In heavily indebted countries such as Turkey and Lebanon, interest costs of debt servicing will necessitate further cuts in social welfare programs, worsen ing poverty. In the years ahead, the new transition economics of Central Asia also look destined to be forced into their own debt trap. The outlook is grim. further reading
Boratav K., E . Yeldan, and A. Kose, 'Globalization, Distribution, and Social Policy: Turkey, 1980-1998' in L. Taylor (ed.)
External Liberalization a111I
Social Policy (London and New York: Oxford University Press, 2002).Economic Research Forum, Economic Trends in the MENA Region, 2002, (Cairo: The American University in Cairo Press. 2003).
World Uank, World Vt•vclop111rnt /111/ic:ators ( Washington DC: World lhmk,
2001).
World Bank, Global Development Finance (Washington DC: World l3ank, 2003).
Yeldan, E. 'On the IM F-Directcd Disinflation Program in Turkey: A Program for Stabilization and Austerity or a Recipe for Impoverishment and Financial
Chaos?' in N. Balkan (ed.) The Ravages of Neo-Libemlism: Ec01w,11y. Society
and Gender in Turkey (New York: Nova Science Pub., 2002).
references
1 European Research Forum (ERF) (2003). 2 ERF (2003), p.6.