Response of Polyelectrolyte Layers to the SiO
2Substrate Charging As
Probed by XPS
Can Pinar Conger and Sefik Suzer*
Department of Chemistry and Institute of Materials and Nanotechnology, Bilkent UniVersity, 06800 Ankara, Turkey
ReceiVed October 7, 2008. ReVised Manuscript ReceiVed NoVember 26, 2008
A single layer of the cationic polyelectrolyte poly(allyamine) hydrochloride (PAH) deposited, using the layer-by-layer technique, on a silicon substrate containing 5 nm oxide layer is investigated by XPS while applying an external potential bias to the sample to control and manipulate the charge built-up on the oxide layer. Under application of a -10 V bias, the oxide layer is positively charged due to photoemission process, evidenced by the measured Si2p binding energy of 104.4 eV. Application of a +10 V bias attracts the low energy neutralizing electrons, stemming from a hot filament, and leads to a negatively charged oxide layer, also evidenced by the measured Si2p binding energy of 102.9 eV. The single polyelectrolyte overlayer also responds to this polarity change of the oxide layer underneath by displaying a somewhat larger shifts both in the C1s and N1s peaks. In addition to the shifts in the positions, the N1s peaks undergo a significant intensity depletion, mostly on the positively charged -N+component. We interpret this intensity depletion to be the result of reorientation of some of the dangling positively charged groups by moving toward the negatively charged oxide underlayer. To our knowledge this is the first time that a chemically specific response to an electrical stimuli is reported using XPS. A bilayer LbL film consisting of PAH and PSS, exhibits even a larger charging shift, but this time no intensity alteration is observed, most probably due to locking of the -N+groups by the -SO3
+
counterions of the second layer.
Introduction
Control of interfacial properties of materials such as wetting, by means of external chemical/physical stimuli, is still a grand challenge to chemists, physicists, biologists, and material scientists. Permanent and/or reversible alteration of wettability upon application of chemical, electrochemical, thermal, and optical stimuli has been reported and the underlying chemical and physical forces at the molecular level have been determined and extensively discussed.1-6A recent study by Lahann et al. demonstrated the feasibility of reversibly switching the surface between hydrophobic and hydrophilic states, in response to an applied electrical potential to the underlying substrate.7
Wetting property of a surface is generally assessed by the traditional water-contact-angle method, which gives limited information at the molecular level. For obtaining detailed molecular information various types of spectroscopic and/or imaging methods must be utilized. The recently developed and highly sensitive imaging techniques like STM, AFM, etc. unfortunately do not have any chemical specificity, and common spectroscopic methods like IR are not sensitive to interfaces, unless used in very special and difficult modifications like SFG techniques.1-7Electron spectroscopic techniques, like XPS, on the other hand offer both chemical specificity and interface sensitivity.8-10In addition, it is also possible to detect the electrical potentials externally applied and/or internally developed as a consequence of charge built-up.
In XPS analysis, the photoelectrons emitted from the sample may lead to positive charging if the sample is not conducting.
These charges are usually eliminated by directed flow of low energy electrons or ions, which, under certain conditions, may lead to build-up of excess electrons, i.e. negative charging.11,12 The sign and the extent of charging can easily be controlled by application of an external voltage bias to the sample rod, which, in turn, can be utilized for extracting additional analytical and/or electrical information about the sample under investigation, as was recently shown by us and others.13-22 Using the same strategy, in the present contribution, we show that, during our XPS analysis, by switching the sign of the external bias, we force a thin dielectric layer of SiO2substrate to switch from a positively charged state to a negatively charged state, which in turn causes a depletion only in the N1s signal of the quaternary ammonium ions (-N+) belonging to the polyelectrolyte overlayer. We attribute this depletion to be the result of the response of the polyelectrolyte overlayer by reorientation of some of the dangling positively charged groups toward the negatively charged
* Corresponding author. E-mail: [email protected].
(1) Whitesides, G. M.; Laibnis, P. E. Langmuir 1990, 6, 87.
(2) Chaudhury, M. K.; Whitesides, G. M. Science 1992, 256, 1539.
(3) Abbot, S.; Ralston, J.; Reynolds, G.; Hayes, R. Langmuir 1999, 15, 8923.
(4) Ichimura, K.; Oh, S.-K.; Nakagawa, M. Science 2000, 288, 1624.
(5) Byloos, M.; Al-Maznal, H.; Morin, M. J. Phys. Chem. B 2001, 105, 5900.
(6) Wilson, M. D.; Whitesides, G. M. J. Am. Chem. Soc. 1988, 110, 8718.
(7) Lahann, J.; Mitragotri, S.; Tran, T. N.; Kaido, H.; Sundaram, J.; Choi, I. S.; Hoffer, S.; Somorjai, G. A.; Langer, R. Science 2003, 299, 371.
(8) Briggs, D.; Seah, M. P., Practical surface analysis. Part I. Auger and
X-ray photoelectron spectroscopy, 2nd ed.; John Wiley & Sons Ltd.: London,
1996.
(9) Ghosal, S.; Hemminger, J. C.; Bluhm, H.; Mun, B. S.; Hebenstriet, E. L. D.; Ketteler, G.; Ogletree, D. F.; Requejo, F. G.; Salmeron, M. Science 2005, 307, 563.
(10) Maier, F.; Gottfried, M.; Rossa, D. G.; Schulz, P. S.; Schwieger, W.; Wasserscheid, P.; Steinruck, H.-P. Angew. Chem., Int. Ed. 2006, 45, 7778.
(11) Lau, W. M.; Wu, X. W. Surf. Sci. 1991, 245, 345.
(12) Iwata, S.; Ishizaka, A. J. Appl. Phys. 1996, 79, 6653.
(13) Doron-Mor, H.; Hatzor, A.; Vaskevich, A.; van der Boom-Moav, T.; Shanzer, A.; Rubinstein, I.; Cohen, H. Nature 2000, 406, 382.
(14) Shabtai, K.; Rubinstein, I.; Cohen, S. R.; Cohen, H. J. Am. Chem. Soc.
2000, 122, 4959.
(15) Cohen, H. Appl. Phys. Lett. 2004, 85, 1271.
(16) Dubey, M.; Gouzman, I.; Bernasek, S. L.; Schwartz, J. Langmuir 2006,
22, 4649.
(17) Gouzman, I.; Dubey, M.; Carolus, M. D.; Schwartz, J.; Bernasek, S. L.
Surf. Sci. 2006, 600, 773.
(18) Suzer, S. Anal. Chem. 2003, 75, 7026.
(19) Karadas, F.; Ertas, G.; Suzer, S. J. Phys. Chem. B 2004, 108, 1515.
(20) Ertas, G.; Suzer, S. Surf. Interface Anal. 2004, 36, 619.
(21) Demirok, U. K.; Ertas, G.; Suzer, S. J. Phys. Chem. B 2004, 108, 5179.
(22) Ertas, G.; Demirok, U. K.; Atalar, A.; Suzer, S. Appl. Phys. Lett. 2005,
86, 183110.
1757
Langmuir 2009, 25, 1757-1760
10.1021/la803305w CCC: $40.75 2009 American Chemical Society Published on Web 01/06/2009
underlying oxide surface. This is the first observation where a chemically specific response to an electrical stimuli is ever reported using XPS, and we hope that it can be utilized for better understanding of various charge-related phenomena, like contact electrification, etc.23,24
Experimental Section
Cationic type polyelectrolyte poly(allylamine) hydrochloride (PAH) and anionic type polyelectrolyte poly(sodium 4-styrene sulfonate) (PSS) were purchased from Aldrich both having molecular weight about 70,000. NaCl (99.5%) and NaOH were obtained from Merck. Aqueous solutions of polyelectrolytes were prepared with Milli-Q grade water.
Adsorption procedure was carried out from 0.15 M NaCl solution with an amount of 0.5 g/l polyelectrolyte, using established procedure.25-27Because PAH is a weak electrolyte, having strong structural dependence on pH, the pH of the solution was adjusted to 8.0. As a support material, HF-cleaned Si (100) substrate was used with further thermal treatment at 700°C in air to grow a thin oxide layer. The substrate was first dipped into the 0.10 M NaOH solution. Deposition was performed by further dipping into the separate PAH and PSS solutions respectively. Samples were rinsed with deionized water for 1 min after adsorption of each layer, and inserted into the XPS spectrometer after drying for 30 min. Integrity of the deposition process was also ensured by the measured changes in the water contact angle (WCA). Accordingly, the bare substrate before any deposition has a WCA of 40°, which increases to 70° after the initial PAH deposition but goes down to about 50°after deposition of the PSS layer, all consistent with literature data.25-27 A Kratos ES300 electron spectrometer with Mg KR X-rays (nonmonochromatic) is used for XPS measurements, and a near-by filament provides low energy electrons for charge neutralization. Samples are electrically connected to the sample holder, which is grounded or externally connected to a d.c. power supply for biasing. Measurements are normally carried out at 90°electron takeoff angle, but angle dependent measurements are also carried out to ensure the presence, and asses the order of the polyelectrolyte layers, and estimate the thickness of the PAH overlayer, as described in detail in our Supporting Information section.
Results and Discussion
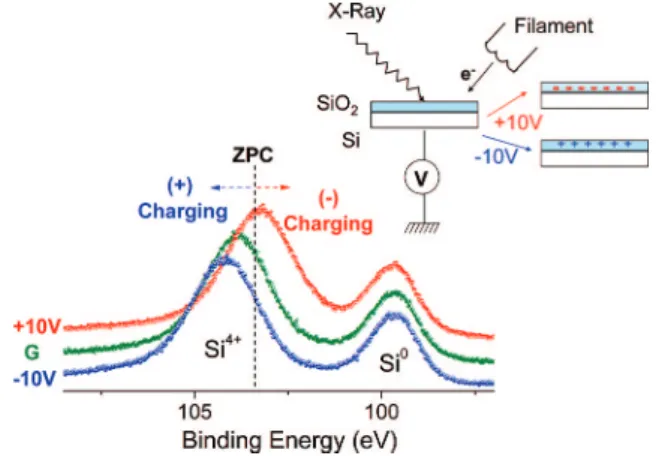
In Figure 1, we show the changes in the measured positions of the Si2p peaks as a function of the applied potential to the sample of silicon with ca. 5 nm oxide layer on top. After correcting for the external potential, the peak of the underlying substrate (Si0) aligns perfectly, however, the peak of the oxide layer (Si4+) shifts nonlinearly, leading to different measured chemical shifts due to the differences in the electrical potential built-up as a result of charging. The Si2p binding energies of the substrate and a truly uncharged oxide layer (at the zero-point-charge state, ZPC) are 99.5 and 103.2 eV, respectively.12
Hence, a measured binding energy larger than 103.2 eV corresponds to a positively charged oxide layer, and a smaller value is the sign of a negatively charged oxide layer. Accordingly, as shown in Figure 1, both in the cases where the sample is grounded and when a -10 V potential is applied externally, the oxide layer is positively charged, due to the uncompensated photoelectrons leaving the sample. Only after application of +10 V, the oxide layer becomes negatively charged due to a relatively larger electron current flowing through the sample, since more electrons are attracted to the positive bias. As we had shown in our previous time-dependent XPS measurements, the charging state of the oxide
layer can easily be controlled by changing the polarity of the external bias, and the fully charged state in the oxide layer is achieved within few seconds.21,22
In Figure 2, we depict similar XPS measurements carried out for a similar SiO2/Si sample, which has an additional overlayer of polyelectrolyte PAH deposited using the layer-by-layer technique. The XPS measurements are carried out in a certain order, first a negative bias is applied to ensure that the oxide layer is positively charged, than the polarity is switched to positive (i.e., +10 V) to obtain the negatively charged oxide layer. Under the -10 V external potential (blue), the positively charged oxide layer is evidenced by the 104.6 eV binding energy measured for the Si2p4+peak, and under +10 V (red), it is negatively charged,
(23) McCarty, L. S.; Whitesides, G. M. Angew. Chem., Int. Ed. 2008, 47, 2188.
(24) Liu, C.; Bard, A. J. Nature Mat. 2008, 7, 505.
(25) Decher, G. Science 1997, 277, 1232.
(26) Decher, G.; Hong, J. D.; Schmitt, J. Thin Solid Films 1992, 210, 831.
(27) Decher, G.; Lvov, Y.; Schmitt, J. Thin Solid Films 1994, 244, 772.
Figure 1.Si2p region of the XPS spectrum of a silicon sample containing ca. 5 nm oxide layer recorded: when the sample is grounded (olive), under -10 V (blue) and +10 V (red) external bias. The oxide layer is positively charged under -10 V bias due to photoelectron emission, and negatively charged under +10 V due to the attracted low energy electrons from a near-by filament. The hypothetical zero-point-charge, ZPC, is defined as the point at which the binding energy of the oxide layer is measured as 103.2 eV.
Figure 2.Si2p, N1s and C1s regions of the XPS spectrum of the same sample as in Figure 1, which also contains a single polyelectrolyte (PAH) layer recorded: when the sample is under -10 V (blue) and +10 V (red) external bias. Changing the polarity of the bias from negative to positive causes a charging shift of 1.7 eV in the Si2p peak of the oxide layer. The corresponding shifts are higher for both the N1s and C1s peaks. The N1s peak is curve-fitted into 2 components corresponding to -NH3+
(magneta) and -NH2 (dark yellow). In addition to the shifts, upon
changing the polarity of the bias (leading to switching from positive to negatively charged oxide layer), the intensity of the -N+ peak is drastically lowered.
again as evidenced by the 102.9 eV measured. Upon switching the polarity, although the peak positions shift, the total intensity ratio of the oxide to the silicon substrate peaks remains unchanged. The composite C1s peak also shifts about 2.3 eV, slightly more than the oxide peak (1.7 eV), upon switching of the polarity of the oxide layer, but also without any alteration in its total intensity. However, the situation is quite different in the case of the N1s. First, the broad composite N1s peak can be curve-fitted into 2 peaks one for the neutral -NH2, and the other, at ca. 1.5 eV higher binding energy, for the quaternized -NH3+moieties,28 and both of these peaks shift upon change of the polarity.
Analysis of the measured binding energy shifts enables us to determine the potentials developed under negative and positive bias both in the SiO2and PAH layers, as shown schematically in Scheme 1. Under -10 V bias the SiO2and PAH layers do not respond to the full -10.0 eV shift, due to positive charging, but remain at -8.7 and -8.4 eV. i.e. displaying +1.3 and +1.7 eV average charging shifts, respectively. Under +10 V bias the corresponding average charging shifts are -0.4 and -0.7 eV respectively.
Charge sensitive XPS measurements on mono and multilayers of self-assembled alkylphosphonate films were reported by Gouzman et al.,16,17where it was claimed that single monolayer did not exhibit any charging shift, and only in multilayer case a measurable charging shift was observed. A similar conclusion was also recently reported by Maidul Islam et al. for Langmuir-Blodgett films;29again whereas no differential charging was detected in a single LB layer, significant charging effects were observed for the multilayers. On the other hand, similar measurements of Cohen et al.30demonstrated that the charging shifts were measurable in different chemical moieties down to a monolayer. Our measurement is somewhere between the two since a single polyelectrolyte layer of PAH is estimated to be ca. 0.6 nm thick using our angle-dependent XPS measurements, which are described in detail in the Supporting Information (SI Figure 2 and Scheme 1).
In addition to charging shifts, and as opposed to the Si2p and C1s peaks, the overall intensity of the N1s peaks decreases significantly upon switching to negatively charged oxide layer. The curve-fitting allows us to follow the intensity changes and observe that, whereas the intensity of the uncharged -NH2peak remains almost the same, the intensity of the positively charged -NH3
+
peak decreases ca. 30% upon switching the polarity of the oxide layer (see also the Supporting Information). We explain this intensity change by rearrangement of the positively charged groups, orienting themselves away from the outermost surface toward the negatively charged oxide layer as a response to the
switching of the polarity, as depicted in Scheme 2. A very similar observation was reported by Maier et al., where using the angle-dependence of the -N+and -N components of the N1s composite peak, a surface enhancement of a Pt salt in an ionic liquid was demonstrated.10
However, although the charging shifts in the position of all the peaks are easily reversible, by switching the external bias, the alteration in the intensity is not. We have carried out the same measurements at least three times to ensure reproducibility. Since XPS measurements are carried out under UHV conditions, reorientation of the polyelectrolyte chains might be very slow and not so easy as in an electrochemical cell.7In addition, when the second layer of the oppositely charged polyelectrolyte PSS is deposited, similar charging shifts are observable also in the S2p peak of the anionic polyelectrolyte, but no significant change in the intensity of the N1s peak is observed as shown in Figure 3 (and also reproduced in detail in the Supporting Information). We attribute the latter observation to be the result of locking of the former dangling surface -N+groups of the first layer by the negatively charged -SO3-groups of the second layer.
These results are significant in terms of utilizing the XPS technique for charge sensitive analysis, and the present
contribu-(28) Goh, S. H.; Lee, S. Y.; Zhou, X.; Tan, K. L. Macromolecules 1998, 31, 4260.
(29) Maidul Islam, A. K. M.; Mukherjee, M. J. Phys. Chem. B 2008, 112, 8523.
(30) Cohen, H.; Maoz, R.; Sagiv, J. Nano Lett. 2006, 6, 2462.
Scheme 1.Schematic Representation of the Potentials Measured by XPS in the SiO2Dielectric Layer, and the PAH Layer, When
the Sample Is Subjected to -10 V and +10 V External Voltage Bias
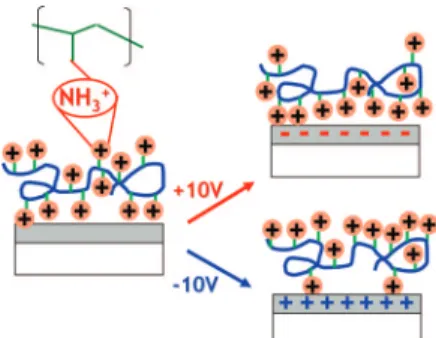
Scheme 2.Schematic Representation of the Reorientation of the Quaternary Ammonium Groups upon Switching the Polarity of the Substrate from -10 V to + 10 V, Which in Effect Switches
the Underlying Oxide Layer from the Positive to Negative Charged State
Figure 3.Si2p, N1s, S2p, and C1s regions of the XPS spectrum of the same sample as in Figure 1, which also contains one single cationic (PAH) layer, and one anionic (PSS) polyelectrolyte layers. Similarly changing the polarity of the bias from negative to positive causes a charging shifts in all peaks, but without any measurable intensity alteration.
tion is aiming only to provide our initial proof-of-principle effort. Our current and future investigations will concentrate toward better understanding of the factors affecting various charging processes, and their possible material dependencies.
Conclusions
We show, using the measured shifts in the positions and alterations in the intensities of XPS peaks, that the response of a single polyelectrolyte layer can be measured in a chemically specific way (-N vs -N+) to the switching of the underlying oxide layer from positive to negatively charged state by changing the polarity of the externally applied bias voltage. This method, charge and chemical specific analysis, of surface structures using XPS, is simple and versatile, which can be applied to a large
class of materials, where the charge accumulation can also be induced by other means, like thermal, chemical, electrochemical, optical, etc.
Acknowledgment. This work was partially supported by TUBA (Turkish Academy of Sciences) and TUBITAK (The Scientific and Technological Research Council of Turkey) through the Grant No. 106T409.
Supporting Information Available:Figues shwoing the full XP spectrum of one of the samples investigated and angle dependent measurements and text describing our procedure for estimating the thickness of the PAH layer, as well as assessing the order of the deposited polyelectrolyte layers. This material is available free of charge via the Internet at http://pubs.acs.org.
LA803305W