19
93MNRAS.2
62.
.511E
Mon. Not. R. Astron. Soc. 262, 511-520 (1993)
Ginga observations of XI820 — 303 in the globular cluster NGC 6624
E. N. Ercan,1 A. M. Cruise,2 B. J. Kellett2 and K. Saygili3
1 Department of Physics, Bogaziçi University, Istanbul, Turkey
2 Astrophysics Division, Rutherford Appleton Laboratory, Chilton, Didcot, 0X11 OQX 3 Bilkent University, Ankara, Turkey
Accepted 1992 November 11. Received 1992 November 5; in original form 1992 August 24
ABSTRACT
We present the first spectral observations obtained by Ginga of the low-mass X-ray binary source X1820-303 located in the globular cluster NGC6624. Two two- component spectral models are found to provide good fits to the data: a bremsstrahlung component plus a blackbody, or a power law with exponential cut-off plus a blackbody. In both cases, inclusion of an iron line at 6.7 keV improves the fits. After considering the importance of Comptonization for the spectral and temporal behaviour, we select the power law plus blackbody model. This model then provides simple explanations for many of the observed features present in our data. The model requires a scattering cloud surrounding the neutron star, with a Thomson optical depth of~ 7.
By studying the variation in the amphtude of the 685-s binary period with source luminosity, it is possible to gain some insight into the source geometry. This reveals that our line of sight to X1820 - 303 is close to some ‘critical’ angle. We suggest that gravitationally induced shocks in the rim of the accretion disc cause the height of the rim to vary with azimuthal angle, resulting in the quasi-sinusoidal X-ray orbital modulations. Superposed on this are random ‘dips’ which result from chaotic, time- varying structures in the disc which, principally, only cover the blackbody component of the spectrum.
Key words: accretion, accretion discs - binaries: close - stars: individual: XI820 - 303 - globular clusters: individual: NGC 6624 - X-rays: stars.
I INTRODUCTION
The X-ray source XI820 - 303, located in NGC 6624, was one of the first X-ray sources to be associated with a globular cluster (Giacconi et al. 1974), and one of the first X-ray bursters (Grindlay et al. 1976). It is the brightest amongst the II known high-luminosity globular cluster X-ray sources, and has similar properties to the ~ 50 known low-mass X-ray binaries found in the Galaxy as a whole. Because of its location close to the centre of a globular cluster and the presence of X-ray bursts, it has been thought for over a decade that XI820 - 303 contains a neutron star and a late- type stellar companion (see e.g. Lewin & Joss 1983).
The source X1820-303 cycles between high- and low- luminosity states that differ by a factor of 3. When it is bright, its luminosity is close to 1038 erg s-1 and comparable to the
lower luminosity range of the ~ 10 high-luminosity Galactic Bulge low-mass X-ray binaries (Webbink, Rappaport & Savonije 1983). In its low state, its luminosity is similar to the persistent emission from the ~ 30 known X-ray burst sources. X-ray bursts have been seen from X1820-303 only during this low state (e.g. Clark et al. 1977; Haberl et al.
1987), consistent with the accretion-rate dependence of the helium thermonuclear flash model (see e.g. Ayasli & Joss 1982). Observations of the variability of X1820 - 303 over a 7-yr interval indicated that the transition from high to low states occurs about every 176 d (Priedhorsky & Terrell 1984). Part of the interest in studying this source is due to the fact that, at different times, it shows characteristics of both groups of low-mass X-ray binaries.
EXOSAT observations of X1820-303 led to the dis- covery of a coherent ~ 11-min modulation of its X-ray flux with a 2-3 per cent amplitude (Stella, Priedhorsky & White 1987a). This periodicity was subsequently confirmed using archival data from SAS 3, Ariel V and Einstein MPC/SSS (Morgan, Remillard & Garcia 1988; Smale, Mason & Mukai 1987; Kelley et al. 1989). It has been argued that the ~ 11- min periodicity is most likely to be the orbital period of the system. The Ginga observations by Sansom et al. (1989) also confirmed the presence of the ~ 11-min modulation.
In addition to the regular periodicity, X1820-303 also exhibits quasi-periodic oscillations (QPOs), discovered by EXOSAT (Stella, White & Priedhorsky 1987b) when the source was in its high, non-bursting state. Ginga observations
19
93MNRAS.2
62.
.511E
512 E. N. Ercan et al
by Dotani et al. (1989) also confirmed the presence of QPOs from this source in its high state. The Ginga data clearly show two peaks in the power spectra: one almost ‘fixed’ at 7 Hz (with the source intensity changing by 30 per cent), with a second peak varying from 15-30 Hz, anticorrelated with the X-ray luminosity. The Ginga data also show XI820 - 303 to be an ‘atoll’ (rather than a ‘Z’) source, based on the X-ray colour-colour diagram which indicates a ‘banana’ shape (Hasinger & van der Klis 1989; van der Klis 1989).
We present here a study of the X-ray spectral and tem- poral properties of XI820 - 303 from the Ginga Large Area Counter (LAC). The data presented here were also part of the observation previously reported by Sansom et al. (1989), and Dotani et al. (1989).
2 OBSERVATIONS
Observations of XI820 - 303 with the Ginga LAC covered a five-day interval starting on 1987 May 1 at 17:23:00 ut and ending on 1987 May 5 at 01:41:40 ut. A journal of the observations presented here is given in Table 1.
The useful data were accumulated in 48 pulse-height channels with MPC1 and MPC2 modes (for details of the Ginga LAC, see Makino et al. 1987 and Turner et al. 1989). Spectral data were taken in both low- and high-gain modes, although we only consider the low-gain data here. Only the data between 1.94 and 16.83 keV were used in the spectral fitting. With Ginga, simultaneous measurements of the source and background are not possible, thus the back- ground must be estimated by using a separate exposure on a blank field near the source made close in time to the source observations. The accuracy of this technique is ~ 0.03 count s“1 keV-1 at energies less than 10 keV and ~ 0.01 count s"1
keV"1 at higher energies. Since the source count rate is over
-3000 count s-1, this uncertainty in the background esti-
mation is small compared with the Poisson noise unless extremely long integrations are used.
3 LAC DATA ANALYSIS 3.1 Spectral analysis
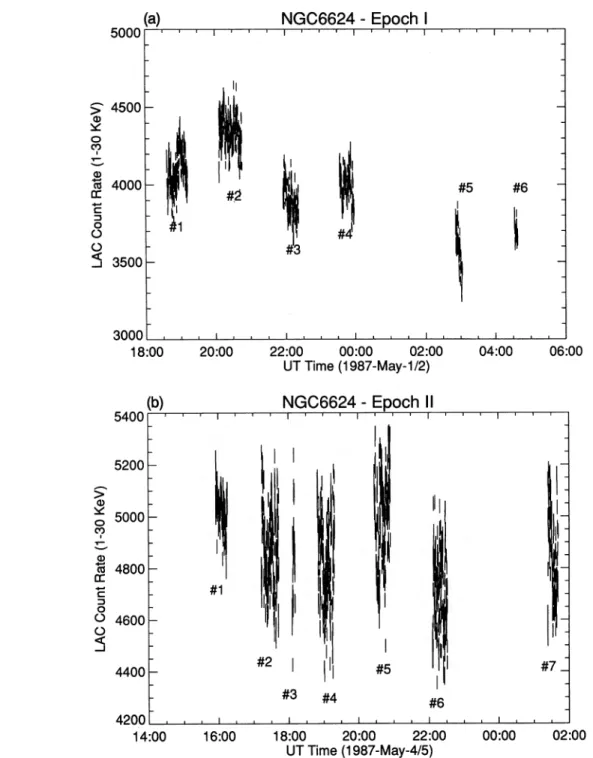
Figs 1(a) and (b) show the X-ray fight curves of X1820 - 303 for the Ginga observations in two different epochs (i.e. 1987 May 1-2 and 4-5). We have investigated the X-ray spectrum of X1820 - 303 using the data integrated over - 1000-2000 s time intervals and also using the integrated data over the whole observing period in the two different epochs, corre- sponding to epoch I (covering the total observations of the source between 1987 May 1 and 2) and epoch II (covering total observations of the source between 1987 May 4 and 5) respectively. For epoch I data, the average count rate of the
Table 1. Journal of Ginga observations of XI820 - 303. Date Start Time End Time Gain/Mode Target
UT 87/5/1 - 87/5/2 18:36:40 87/5/2 - 87/5/3 15:45:00 87/5/4 - 87/5/5 15:56:00 UT 04:36:40 22:28:20 01:41:40 Low/MPC-2 Source Low/MPC-1 Background Low/MPC-2 Source
source is determined to be -3700 count s_1, whereas the
average count rate of the source for epoch II data was found to be ~ 4500 count s_1. These spectra were then fitted with
the following spectral models: (i) thermal bremsstrahlung (TB); (ii) power law (PL);
(iii) blackbody (BB);
(iv) power law with exponential cut-off (PLEC); (v) thermal bremsstrahlung + fine (TB + L);
(vi) thermal bremsstrahlung + blackbody (TB + BB); (vii) thermal bremsstrahlung + blackbody + fine (TB + BB + L);
(viii) two-component power law (PL+ PL); (ix) two-component blackbody (BB + BB );
(x) thermal bremsstrahlung + K + edge absorption (TB + KEDG);
(xi) power law with exponential cut-off + blackbody (PLEC + BB);
(xii) power-law with exponential cut-off + blackbody + fine (PLEC + BB + L).
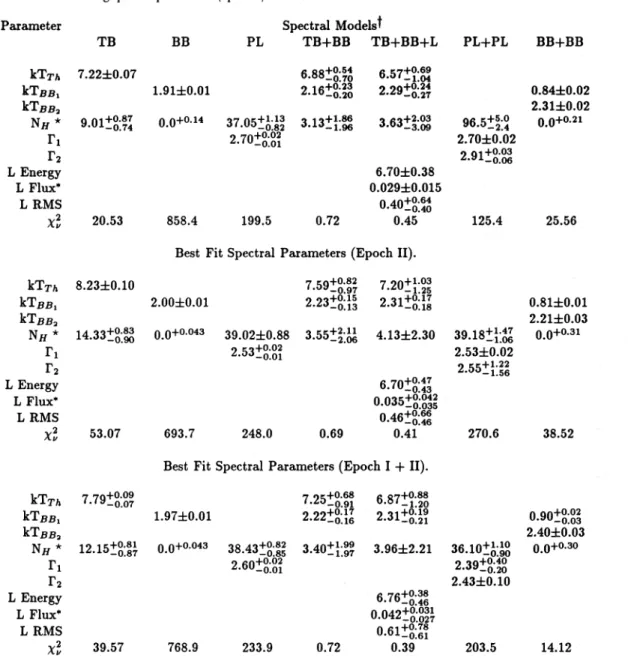
These spectra were folded through the detector response in the normal way. Line-of-sight absorption was included in these models using the cross-sections and abundances given by Morrison & McCammon (1983). The best-fitting spectral parameters resulting from the model fits to the Ginga LAC data integrated over epochs I and II, and the corresponding reduced chi-squared values, are given in Tables 2 and 3. A single thermal bremsstrahlung model fit with the inclusion of K-edge absorptions at 3.2 and 4.1 keV due to Sxv and Arxvn gave unacceptable chi-squared values (63 282.1, 61237.3 for 23 d.o.f. and 37 321.1,43 537.6 for 23 d.o.f.) for both data epochs, and the results are not shown in the tables. In addition, the power law with exponential cut-off model did not give acceptable fits ( xl °f 556 and 179 for epochs I and II respectively). Tables 2 and 3 also give the best-fitting spectral parameters of the source resulting from the various spectral model fits to the LAC data integrated over the whole observing period.
As can be seen from Table 2, no single-component spec- tral model yielded a satisfactory fit, so we considered more complex spectral shapes. Two models were found to produce good fits to the data: (i) the superposition of a bremsstrah- lung component (referred to as the thermal component) and a blackbody; and (ii) a power law with exponential cut-off and a blackbody. The quality of the fits was estimated with the usual technique of chi-squared minimization; confidence intervals were obtained according to the prescriptions of Lampton, Margon & Bowyer (1976), considering as interest- ing parameters the two temperatures (Tth, Tbh), the photon
power-law index T, the high-energy cut-off Ec, and the
hydrogen column density NH. Uncertainties correspond to
90 per cent confidence levels. Addition of a 6.7-keV emis- sion fine to our best-fitting two-component (TB + BB) and (PLEG + BB) models made the fits to the epochs I and II and integrated data over the whole observing period even better, as can be seen from Tables 2 and 3, although the improve- ments are within the assumed systematic errors (which were taken to be ± 0.5 per cent and are the dominant source of errors).
For the TB + BB + L model, the epoch I flux is 0.97 xlO-8 erg cm-2 s-1 and the epoch II flux is
19
93MNRAS.2
62.
.511E
Ginga observations ofX1820 — 303 513
UT Time (1987-May-4/5)
Figure 1. The 1-30 keV timeline for (a) epoch I, and (b) epoch II. The individual ‘sections’ of each epoch are indicated by numbers.
1.45 x 10"8 erg cm-2 s"1. The PLEC + BB + L model gives
1.10 x 10⁻⁸ erg cm-2 s“1 and 1.36 x 10⁻⁸ erg cm-2 s-1 for
epochs I and II respectively. The corresponding 1-20 keV luminosities of the source obtained from these best-fitting models are ~ 1.2-1.3 x 1036 d2 and ~ 1.7-1.6 x 1036 d2 erg
s”1 kpc-2 for data from epochs I and II, respectively; d is the
distance to the source in kpc.
We have also investigated the X-ray spectrum of the source using the data integrated over ~ 1000-2000 s time intervals. For epoch I, we divided the data into five sections (see Fig. la), each section having a total observing time inter- val of ~ 1500 s. Each spectrum was then fitted with various
spectral models folded through the detector response, as has been described above for the epochs I and II data analyses. The same procedure was followed for epoch II data samples, again by dividing the epoch II data into six sections of obser- vation with each section having ~ 1500-s time intervals (see Fig. lb). Tables 4 and 5 present the best-fitting spectral para- meters of XI820 - 303 for the five sections of epoch I and six sections of epoch II, for the (TB + BB + L) and (PLEC + BB + L) models. Figs 2(a) and (b) show the Ginga LAC spectra of X1820-303 and the best-fitting (TB + BB + L) models for the integrated data from epochs I and II respectively, while Figs 2(c) and (d) show the best-
19
93MNRAS.2
62.
.511E
514 E. N. Ercan et al.
Table 2. Best-fitting spectral parameters (epoch I). Parameter TB BB Spectral Modelst PL TB+BB TB+BB+L PL+PL BB+BB kTy* kTBBj kT£B3 Nb* Pi r2 L Energy L Flux* L RMS xl 7.22±0.07 9.01í£?4 1.91±0.01 o.o+01 20.53 858.4 37.05^0 82 2.70+°®? 199.5 6.88Í°;|S 2-16Í0.20 0.72 6.57í°;°° 2.29íg;^ 3.63í§;^ 6.70±0.38 0.029±0.015 0.40Ío4o 0.45 96.5Í|;5 2.70±0.02 o qi +0.03 125.4 0.84±0.02 2.3Ü0.02 0.o+021 25.56 Best Fit Spectral Parameters (Epoch II).
kTy/i klsBi kTBB2 Nb* Fi r2 L Energy L Flux* L RMS ^2 8.23±0.10 14.33Í0I0 2.00±0.01 O.O+0043 39.02±0.88 9 t;Q+0 02 Z.Ot>_0 01 7 eiq+0.82 9 OQ+0.15 Z.ZO_0.13 O.i)O_2>06 53.07 693.7 248.0 0.69 7.20ÍÍ;“ « 01 +0.17 4.13Í2.30 6.70í°;^ 0.035íg;g|l 0.46íg;°| 0.41 39.18ÍÍ;« 2.53Í0.02 o ec + 1.22 z*00-1.56 270.6 0.81Í0.01 2.21Í0.03 o.o+0-31 38.52 Best Fit Spectral Parameters (Epoch I + II).
kTm kTßß! kTBBa Nb* Fi r2 L Energy L Flux* L RMS v>2 7 7q+0.09 ‘•íí#-0.07 1.97Í0.01 12.15Ío|7 O.O+00 39.57 768.9 38.43Íg;|Í 2.60íg;g? 233.9 7 oc;+0.68 ' *^—0.91 9 OO+0.17 z*zz-0.16 3.401»;°? 0.72 6.87í°;|g 2.31íg;»? 3.96±2.21 6.76íg;“ 0.042íg;g?» 0.611g;™ 0.39 36.10j[¿'¿2 9 Qq+0.40 z.oy_0.20 2.43Í0.10 203.5 0.90ÍHÍ 2.40Í0.03 O.o+o-30 14.12 f Models: blackbody (BB); thermal bremsstrahlung (TB); power law (PL); 6.7-keV Fe line (L). Temperatures, L(ine) energies, and L RMS (rms linewidth) are given in keV, while power-law slopes are the photon index. * Column densities are in units of 1021 cm “2. * L(ine) flux is in units of photon cm ~2 s "1.
Table 3. Best-fitting spectral parameters from (PLEC + BB + L) model for epoch I, epoch II and epochs I + II.
Parameter Epoch I T 2.211g;}? Ec 4.7l!g;l IcTbb 2.35±0.12 Nh * 9.45l? jg L Energy 6.70 L Flux* 0.012lg ggg L RMS 1.09lg g| XÏ 0.26 See Table 2 for notes.
Epoch II Epoch I H- II 9 1ß+°*l165 9 ik+0.18 ¿.LO_Q20 a ßq+0.38 a 70+0.40 ^.oy_0.23 ^*,u-0.29 9 4Q+0.08 « *>0+0.12 ¿*oo-0.05 q qK+0.2.32 q 44+2.34 y.yo_2>56 y.^_2.26 6.70 6.70 0.021íg;g}} 0.016íg;g¿» 1 90+0*32 -i i O+0.34 i.ZÖ_0.66 a*1ö-0.37 0.20 0.16
fitting (PLECiBB + L) fits for the same data (parameters can be found in the tables). Although 1 a errors are shown on each main plot, they are completely concealed by the histo- gram line used to show the models. The errors can best be judged from the residual plots shown below each main fit. A comparison of the best-fitting spectral parameters obtained from the best-fitting (TB + BB + L) model for the two epochs indicates that the spectrum of the source varied by ~ 10 per cent in the best-fitting thermal bremsstrahlung temperature and absorbing column density within la error limits. The best-fitting absorbing column density range (see Tables 4 and 5) obtained from the best-fitting spectral model in the 1.94-16.85 keV energy range is consistent with previous determinations (e.g. Stella et al. 1987b from EXOSAT data) and with the extinction measured in the direction of
19
93MNRAS.2
62.
.511E
Ginga observations of XI820 — 303 515 Table 4. Best-fitting spectral parameters for (TB + BB + L) for epochs I and II (all sections).
Epoch No. kTy/j kT^ß L Energy L Flux* L RMS 1 2 3 4 5+6 6.58í?;2 1.20 ).70 6.701?;™ 6.60±0.70 6.7415™ “80 6.57Í?; 2.26+0.24 2.25+0.27 2.30+0.30 2.26+0.30 2.34+0.35 3.70+2.10 3.45+2.00 3.30+2.00 3.25+2.20 3.40+2.10 6.70+0.47 6.70+0.30 6.70+0.40 6.62+1.00 6.70+0.70 0.032+0.32 0.029!°°« 0.024l°:°™ 0.033!°;°« 0.0191°;°?° 0.40!°;?° 0.46Í0.46 0.901J;« 0.58li;?° 0.46!°;°° 0.48 0.35 0.29 0.35 0.34 II 1 2+3 4 5 6 7 7 9C+1.65 7 ^Q+« *^_0.95 1'00 7.20+0.80 7 i 7+1.00 7 O1+0.90 i*Zi-0.24 7 64+' 1.30 1*00 9 47+0-—0.20 17 2.20+0.20 2.30+0.20 2.30+0.20 2.20+0.20 2.22+0.20 3.78+2.49 3.94+2.32 4.10+2.30 4.10+2.20 3.97+2.40 3.80+2.50 6.701°;« 6.80±0.40 6.60l°;|° 6.70!°;« 6.77!°;« 6.76!°;« 0-034!°;°« 0.034!°;°« 0.045!°;«* 0-046l°;°|* 0.045!°°« 0.038l°;«o 0.95!°;°° 0.46!°;°° 0.63!°;°! 0.65!°;«* 0.64!°;°° 0.57!J;5? 0.26 0.48 0.54 0.52 0.48 0.36 * Column densities are in units of 1021 cm 2; *L(ine) flux is in units of photon cm 2 s
Table 5. Best-fitting spectral parameters for (PLEC + BB + L) for epochs I and II (all sections). Epoch No. F Ej 1 9 19+0*06 4 kq+0.22 1 ¿.1Z_0 07 2i 2 2.09!°;°° 4.55!°;?? I 3 2.16±0.06 4.64!g|| 4 2.15!°;°! 4.56!°;?| 5+6 2.18!°;°° 4.79!°;?° 1 2.08!?57 4.36!??? 2+3 2.00!°;°° 4.51!°;?? II 4 2.03!°;°? 4.57!°;?« 5 2.06!°;°? 4.62!°;?? 6 2.08!°;°? 4.54!°;?? 7 2.01!°;°° 4.59!°;?° kTBB L Energy 2.37!?;?? 7.76l?;|? 6.70 2.3l!?;J? 7.73!?;?? 6.70 2.34!??? 8.19l?|? 6.70 2.32!?;?? 8.17!?;°° 6.70 2.27!?;?? 8.76!?;?? 6.70 2.48!??? 8.08!}'}? 6.70 2.39!?;?° 7.40!?;?! 6.70 2.35!?;?? 7.86!?;°° 6.70 2.48l?;?5 7.92+0.98 6.70 2.40!?;?5 8.24+0.98 6.70 2.36l?:?5 7.64!?'°} 6.70 L Flux* L RMS xî 0.01l!?'??| 1.0l!?'?| 0.56 0.014Î?;??? 1.09!?;?! 0-43 0.009l?;??| 0.96!?;?! 0-46 0.010Í?'??? 1.03!?'?5 0.60 0.005!?;°?° 0.76!?;?° 0.23 0.012!?;??? 1.07!?;?° 0.35 0.018!?;°?° 1.16!?;?? 0.50 0.020Í?;??! 1.25!?;?? 0-51 0.014!?;??| 1.07+0.23 0.50 0.024!?'!}! 1.31+0.23 0.47 0.014!?;°?? 1.09!?;?? 0.55 Notes: f Ec is the cut-off energy in keV; * Column densities are in units of 1021 cm 2; *L(ine) flux is in units of photon
cm-2 s"1.
X1820-303, E{B-V) = 027 (Lüler & Carney 1978), but the absorbing column density obtained from the (PLEC + BB + L) models in the same energy range is a factor
~ 2 higher.
The contribution of the blackbody component obtained from the (TB + BB + L) model spectrum of X1820 - 303 was found to be ~ 2.1 x 10⁻⁹ erg cm-2 s-1 (i.e. ~ 18 per cent of
the total) for epoch I, and ~4.1 x 10"9 erg cm-2 s_1 (i.e.
~28 per cent of the total) for epoch H. For the (PLEC + BB + L) model, the relative contribution of the blackbody component was ~ 26 per cent in epoch I (2.9x10“9 erg
cm“2 s“ ^ rising to ~ 36 per cent in epoch II (5.0 +10“9 erg
cm“2 s“1). The relative contributions of the 6.7-keV helium-
like Ka iron fine for the two epochs and the two models were found to be 0.9 and 1.1 per cent (TB + BB + L) and 2.8 and 4.0 per cent (PLEC + BB + L) for epochs I and II respec- tively.
3.2 Temporal variation and other aspects
The significance of the 685-s period in the two epochs could have relevance to the model produced for this binary system.
There is good evidence that, in epoch I, the 685-s period has at least half the significance of the epoch II data, when the source was ~ 25 per cent brighter. In other words, the ampli- tude of the modulation in epoch I is rather smaller than for epoch II [this can be seen in fig. 3 of Sansom et al. (1989), in which epoch I is the top panel and epoch II is split between the second and third panels, although this was not explicitly stated in the text]. This was also found to be the case when Ginga observed XI820 - 303 in a high state in 1989 (Tan et al. 1991).
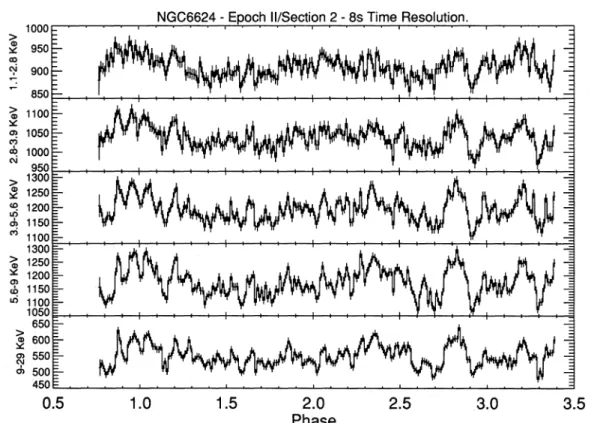
With regard to other aspects of the spectral variation with phase of the 685-s period, we agree with Sansom et al. (1989). Phase-resolved spectroscopy for these relatively short observations is dominated by short-term flaring episodes, with no clear underlying picture emerging. The majority of the X-ray dips seen are essentially energy-inde- pendent (even, possibly, showing an increased modulation at higher energies). This can be seen most easily by looking at Fig. 3, which shows one of the orbits (‘sections’) from epoch II in five energy bands. These data are not folded, but are shown at the correct relative phase for the ephemeris of Sansom et al. (1989). The primary dips occur at phases (/> ~
19 93MNRAS.2 62. .511E 516 E. N. Ercan et al 1 10 Energy (KeV)
Figure 2. The best-fitting spectral models of XI820 - 303: (a) and (b) are (TB + BB + L) fits to epochs I and II, respectively, while (c) and (d) are (PLEC + BB + L) fits to the same data. The lower panels of each plot show the model residuals.
Phase
Figure 3. Section 2 of epoch II, shown in five different energy bands, versus phase of the 685-s binary cycle. 1.6, ~ 2.Ó-2.7. However, this figure also shows the presence
of an ‘anomalous dip’ at phase (f> ~ 2.9, and possibly others at a lower significance (e.g. (¡) -1.15, ~ 3.3). Incidentally, the dip at phase (/> ~ 26-2.1 clearly shows the presence of struc-
ture within it. This could be interpreted as multiple (shorter) dips, or central ‘spikes’ within certain dips. It is clear from this figure that XI820 - 303 is extremely variable, even from one binary cycle to the next.
19
93MNRAS.2
62.
.511E
4 DISCUSSION
These Ginga observations of XI820 - 303 show the source to have a luminosity of ~ 5.4 x 1037 erg s"1 in the first epoch
(epoch I) of our observations and ~6.7xl037 erg s-1 in
epoch II of our observations, assuming a distance of 6.4 kpc to the source (see e.g. Vacca, Lewin & van Paradijs 1986, and references therein). Our epoch I luminosity is consistent with the OSO-7 observations of the source, and a factor of ~ 3 higher than the Uhuru results. It also agrees with the Tenma observations of the source (Hirano et al. 1987). In ANS observations, X1820-303 was found to exhibit an anti- correlation between the source luminosity and temperature on long time-scales (Parsignault & Grindlay 1978). However, we did not observe such an anticorrelation in our observa- tions; in fact, our results reveal that the source exhibits a correlation between its luminosity and bremsstrahlung tem- perature.
XI820 — 303 was observed with EXOSAT on four occa- sions by Stella et al. (1987a, b). Our spectral parameters are not in very good agreement with theirs. In the high state of X1820-303 their value of a ( = r-l), the energy index, was -0.7, and the cut-off energy was Ec ~ 12 keV, while
kThh was given as -2.0 keV. Our values are a ~ 1.1-1.2,
Ec - 5.0-6.5 keV and kTbh - 2.2-2.5 keV (epochs I-II). Our
Nh value is a factor of - 3 higher than their best-fitting value
(see Tables 3 and 5).
Stella et al. (1987b) also argued that the spectrum of X1820- 303 when in its high state is similar to that of the bright bulge sources, with a blackbody component contribut- ing - 25 per cent of the total luminosity. This is in very good agreement with the present Ginga result of 18-36 per cent (for epochs I-II). In Stella et al.’s low-state data the black- body component is still present, and contributes ~ 50 per cent of the total luminosity. Since the total X-ray luminosity of X1820-303 changes from 2-6 x lO37 (<7kpc/6.4)2 erg s_1,
this implies that the blackbody component must increase its luminosity by - 50 per cent from the low to the high state.
It has been argued that the X-ray spectra of low-mass X-ray binaries do not depend strongly on the inclination of the system, suggesting that the central X-ray emission region is relatively spherical (White 1986). It has also been pointed out that the X-ray spectra of many low-mass X-ray binaries cannot be adequately described by a single spectral function, and that more complex two-component spectral models should be used (Swank & Serlemitsos 1985). Two-com- ponent models of various types, generally involving a black- body together with another component with an exponential cut-off (e.g. bremsstrahlung, blackbody or cut-off power law), have provided acceptable fits in most cases (see e.g. White & Mason 1985), and these two components have been identi- fied with two physically distinct sites of X-ray emission: namely the neutron star surface and the inner accretion disc region (see e.g. Mitsuda et al. 1984; White et al. 1986).
It has been pointed out by Vacca et al. (1986), however, that the two-component models used so far may be success- ful because they include an appropriate number of free para- meters. Furthermore, theoretical understanding of both the boundary layer and the inner disc is extremely poor. In fact, the results are very dependent on the magnitude and behavi- our of the viscosity, which we can only roughly estimate.
Theoretical work on Comptonized bremsstrahlung
Ginga observations of XI820 — 303 517 spectra by Chapline & Stevens (1973) was found to be a good representation of the observed spectra of ScoX-1, GX17 + 2, GX9 + 9 and GX349 + 2 from Ariel V data modelled by Lamb & Sanford (1979). However, this spectral model has never been given a convincing physical basis. Evidence for Comptonization in GX9 + 9 was found from earlier observations of the source by Ariel V (Ercan & Cruise 1984), with an optical depth of ~1. More recently, several models stressing the importance of Comptonization for the spectral and temporal behaviour of low-mass X-ray binaries have been developed by Schultz & Wijers (1989), Lamb (1989), Ponman, Foster and Ross (1990), and Damen et al. (1990). All these models try to develop more physically reahstic models than the usual ‘two-component’ interpreta- tions.
In the light of these arguments, it seems that on physical grounds the (PLEC + BB + L) model provides a more satisfactory explanation of the observed spectrum of X1820-303. This model would then suggest the existence of a scattering cloud surrounding the neutron star with a Thomson optical depth t of ~ 7, using the relation between r, F and Ec given by Sunyaev & Titarchuk (1980). For a
spherical geometry, we have / 2\2 mec2 Jt2 1
\r+3/_2ÊrT[(r+-^)2-|]’
where F is the photon spectral index, Ec is the cut-off energy
and mec2 is the electron rest energy. Ponman et al. (1990)
found t~ 7.6 ±0.6 when fitting their scattering envelope model to the EXOSAT high-state spectrum of XI820 - 303, in very good agreement with our result.
To test whether the inner accretion flow is geometrically thick in quiescence, we have followed the formalism described in Damen et al. (1990). For a cosmic-abundance plasma and a neutron star, a Thomson optical depth of ~ 0.6 is found for our observed range of L/LE [where LE is the
Eddington luminosity, LE ~ 2.5 x 1038 erg s-1 (Haberl et al.
1987)]. This value of r is much less than the value r~7 found above. Since a burst of radiation reduces the flow speed without changing the accretion rate, the optical depth should be even greater during bursts than the value of r~ 7 observed. Such thick flow is not permitted by the present observation. Using the EXOSAT spectral results for the low state (i.e. T~2.5, Ec>30 keV: Stella et al. 1987b, and
references therein), we can set an upper limit for the Thomson optical depth of r<2. This may demonstrate the existence of a region which is rather tenuous and not very optically thick in absorption. It could be an inner disc or boundary layer, or both. Analyses of X-ray bursts seen in the low state by EXOSAT also show evidence of Comptoniza- tion with a similar Thomson optical depth to ours (Titar- chuk, private communication).
According to our spectral models, in the 1.1-2.8 keV energy band the PLEC component provides ~ 95 per cent of the total emitted flux. As mentioned above, this spectral component can be attributed to the Comptonized emission from the scattering cloud, having an inner radius of ~ 50 km and an outer radius >600 km (see Damen et al. 1990, and references therein). Hence the dips seen in this energy band must be caused by structure further out in the accretion disc, perhaps the raised rim of the disc.
19
93MNRAS.2
62.
.511E
518 E. N. Ercan et al
Since the dips are (largely) energy-independent, it may be assumed that the dips are produced by obscuration of the accretion disc. Sawada, Mitsuda & Hachisu (1986) per- formed two-dimensional hydrodynamic calculations of Roche lobe overflow in a semidetached binary system. They reported that, in the absence of viscosity, two or three (depending on the conditions) spiral-shaped shocks are formed in the accretion disc due to the gravitational influ- ence of the mass-donating star. Furthermore, Whitehurst & King (1989) suggested that the transport of angular momentum outwards in a disc results in a build-up of material at the edge of the disc, forming a thick rim. It is con- ceivable that gravitationally induced shocks in this rim cause the height of the rim to vary with azimuthal angle, resulting in the dips and the quasi-sinusoidal X-ray orbital modulations that we see in many low-mass X-ray binaries, including X1820-303.
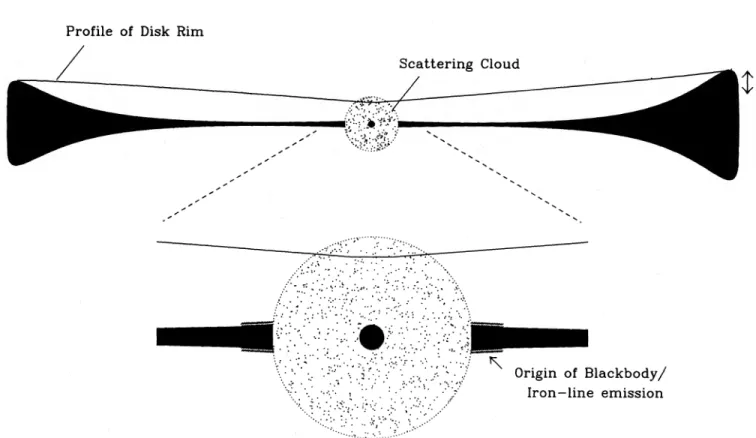
A schematic picture of how X1820- 303 might look is shown in Fig. 4. For dips to be produced, the line of sight must be below some critical angle that depends on the height of the obscuring structure and its distance from the centre of the neutron star. As previously mentioned, at least some of the dips show a negative energy dependence (an example is the dip at ^ ~ 2.6-2.7 shown in Fig. 3, which is much more prominent in the higher energy bands). Since we associate the harder (blackbody) spectral component with the inner part of the accretion disc (see Lamb 1989), it is possible for certain disc structures to obscure this inner disc region with- out obscuring very much of the scattering cloud. This pro- vides a natural explanation of the dips that show negative energy dependence. To verify this hypothesis, we have
constructed a ‘quiescence’ disc + cloud spectrum from (j> - 1.8-2.5 (Fig. 3), and a ‘dip’ spectrum from (/> ~ 2.55-2.75. By taking the difference between these two spectra, we obtain a spectrum of the obscured emission region. This spectrum is shown in Fig. 5, where we have fitted the emission with a blackbody + absorption model. The blackbody component was found to have a kThb of ~ 2.3 ± 0.2 keV, in very good
agreement with the ‘quiescent blackbody’ component. (The slight excess in the lowest energy channels may indicate that a small fraction of the softer scattering cloud component was also obscured.)
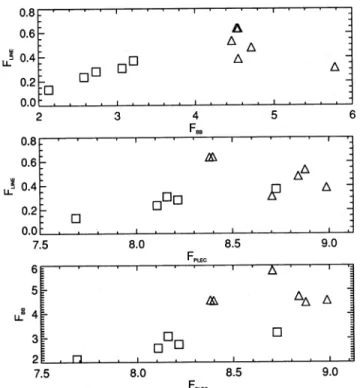
From the (PLEC + BB + L) spectral model fits to the indi- vidual sections (Table 5), it is possible to study the correla- tions between the blackbody flux, the power-law flux and the iron-line flux (FBB, FPLEC and FLINE respectively). These are
displayed in Fig. 6, where the squares (□) represent epoch I and the triangles (a) represent epoch H. It is apparent that during epoch I there is a very good correlation between ^BB and FLiNE, although this does not appear to continue into
epoch n. Since we associate the blackbody flux with the inner accretion disc region, the correlation may indicate that the iron line is also produced in this region. This would confirm the suggestion of Kallman & White (1989) for the origin of the line emission. It is also worth noting that both the black- body and iron-line fluxes show a ~ three-fold increase, while the power-law component only shows a ^ 20 per cent increase. This is also suggestive of an association between the blackbody and line emission regions. Fig. 6(b) could suggest a correlation between FPLEC and FLINE. However, this could
just be caused by the apparent correlation shown in Fig. 6(c), where we see a good correlation between FBB and FPLEC.
Profile of Disk Rim
Figure 4. Schematic cross-section of XI820 - 303, showing the principal features of the system. The neutron star is surrounded by a scattering cloud that produces the Comptonized spectral component, while the blackbody component and iron-line emission originate in the inner region of the accretion disc. Structure in the rim of the disc is thought to cause the dips seen in the various light curves.
19
93MNRAS.2
62.
.511E
Figure 5. The ‘difference’ spectrum for the dip at 2.55-2.75 (shown in Fig. 3). The model fit (shown by the histogram) is a ~ 2.3- keV blackbody with a 1-20 keV flux of ~ 14 per cent of the ‘quies- cent’ blackbody flux. The lower panel shows the model residuals.
7.5 8.0 8.5 9.0 F PLEC
Figure 6. The 1-20 keV fluxes of the power law with exponential cut-off (PLEC), blackbody (BB) and 6.7-keV Fe-line (LINE) spec- tral components plotted against each other. The squares (□) are the epoch I sections, while the triangles (a) represent the epoch II data. This latter correlation may indicate that at least a part of the blackbody flux is reradiated emission caused by the illumina- tion of the disc by the scattering cloud.
Mitsuda (1989) presented Ginga results for the horizontal branch QPOs (23-40 Hz) from GX5-1 and the 6-Hz QPOs from six low-mass X-ray binary sources. The energy depend- ence of the 6-Hz QPO amphtude was also presented by Mitsuda (1989). Mitsuda found that the difference spectra between the maxima and minima of the QPOs have the appearance of a blackbody spectrum with a colour tempera- ture of about 2.2 keV for 6-Hz QPOs from all four sources
Ginga observations of XI820 - 303 519 (including XI820 - 303). This blackbody spectrum is similar to the flare spectra of the persistent emission which occurs on time-scales much longer than those of the QPOs. Further- more, Mitsuda claimed that their energy spectrum was simi- lar to the hard component of the persistent spectrum obtained from Tenma observations. In the fight of these results, Mitsuda (1989) argued that 6-Hz QPOs are related to the hard component of the energy spectrum. If the hard component is the emission from inside the inner edge of the optically thick accretion disc, then the 6-Hz QPOs are closely related to the emission from this region. Since the colour temperature of the emission is considered to remain almost constant throughout the observation, the QPOs should be attributed to the oscillations in the apparent size of the emission region. On the other hand, there may be some mechanism to keep the temperature of the blackbody emis- sion constant, like the existence of a local Eddington limit of the emission from the vicinity of the neutron star (Mitsuda 1989). Both EXOSAT data (taken when the source was in a low state) and our observations (from a high state) suggested a blackbody temperature of 2.2 keV. This result may confirm the mechanism suggested by Mitsuda.
The detection of an ~ 11-min modulation in our epoch II observations, together with the less-significant modulation in the first epoch, is a very important observation. It clearly indicates that, whatever geometrical alignment causes the modulation, it is dependent on the source luminosity and hence the mass accretion rate. Hence the fine of sight to XI820-303 is very close to some critical angle of inci- dence; if this angle were a little larger then no modulation would be seen, while if it were a little lower then the modula- tion would be an essential constant feature of the fight curve. 5 CONCLUSION
These observations demonstrate the usefulness, in the study of X-ray spectra, of instruments with large collecting areas and low backgrounds, such as the LAC on Ginga.
We have found that the Ginga LAC spectral data from X1820-303 are best fitted by a two-component spectral model, and on physical grounds we have selected the model including a power law with exponential cut-off and a black- body (plus a 6.7-keV iron fine). The blackbody component contributes ~ 26 per cent in epoch I and ~ 36 per cent in epoch II, which is about 25 per cent brighter in mean count rate. Matching the rise seen in the blackbody component, the iron-fine flux also shows an increase in importance, from ~ 2.6 to - 4.0 per cent of the total flux. We have found positive evidence for the presence of a scattering cloud surrounding the neutron star, with a Thomson optical depth of ~ 7.
The detection of ~ 685-s modulation in our epoch II data, and its relatively lower significance in epoch I, clearly indi- cates that, whatever geometrical alignment gives rise to the observed modulation, it is dependent on the source lumino- sity and hence on the mass accretion rate. It also indicates that our line-of-sight viewing direction is close to some ‘criti- cal’ angle.
ACKNOWLEDGMENTS
We are grateful to all who are involved in the Ginga (Astro- C) mission at ISAS, especially Professors Makino and
19
93MNRAS.2
62.
.511E
520 K N. Ercan et al
Tanaka. We thank M. A. Alpar for his critical reading of the manuscript, and G. Branduardi-Raymont for her valuable comments. ENE and KS particularly thank Dr G. E. Bromage and Professor J. E. Harries for hospitahty at RAL during their stay. This work is partially supported by the Research Foundation of Bogaziçi University and the Science and Engineering Research Council (SERC) of the UK. We also acknowledge the support provided in terms of both soft- ware and hardware by the Starlink Project which is funded by the UK SERC.
REFERENCES
Ayasli S., Joss P. C, 1982, ApJ, 256,637 Chapline G., Stevens J., 1973, ApJ, 184,1041
Clark G. W., Li F. K., Cañizares C, Hayakawa S., Jemigan G., Lewin W. H. G., 1977, MNRAS, 179,651
Damen E., Wijers R. A. M. J., van Paradijs J., Penninx W., Ooster- broek T, Lewin W. H. G., Jansen E, 1990, A&A, 223,121 Dotani T., Mitsuda K., Makishima K., Jones M. H., 1989, PASJ, 41,
577
Ercan N. E., Cruise A. M., 1984, MNRAS, 209,271
Giacconi R., Murray S., Gursky H., Kellogg E., Schreier E., Matilsky T, Koch D., Tananbaum H., 1974, ApJS, 27,37
Grindlay J., Gursky H., Schnopper H., Parsignault D. R., Heise J., Brinkman A. C, Schrijver J., 1976, ApJ, 205, LI27
Haberl E, Stella L., White N. E., Priedhorsky W., Gottwald M., 1987, ApJ, 314,266
Hasinger G., van der Klis M., 1989, A&A, 225,79
Hirano T., Hayakawa S., Nagase E, Masai K., Mitsuda K., 1987, PASJ, 39,619
Kallman T, White N. E, 1989, ApJ, 341,955
Kelley R. L., Christian D. J., Schoelkopf R. J., Swank J. H., 1989, in Hunt J., Battrick B., eds, Proc. 23rd ESLAB Symp., Two Topics in X-ray Astronomy, Vol. 1. ESA Publications Division, Noordwijk, p. 459
Lamb F. K., 1989, in Hunt J., Battrick B., eds, Proc. 23rd ESLAB Symp., Two Topics in X-ray Astronomy, ESA SP-296. ESA Publications Division, Noordwijk, p. 215
Lamb R, Sanford P. W, 1979, MNRAS, 188,555 Lampton M., Margon B., Bowyer S., MNRAS, 208,177
Lewin W. H. G., Joss P. C, 1983, in Lewin W. H. G., van der Heuvel
E. P. J., eds, Accretion Driven Stellar X-ray Sources. Cambridge University Press, p. 41
Lüler M. H., Carney B. W, 1978, ApJ, 224,383
Makino E & the Astro-C team, 1987, Astrophys. Lett. Commun., 25,223
Mitsuda K., 1989, in Hunt J., Battrick B., eds, Proc. 23rd ESLAB Symp., Two Topics in X-ray Astronomy, ESA SP-296. ESA Publications Division, Noordwijk, p. 197
Mitsuda K. et al., 1984, PASJ, 36,741
Morgan E. H., Remillard R. A., Garcia M. R., 1988, ApJ, 324,851 Morrison R., McCammon D., 1983, ApJ, 270,119
Parsignault D. R., Grindlay J. E., 1978, ApJ, 225,970
Ponman T. J., Foster A. J., Ross R. R., 1990, MNRAS, 246,287 Priedhorsky W, Terrell J., 1984, ApJ, 284, LI7
Sansom A. E., Watson M. G., Makishima K., Dotani T., 1989, PASJ, 41,591
Sawada K., Mitsuda T., Hachisu I., 1986, MNRAS, 221,679 Schultz N. S., Wijers R. A., 1989, in Hunt J., Battrick B., eds, Proc.
23rd ESLAB Symp., Two Topics in X-ray Astronomy, ESA SP- 296. ESA Publications Division, Noordwijk, p. 601
Smale A. R, Mason K. O., Mukai K., 1987, MNRAS, 225, 7p Stella L., Priedhorsky W, White N. E., 1987a, ApJ, 312, L17 Stella L., White N. E., Priedhorsky W, 1987b, ApJ, 315, L49 Sunyaev R. A., Titarchuk L. G., 1980, A&A, 86,121
Swank J. H., Serlemitsos P. J., 1985, in Tanaka, Y., Lewin W. H. G., eds, Japan-US Seminar on Galactic and Extragalactic Compact X-ray Sources. Institute of Space and Astronautical Science, p. 175
Tan J. et al, 1991, ApJ, 374,291 Turner M. J. L. et al.,1989, PASJ, 41,345
Vacca W. D., Lewin W. H. G., van Paradijs J., 1986, MNRAS, 220, 339
van der Klis M, 1989, ARA&A, 27,517
Webbink R. E, Rappaport S., Savonije G. J., 1983, ApJ, 270,678 White N. E., 1986, in Mason K. O., Watson M. G., White N. E., eds,
in The Physics of Accretion onto Compact X-ray Objects. Reidel, Dordrecht, p. 377
White N. E., Mason K. O., 1985, Space Sei. Rev., 40,167
White N. E., Peacock A., Hasinger G., Mason K. O., Manzo G., Taylor B. G., Branduardi-Raymont G., 1986, MNRAS, 218, 129
Whitehurst R., King A. R., 1989, in Hunt J., Battrick B., eds, Proc. 23rd ESLAB Symp., Two Topics in X-ray Astronomy, ESA SP- 296. ESA Publications Division, Noordwijk, p. 127