Novel monoclonal antibodies detect Smad-interacting protein 1 (SIP1) in the
cytoplasm of human cells from multiple tumor tissue arrays
Emin Oztas
a,b, M. Ender Avci
a, Ayhan Ozcan
c, A. Emre Sayan
d,e, Eugene Tulchinsky
d, Tamer Yagci
a,⁎
aDepartment of Molecular Biology and Genetics, Bilkent University, Ankara, Turkey
bDepartment of Medical Histology, Gulhane Military Medical Academy, Ankara, Turkey c
Department of Pathology, Gulhane Military Medical Academy, Ankara, Turkey
d
CSMM dept, University of Leicester, Leicester, UK
e
Cancer Research UK Centre, Cancer Sciences Division, University of Southampton School of Medicine, Southampton, UK
a b s t r a c t
a r t i c l e i n f o
Article history:
Received 2 November 2009 and in revised form 24 May 2010 Available online 31 May 2010 Keywords:
SIP1/ZEB2 Multiple tissue arrays Immunohistochemistry Monoclonal antibodies
Smad-interacting protein 1 (SIP1, also known as ZEB2) represses the transcription of E-cadherin and mediates epithelial–mesenchymal transition in development and tumor metastasis. Due to the lack of human SIP1-specific antibodies, its expression in human tumor tissues has not been studied in detail by immunohistochemistry. Hence, we generated two anti-SIP1 monoclonal antibodies, clones 1C6 and 6E5, with IgG1 and IgG2a isotypes, respectively. The specificity of these antibodies was shown by Western blotting studies using siRNA mediated downregulation of SIP1 and ZEB1 in a human osteosarcoma cell line. In the same context, we also compared them with 5 commercially available SIP1 antibodies. Antibody specificity was further verified in an inducible cell line system by immunofluorescence. By using both antibodies, we evaluated the tissue expression of SIP1 in paraffin-embedded tissue microarrays consisting of 22 normal and 101 tumoral tissues of kidney, colon, stomach, lung, esophagus, uterus, rectum, breast and liver. Interestingly, SIP1 predominantly displayed a cytoplasmic expression, while the nuclear localization of SIP1 was observed in only 6 cases. Strong expression of SIP1 was found in distal tubules of kidney, glandular epithelial cells of stomach and hepatocytes, implicating a co-expression of SIP1 and E-cadherin. Squamous epithelium of the esophagus and surface epithelium of colon and rectum were stained with moderate to weak intensity. Normal uterus, breast and lung tissues remained completely negative. By comparison with their normal tissues, we observed SIP1 overexpression in cancers of the kidney, breast, lung and uterus. However, SIP1 expression was found to be downregulated in tumors from colon, rectum, esophagus, liver and stomach tissues. Finally we did nuclear/cytoplasmic fractionation in 3 carcinoma cell lines and detected SIP1 in both fractions, nucleus being the dominant one. To our best knowledge, this is the first comprehensive immunohistochemical study of the expression of SIP1 in a series of human cancers. Our finding that SIP1 is not exclusively localized to nucleus suggests that the subcellular localization of SIP1 is regulated in normal and tumor tissues. These novel monoclonal antibodies may help elucidate the role of SIP1 in tumor development.
© 2010 Elsevier Inc. All rights reserved.
Introduction
Smad-interacting protein 1 (SIP1, also known as ZEB2) encoded by ZFHX1B is a member of ZEB family of transcription factors. The protein contains a central homeodomain, CtBP-binding and Smad-interacting domains and two zincfinger clusters each at either end (Remacle et al., 1999; Verschueren et al., 1999). SIP1 directly binds to bipartite E-boxes on the promoters of different targets by means of its zincfinger domains and mediates transcriptional repression (Verschueren et al., 1999). One of these targets is CDH1, the gene encoding for the epithelial adherens
junction protein E-cadherin, whose transcriptional downregulation induces epithelial-to-mesenchymal transition (EMT) in developmental processes and during tumor cell invasion and metastasis (Comijn et al., 2001). Transcriptional repression is mediated through the association of SIP1 with the corepressor CtBP, however this interaction is dispensable at least for the attenuation of CDH1 transcription (Postigo et al., 2003; van Grunsven et al., 2003). Overexpression of SIP1 in epithelial cells has also been shown to downregulate constituents of cell–cell junctions other than E-cadherin (Vandewalle et al., 2005). Although binding of SIP1 to p300 or pCAF was proposed as a mechanism for transactivation and other transcriptional activators associated to SIP1 are yet to be determined, SIP1-mediated upregulation of EMT and invasion related genes, such as vimentin and matrix metalloproteases, have been reported (Bindels et al., 2006; Miyoshi et al., 2004; Postigo et al., 2003).
⁎ Corresponding author. Bilkent University, Faculty of Science, Department of Molecular Biology and Genetics, 06800, Bilkent-ANKARA, Turkey.
E-mail address:[email protected](T. Yagci).
0014-4800/$– see front matter © 2010 Elsevier Inc. All rights reserved. doi:10.1016/j.yexmp.2010.05.010
Contents lists available atScienceDirect
Experimental and Molecular Pathology
j o u r n a l h o m e p a g e : w w w. e l s e v i e r. c o m / l o c a t e / y e x m pDespite the overwhelming evidence that SIP1 induces EMT phenotype, its role in tumorigenesis was ill-defined. In fact, SIP1 was originally identified as a binding partner of R-Smads, and shown to be part of the TGF-β pathway, which is frequently involved in carcinogen-esis (Verschueren et al., 1999). hTERT repression in breast cancer cells was partly mediated by SIP1 in a TGF-β dependent manner (Lin and Elledge, 2003). Also, analysis of senescence arrest of clonal hepatocel-lular carcinoma cells revealed SIP1 as a mediator of hTERT repression (Ozturk et al., 2006). Impaired G1/S progression was observed upon repression of cyclin D1 by SIP1 (Mejlvang et al., 2007). SIP1 was also shown to contribute to tumorigenesis in a transgenic mouse model of lymphoma by retroviral tagging (Mikkers et al., 2002). The differential expression of SIP1 has been described, mostly by RT-PCR, in several human tumors due to the lack of human SIP1-specific antibodies. E-cadherin downregulation was associated to increased SIP1 expression in intestinal type gastric carcinoma but not in diffuse type gastric carcinoma (Rosivatz et al., 2002). Elevated SIP1 expression correlated inversely with E-cadherin in advanced stages of pancreatic tumors (Imamichi et al., 2007). Surprisingly, SIP1 and E-cadherin expression were positively correlated in malignant mesothelioma (Sivertsen et al., 2006). In the esophagus, differential expression of SIP1 was observed during keratinocyte differentiation. Only stem cell containing basal cells, but not parabasal cells and keratinocytes expressed SIP1. Consistent with this, SIP1 transcripts were present in all studied esophageal
carcinoma cases (Isohata et al., 2009). High SIP1/E-cadherin ratio correlated with metastatic disease and poor patient survival in breast and ovarian carcinomas (Elloul et al., 2005). Elevated SIP1 transcripts were observed in von Hippel–Lindau-null renal cell carcinomas in a hypoxia-inducible factor 1 alpha (HIF1α)-dependent manner ( Krish-namachary et al., 2006). Immunohistochemical analysis of ovarian tumors revealed a stepwise increase of SIP1 from benign to borderline to malignant tumors (Yoshida et al., 2009). In oral squamous cell carcinoma, SIP1 was immunohistochemically detected in a relatively low proportion of tumors and its expression correlated with poor prognosis (Maeda et al., 2005). In a previous study, we have found that SIP1 was overexpressed in a series of bladder cancers. Its expression was found to be an independent prognostic factor in bladder cancers and positively stained cases correlated with poor therapeutical outcome (Sayan et al., 2009). With the exception of a few and as described above, most of the expression studies of SIP1 were done using RT-PCR technique, but SIP1protein levels have been shown to be tightly regulated by post-transcriptional mechanisms. For instance, Pc2-mediated sumoylation of SIP1 affects the transcriptional regulation of E-cadherin (Long et al., 2005). SIP1 has been identified as a direct target of miR-200 family and miR-205 (Gregory et al., 2008; Park et al., 2008). In this study, we generated 2 new monoclonal antibodies (MAb) against the N-terminus of SIP1 protein and validated their specificity by specifically downregulating SIP1 protein, and the other ZFHX1
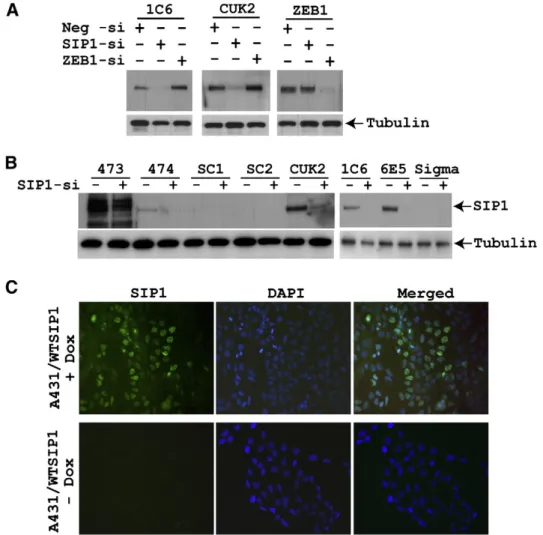
Fig. 1. Endogenous and induced expression of SIP1 is detected by monoclonal antibodies 1C6 and 6E5. (A) HOS2 cells were transfected with control (Neg-si), SIP1 (SIP1-si) and ZEB1 (ZEB1-si) siRNAs. Proteins were extracted 48 h after transfection and western blot was performed with the indicated antibodies. SIP1 specific band was detected with 1C6 and CUK antibodies. Both SIP1 antibodies did not recognize ZEB1 and can detect endogenous SIP1 efficiently. (B) Control siRNA and SIP1 siRNA transfected HOS2 cell lysates were used to compare the new SIP1 MAbs with 5 different commercial antibodies. The results from polyclonal antibodies (goat or rabbit anti-SIP1) and monoclonal antibodies (mouse anti-SIP1) are presented in left and right panels, respectively. With the exception of 474, all other commercial antibodies were either weak or non-specific. (C) A431/WTSIP1 cells maintained in 2μg doxycycline for 24 h and stained with 6E5 MAb displayed nuclear SIP1 expression (first row), whereas no staining was observed in uninduced cells with the same antibody (second row).
family member protein ZEB1, by siRNA in endogenous levels. Then, by using these antibodies we explored the expression pattern of SIP1 in human tumor cell lines and in a variety of tissues. We detected predominantly cytoplasmic but also nuclear SIP1 staining. Finally, subcellular fractionation of cell lines showed that SIP1 protein can be present in the cytoplasm and nucleus of multiple carcinoma cell lines. To our knowledge, this study is thefirst description of SIP1 protein expression in a multiple tumor tissue arrays.
Materials and methods
Cell lines, tissues and siRNA transfections
Wild-type mouse SIP1 expressing squamous epidermoid carcino-ma cell line A431/WTSIP1 with Tet-on doxycycline-inducible SIP1 expression was previously described (Mejlvang et al., 2007). Osteosarcoma cell line HOS2, hepatocellular carcinoma cell line SK-HEP-1 and colorectal carcinoma cell lines SW480 and SW620 were maintained in DMEM supplemented with 10% fetal bovine serum, 100 IU penicillin, 100μg streptomycin and nonessential amino acids. Multiple Tumor Tissue arrays were purchased from BioChain Institute, Inc. (Hayward, CA). siRNAs targeting ZEB1 (Sayan et al., 2009) and SIP1 (S102364277, Qiagen, Hilden, Germany) were transfected using Lipofectamine 2000 reagent (Invitrogen, Carlsbad, CA). Cells were collected 48 h after transfection and processed for Western blotting. Recombinant SIP1 production
Thefirst 360 amino acid part coding region of SIP1 (ZEB2) cDNA was cloned into pET101/D (Invitrogen, Carlsbad, CA) vector with an N-terminal 6-histidine tag. Recombinant protein was expressed in Escherichia coli (BL21) and purified under denaturing conditions using Ni–NTA resin (Qiagen, Hilden, Germany). Purified protein then was refolded and buffer exchanged to phosphate buffered saline (PBS) using NAP buffer exchange columns (Amersham, Piscataway, NJ). Finally, pure and folded recombinant protein was concentrated (0.5–1 mg/ml) using Centripreps (Millipore, Billerica, MA).
Production of monoclonal antibodies
Recombinant SIP1 protein was injected into the peritoneal cavity of 8- to 10-week-old BALB/c mice at 3 week intervals. During the immunization period, antibody titer of mice sera was evaluated by indirect ELISA. Briefly, ELISA plates were coated by 100 ng of recombinant SIP1 protein in carbonate buffer (pH: 9.6). Serially diluted mice sera were assessed for their immunoreactivity with SIP1 protein. Alkaline phosphatase conjugated goat anti-mouse IgG (Sigma-Aldrich, St. Louis, MO) was used as secondary antibody. Colorimetric reaction generated upon addition of the substrate para-nitrophenyl-phosphate (Sigma-Aldrich, St. Louis, MO) was measured at A405in an automated
plate reader (Biotek Instruments, Winooski, UT). Three days after the final boost, fusion of mouse splenocytes and SP2/0 myeloma cells was performed as previously described (Celikkaya et al., 2007). Hybridoma supernatants were screened by aforementioned indirect ELISA, and hybridomas secreting anti-SIP1 antibodies were subjected to single cell subcloning. Antibody isotype was determined by ImmunoPure Mono-clonal Antibody Isotyping Kit (Pierce, Rockford, IL) according to manufacturer's instructions.
Western blotting
Total cell lysates from HOS2, SK-HEP-1, SW480 and SW620 cell lines were prepared in NP-40 lysis buffer [50 mM Tris–HCl pH 8.0, 150 mM NaCl, 1% Non-idet P40 (v/v) and a cocktail of EDTA-free protease inhibitors (Roche Diagnostics, Mannheim, Germany)] or by direct lysis in 2X Laemmli buffer. Nuclear and cytosolic protein
fractions were prepared by NE-PER® Nuclear and Cytoplasmic Extraction Reagents (Pierce, Rockford, IL) according to manufacturer's instructions. Protein content was measured by Bradford or BCA assay. Equalized lysates were run on 8% SDS-PAGE and then transferred onto polyvinylidene fluoride (PVDF) membranes by using semi-dry transfer apparatus (Bio-Rad, Hercules, CA). 1C6 and 6E5 hybridoma supernatants were used as primary antibody. Other antibodies used in this study are from Bethyl Labs [473 473A) and 474 (A302-474A), 1:500; Montgomery, TX], Santa Cruz [SC1 (sc-48789) and SC2 (sc-18392), 1:500; Santa Cruz, CA] and Sigma (WH0009839M1, 1:500; Sigma-Aldrich, St. Louis, MO) for SIP1 immunodetection and Santa Cruz (sc-25388,) for ZEB1 immunodetection. Rabbit polyclonal SIP1 antibody (CUK2) was previously described (Sayan et al., 2009). Horseradish peroxidase (HRP)-conjugated anti-mouse, anti-rabbit IgG or anti-goat (Sigma-Aldrich, St. Louis, MO) were used as secondary antibodies at 1:5000 dilution. Protein bands were visual-ized using Super Signal West Dura or Femto chemiluminescent substrate (Pierce, Rockford, IL).
Quantitative real-time PCR
SIP1 mRNA expression in colon cancer cell lines SW620, SW480 and hepatocellular carcinoma cell line SK-HEP-1 was determined by quantitative real-time PCR as described previously (Avci et al., 2008). The expression of SIP1 in cell lines was measured using ΔΔCt method and normalized to GAPDH gene. The threshold cycle of SIP1 cDNA in SW480 cell line, which showed the lowest expression was set to 1 and relative expression values were plotted as fold changes.
Immunofluorescence
A431/WTSIP1 cells were grown on cover slips in 6 well plates and induced with doxycycline (2μg/ml) for 24 h. PBS was used in all washing
Table 1
Immunohistochemistry results of SIP1 expression in human tissues. Tissue (n = 123) SIP1 expression
Cytoplasm Nucleus SIP1-positive structure Kidney
Tumor (n = 18) +++ (17) − Tumoral cells Normal (n = 4) ++ (4) − Proximal–distal tubules Lung
Tumor (n = 14) + (10) − Tumoral cells Normal (n = 3) − (0) − Surfactant ++(3) Breast
Tumor (n = 9) + (5) − Tumoral cells Normal (n = 2) − (0) − − Uterus
Tumor (n = 12) + (5) − Tumoral cells Normal (n = 3) − (0) − − Liver
Tumor (n = 9) ++ (9) − Tumoral cells Normal (n = 2) +++ (2) − Hepatocytes Stomach
Tumor (n = 9) + (4) − Tumoral cells Normal (n = 1) +++ (1) − Glandular cells Colon
Tumor (n = 12) + (4) − Tumoral cells Normal (n = 4) ++ (4) + (4) Surface epithelium Rectum
Tumor (n = 9) + (7) ++ (1) Tumoral cells Normal (n = 1) ++ (1) ++ (1) Surface epithelium Esophagus
Tumor (n = 9) + (5) − Tumoral cells Normal (n = 2) ++ (2) − Squamous epithelium Mean staining intensities expressed as (−): negative, +: weak, ++: moderate, +++: strong. Numbers in parentheses represent positively stained cases.
steps. Cells werefixed in 2% paraformaldehyde in PBS and permeabilized in PBS containing 0.3% triton X-100. After blocking with 2% Bovine Serum Albumin (BSA) in PBS, cells were incubated for 2 h at room temperature with hybridoma supernatants. Alexafluor 488-conjugated anti-mouse IgG (Invitrogen, Carlsbad, CA) was used as secondary antibody at 1:200 dilution. Nuclei counterstaining was performed with 4 ′,6-diamidino-2-phenylindole (DAPI); cover slips were mounted on glass slides and examined under fluorescent microscope (Zeiss GmbH, Germany). Merged images were produced by using AxioVision image processing software (Zeiss GmbH, Germany).
Immunohistochemistry
A total of 123 tissues spotted on three tissue arrays were stained twice by both 1C6 and 6E5 MAbs. Tissue arrays included sections from kidney (22: tumor 18, normal 4), lung (17: tumor 14, normal 3), colon (16: tumor 12, normal 4), uterus (15: tumor 12, normal 3), esophagus (11: tumor 9, normal 2), liver (11: tumor 9, normal 2), breast (11: tumor 9, normal 2), rectum (10: tumor 9, normal 1) and stomach (10: tumor 9, normal 1) tissues. Tissue array slides were deparaffinized first at 70 °C and then in xylene. After rehydration in graded alcohol series, glass slides were
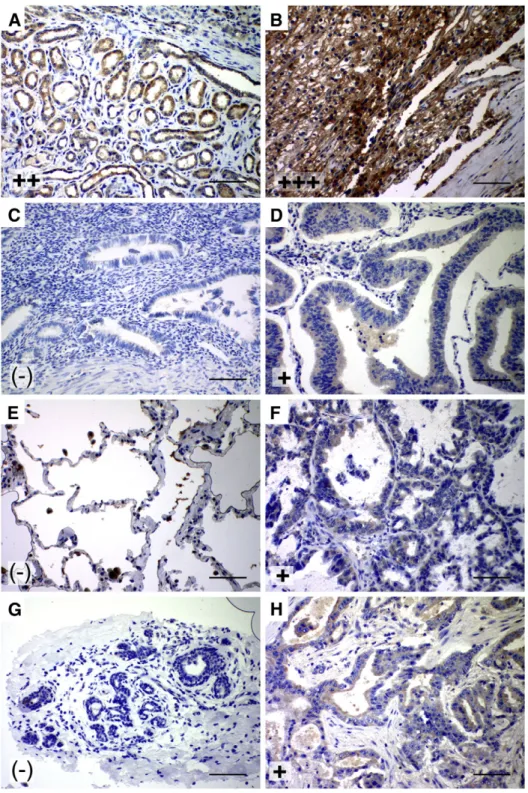
Fig. 2. Increased expression of SIP1 in kidney, lung, breast and uterus tumors. Representative photographs show increased SIP1 expression in tumors relative to their normal tissues as detected by immunohistochemistry performed by both antibodies. (A) Distal tubule staining in normal kidney, (B) clear cell renal carcinoma, (C) normal uterus, (D) adenocarcinoma of the uterus, (E) normal lung with non specific surfactant staining, (F) squamous cell carcinoma of the lung, (G) normal breast, (H) breast ductal carcinoma. (−): negative, +: weak, ++: moderate, +++: strong staining intensity (scale bars: 50 µm).
immerged in 10 mM citrate buffer, pH 6.0 and transferred into microwave oven for 20 min for antigen retrieval. Endogenous peroxidase was blocked by incubation of slides in 3% H2O2for 30 min. PBS was used in
all washing steps. Tissue sections were incubated with hybridoma supernatants for 2 h, and after washing, universal staining kit (LabVision, Fremont, CA) was used according to manufacturer's recommendations. 3,3′-diaminobenzidine (DAB) was used as chromogen and the slides were counterstained using Mayer's hematoxylin. Stainings were performed in triplicate for both antibodies. The sections were evaluated by light microscopic examination and the intensity of immunostaining in each section was assessed independently by two observers (E.O and A.O). The intensity of total SIP1 staining on each sample was scored as previously described with a slight modification (Chen et al., 2006). Briefly the staining intensity was graded relatively based on the following scales: 0, 1, 2, and 3 for negative, weak, moderate and strong staining, respectively. An averaged score was reached as thefinal score for each tissue with multiple samples. According to thefinal immunostaining scores, the tissues were classified into four groups: negative group (score 0–0.40), weak staining group (score 0.5–1.4), moderate staining, group (scores 1.5–2.4), and strong staining group (scores 2.5–3). (−), (+), (++) and (+++) designations were used for these four groups, respectively. The staining in nuclei and cytoplasm was determined separately on each specimen.
Results
Monoclonal antibodies 1C6 and 6E5 detect both endogenous and overexpressed SIP1
Two MAbs, clones 1C6 and 6E5 were obtained by immunizing BALB/c mice with a partial human SIP1 recombinant protein (aa 1-360). The isotypes of antibodies were IgG2a and IgG1, respectively (data not shown). ZEB1 and SIP1 (ZEB2) are members of the zinc finger Homeobox 1 gene family. Among these 2 proteins, there is more than 45% overall protein homology which is much higher (up to 93% identity at C-terminal zinc finger cluster) in the functional domains (Vandewalle et al., 2009). Thus, as afirst step, we wanted to assess the specificity of the new antibodies by specifically knocking down ZEB1 and SIP1 proteins in HOS2 osteosarcoma cells. As shown in
Fig. 1A, endogenous SIP1 was specifically downregulated by SIP1
siRNA but not by ZEB1 siRNA and detected by 1C6 MAb. The authenticity of 1C6 immunoreactive band (190 kDa) is also confirmed by another SIP1 antibody (CUK2). None of the SIP1 antibodies detected ZEB1 and ZEB1 antibody did not detect SIP1 (Fig. 1A). As a second step, we wanted to test the specificity and strength of several other commercial SIP1 antibodies. We used control siRNA and SIP1 siRNA transfected HOS2 cell lysates to detect endogenous SIP1. With the exception of 474, which recognized endogenous SIP1 weakly, commercial polyclonal SIP antibodies were either very weak (SC1, SC2) or non-specific (473) (Fig. 1B, left panel). Also, when compared with another MAb (Sigma), only 1C6 and 6E5, but not the com-mercial one recognized SIP1 specifically (Fig. 1B, right panel). The specificity of these new SIP1 MAbs were also validated in the inducible cell line system A431 containing mouse WTSIP1. By using both antibodies in immunofluorescence assay, we detected nuclear expression of SIP1 in these cells maintained in the presence of doxycycline for 24 h (Fig. 1C). These results showed that the new SIP1 MAbs are specific and able to detect SIP1 in endogenous levels and when overexpressed.
Tissue expression of SIP1 is predominantly cytoplasmic
Next, the tissue expression pattern of SIP1 protein was analyzed by staining formalin-fixed and paraffin-embedded tissue arrays with MAbs 1C6 and 6E5. 22 normal and 101 tumor tissues were examined by immunohistochemistry and all samples displayed similar reactivity upon staining by both clones. The SIP1 immunostaining pattern of tissues was summarized in Table 1. No immunoreactivity was observed in tissue arrays stained with mouse IgG1 and IgG2a isotype control antibodies (data not shown).
The majority of tissues displayed cytoplasmic staining of SIP1 and nuclear expression of SIP1 was observed only in 6 cases consisting of one normal and one tumor tissues of rectum and four normal colon samples (Table 1).
Differential expression of SIP1 in human tumors
SIP1 is overexpressed in tumors of the kidney, lung, breast and uterus 1C6 and 6E5 antibodies stained both proximal and distal tubules of kidney, yet the reactivity of the latter was more intense. Compared to the tubular epithelium-restricted expression of SIP1 in normal kidney, SIP1 was extensively expressed in kidney tumors. Out of 18 tumors, 17 clear cell carcinomas displayed strong cytoplasmic staining with both antibodies (Fig. 2A–B), and one transitional cell carcinoma case remained negative. Relative to their normal tissues, which failed to display SIP1 expression, 71% of lung, 56% of breast and 42% of uterus tumors showed cytoplasmic SIP1 positivity, yet with a weak intensity (Fig. 2C–H).
Cytoplasmic SIP1 is downregulated in most of the human tumors The cytoplasm of all 9 hepatocellular carcinoma cases displayed a moderate intensity of SIP1 expression, which could not reach however the strong staining pattern of SIP1 in normal hepatocytes and tumor-adjacent cirrhotic tissues (Fig. 3A, B). Eight of nine stomach adenocarcinomas were weakly positive for SIP1 expression, a pattern far beyond the intense SIP1 staining of glandular cells of normal stomach (Fig. 3C, D). Apical crypt epithelia of 4 normal colon samples displayed cytoplasmic staining with both antibodies with moderate intensity, and a faint nuclear SIP1 expression was also observed in these cells. However, only 4 of 12 colon tumors were weakly positive for cytoplasmic SIP1 (Fig. 3E, F). In tissue arrays, only one normal rectum sample was available, and lumen-facing epithelial cells of this tissue were found to express SIP1 mainly in their nuclei and to a lesser extent in their cytoplasm. Irrespective of its cellular localization, SIP1 expression was of moderate to strong intensity in normal rectum. On the contrary, 78% of rectum tumors were stained, but with weak immunoreactivity (Fig. 3G, H). The dominant cytoplasmic staining pattern of these cancer tissues was accompanied by moderate nuclear staining in only one case, which was the tumor with most advanced stage among others (data not shown). Tumor cells of 5 squamous cell carcinoma of the esophagus expressed SIP1, yet with a weaker intensity than squamous epithelium of normal esophagus, which was stained with moderate intensity by both antibodies (Fig. 3I, J).
Cytoplasmic SIP1 is present in tumor cell lines
Cytoplasmic SIP1 expression in the majority of human carcinomas prompted us to validate this observation in two colon cancer cell lines (SW620 and SW480) and one hepatocellular carcinoma cell line
(SK-Fig. 3. Reduced expression of SIP1 in liver, stomach, colon, rectum and esophagus tumors. Photographs are representative from immunohistochemistry performed by both antibodies and show decreased SIP1 expression in tumors with respect to their normal tissues. (A) Normal liver, (B—right) hepatocellular carcinoma (HCC) of the liver and (B—left) the adjacent cirrhotic tissue, (C) normal stomach gland cells, (D) adenocarcinoma of the stomach, (E) normal colon surface epithelium, (F) adenocarcinoma of the colon, (G) normal rectum surface epithelium, (H) adenocarcinoma of the rectum, (I) normal esophagus squamous epithelium, (J) squamous cell carcinoma of the esophagus. +: weak, ++: moderate, +++: strong staining intensity (scale bars: 50 µm).
HEP-1). We did subcellular fractionation and analyzed the presence of SIP1 protein by Western blotting. A protein band with strong intensity at the expected size (190 kDa) of SIP1 was observed in the nuclear fraction of the invasive hepatocellular carcinoma cell line SK-HEP-1 (Fig. 4A). Weaker protein bands of the same size also appeared in the cytosolic fraction of SK-HEP-1, and in both cytosolic and nuclear fractions of SW620 and SW480 cells. However, SIP1 expression was barely detectable in total cell lysates. Besides, SIP1 antibody immunoreactive bands at about 120 kDa and lower molecular weights were also observed in the nuclear extracts and total cell lysates of all 3 cell lines (Fig. 4A). These results were in accordance with real-time quantitative PCR data in which SK-HEP-1 was the cell line with most abundant SIP1 transcript (Fig. 4B).
Overall, our results indicated that SIP1 was widely expressed in most normal human tissues that we examined, with moderate to strong intensities, and the overexpression of SIP1 was confined only to a restricted group of human tumors.
Discussion
SIP1 has been reportedly shown to mediate EMT and disease aggressiveness in human tumors (Comijn et al., 2001; Elloul et al., 2005). Several studies indicated increased levels of SIP1 transcripts in association with invasion and metastasis in cancers with advanced stages (Imamichi et al., 2007; Miyoshi et al., 2004). However, a comprehensive study on SIP1 protein expression in human normal and tumors tissues has not been performed. We produced two MAbs using the N-terminal 360 amino acids of human SIP1 protein as an antigen and assessed their immunoreactivity in cell lines and tissue arrays. As an initial study we downregulated SIP1 and the other ZFHX1 family member protein, ZEB1, by siRNA in an osteosarcoma derived cell line and compared the strength and specificity of the novel SIP1 antibodies along with 5 different commercial SIP1 antibodies. We found that 1C6 and 6E5 can detect endogenous SIP1,
but not ZEB1, in this system strongly and specifically. We also observed that, with the exception of Bethyl Labs 474 antibody, all other commercial SIP1 antibodies are weak or non-specific. Close homology between human and mouse SIP1 proteins allowed us to evaluate the specificity of novel SIP1 antibodies in overexpression studies. Immunofluorescence analysis of A431/WTSIP1 cells with Tet-on doxycycline-inducible wild-type mouse SIP1 expressiTet-on revealed nuclear localization of SIP1 in only doxycycline-induced cells. This result also suggests that 1C6 and 6E5 recognize epitopes shared in both human and mouse proteins.
Endogenous SIP1 expression was analyzed in HCC cell line SK-HEP-1 and colorectal cancer cell lines SW480 and SW620. SK-SK-HEP-1 is a well-known invasive hepatocellular carcinoma cell line (Lin et al., 1998); SW480 and SW620 cell lines were established from the primary and metastatic tumors of the same patient, respectively (Leibovitz et al., 1976). Consistent with the role of SIP1 in inducing EMT phenotype, we found higher SIP1 transcript levels in SW620 and SK-HEP-1 cells compared to SW480 cell line. SIP1 expression analysis in western blot and qRT-PCR was almost consistent with a basal expression in SW620 and SW480, and an apparent upregulation in SK-HEP-1. Although there was a ∼15 fold SIP1 overexpression in metastatic SW620 cells when compared to SW480, the significance of this difference is questionable given the SIP1expression in SK-HEP-1 in thousands scale. Moreover, Western blotting revealed protein bands other than the expected 190 kDa size of SIP1 protein. In fact, a comprehensive analysis through human and mouse tissues revealed multiple transcripts of SIP1 in both species (Bassez et al., 2004). Taken together with the immunofluorescence data, these results suggest that SIP1 protein expression is tightly regulated, and may also indicate the existence of alternative SIP1 transcripts. However, at this point, we cannot exclude the possibility of non-specific signal or protein degradation for the aforementioned protein bands with lower molecular weights.
In contrast to nucleus-restricted expression of SIP1 in A431 Sip1 inducible system, most of the analyzed tissues displayed cytoplasmic protein expression. One explanation might be that while cell lines are grown in isolation in culture, tissues are subject to signals from their neighboring cells that may regulate intracellular SIP1 localization. Additionally, cellular stress induced by continuous culture of cell lines may affect the intracellular SIP1 destination. Consistent with our immunohistochemistry findings, a recent report also indicated cytoplasmic expression of SIP1 in ovarian tumors (Yoshida et al., 2009). Strong SIP1 expression in normal epithelial cells including hepatocytes, kidney tubules, stomach glandular epithelium and colon surface epithelium suggests the co-existence of E-cadherin and SIP1. Moreover, SIP1 appears to be prevented from translocating into nucleus in these tissues. It is therefore plausible to state that, unlike ZEB1, SIP1 and E-cadherin expression is not necessarily mutually exclusive. Among the analyzed tissues, most of the normal tissues expressed SIP1 from moderate to strong intensity, and we found SIP1 overexpression only in kidney, breast, lung and uterus tumors. On one hand, this differential expression may suggest a protective role for SIP1 against tumorigenesis. In fact, SIP1 was shown to directly repress cyclin D1 (Mejlvang et al., 2007). Also, induced expression of SIP1 was reported to be partly responsible for hTERT repression in hepatocel-lular carcinoma cells (Ozturk et al., 2006). On the other hand, SIP1 may be implicated in tumor development irrespective of its role in inducing EMT. In accordance with our results that SIP1 was upregulated in some tumors, we recently showed that SIP1 protects cancer cells from DNA damage-induced apoptosis (Sayan et al., 2009). Also, SIP1 takes part in the TGF-β pathway and the effects of TGF-β on cells are variable and depend on many factors including cell type and physiological state of tissues (Massague, 2008; Postigo, 2003).
Given the functional role of SIP1 as a transcriptional repressor, this and aforementioned studies suggest additional levels of regulation on SIP1 activity in tumors in a tissue and/or context-dependent manner.
Fig. 4. SIP1 protein is present in nucleus and cytoplasm of carcinoma cell lines. (A) Western blotting performed with clone 1C6 shows strong SIP1 expression at 190 kDa in the nuclear fraction of SK-HEP-1 cells, yet the antibody also detects bands with lower molecular weight proteins in nuclear (N) and total cell lysates (T) of all 3 cell lines. SIP1 expression is more apparent in the cytoplasmic (C) but not nuclear extracts of SW480 and SW620 cells. SK-HEP-1 cells also contain similar levels of cytoplasmic SIP1. (B) Quantification of SIP1 transcripts indicates the highest SIP1 expression in SK-HEP-1 cell line. SIP1 transcript levels in SK-HEP-1 and SW620 cells are represented as fold changes with respect to SW480 reference cell line.
Downstream to TGF-β signaling, ZEB1 and SIP1 regulate transcription of target genes in conjunction with SMADs and CtBPs. ZEB1 and SIP1 were shown to have opposing effects on transcriptional regulation (Postigo, 2003). A feedback mechanism was described in which ZEB1 and SIP1 show antagonism by differential recruitment of coactivators and corepressors to SMAD complexes, respectively (Postigo et al., 2003). In addition, the expression of ZEB1 and SIP1 was shown to be down-regulated by micro RNAs (Gregory et al., 2008). The effects of these post-transcriptional regulation mechanisms on SIP1 protein might be explored by using these novel MAbs in further functional studies.
Herein, we performed a pilot study for the understanding of tissue/ tumor specific SIP1 protein expression with the newly developed SIP1 specific antibodies using multi-tissue arrays. We showed that SIP1 protein levels increased only in a restricted group of tumors and most normal tissues displayed SIP1 expression at some extent. We feel to stress a drawback of staining multi-tumor arrays as the DAB color reaction has to be stopped when a detectable signal from majority of the samples is observed. Thus, our staining is optimal for high/medium SIP1 expressing tissues and may be sub-optimal for low SIP1 expressing ones. Lower SIP1 expressing tissues may have to be re-tested at their optimal conditions for the better understanding of SIP1 function in tumor development. Our recent paper that we analyzed SIP1 expression by immunohistochemistry and described SIP1 protein overexpression as a marker of poor prognosis in bladder cancers is a good example that SIP1 can be identified as a pro-metastatic protein (Sayan et al., 2009).
In conclusion our observation that SIP1 localized predominantly to the cytoplasm in both tumor and normal tissues suggests the implication of unidentified regulatory mechanisms that prevent translocation of SIP1 into the nucleus. This, in turn, adds another level of complexity to the control of EMT program in tumors progressing towards metastatic state. Therefore, ourfindings bring novel opportu-nities to further elaborate the role of SIP1 in tumor development. Conflict of interest statement
The authors declare that there are no conflicts of interest. Acknowledgments
This work was supported by the Scientific and Technological Research Council of Turkey Grant 104S243 (to T.Y.) and the Cancer Research United Kingdom Grant C8851/A10844 (to E.T.).
References
Avci, M.E., et al., 2008. Quantification of SLIT-ROBO transcripts in hepatocellular carcinoma reveals two groups of genes with coordinate expression. BMC Cancer 8, 392. Bassez, G., et al., 2004. Pleiotropic and diverse expression of ZFHX1B gene transcripts
during mouse and human development supports the various clinical manifesta-tions of the“Mowat–Wilson” syndrome. Neurobiol. Dis. 15, 240–250.
Bindels, S., et al., 2006. Regulation of vimentin by SIP1 in human epithelial breast tumor cells. Oncogene 25, 4975–4985.
Celikkaya, H., et al., 2007. Immunization with UV-induced apoptotic cells generates monoclonal antibodies against proteins differentially expressed in hepatocellular carcinoma cell lines. Hybridoma (Larchmt) 26, 55–61.
Chen, C.L., et al., 2006. Systemic evaluation of total Stat3 and Stat3 tyrosine phosphorylation in normal human tissues. Exp. Mol. Pathol. 80, 295–305. Comijn, J., et al., 2001. The two-handed E box binding zinc finger protein SIP1
downregulates E-cadherin and induces invasion. Mol. Cell 7, 1267–1278. Elloul, S., et al., 2005. Snail, Slug, and Smad-interacting protein 1 as novel parameters of
disease aggressiveness in metastatic ovarian and breast carcinoma. Cancer 103, 1631–1643.
Gregory, P.A., et al., 2008. The miR-200 family and miR-205 regulate epithelial to mesenchymal transition by targeting ZEB1 and SIP1. Nat. Cell Biol. 10, 593–601. Imamichi, Y., et al., 2007. Collagen type I-induced Smad-interacting protein 1 expression
downregulates E-cadherin in pancreatic cancer. Oncogene 26, 2381–2385. Isohata, N., et al., 2009. Hedgehog and epithelial–mesenchymal transition signaling in
normal and malignant epithelial cells of the esophagus. Int. J. Cancer 125, 1212–1221. Krishnamachary, B., et al., 2006. Hypoxia-inducible factor-1-dependent repression of E-cadherin in von Hippel–Lindau tumor suppressor-null renal cell carcinoma mediated by TCF3, ZFHX1A, and ZFHX1B. Cancer Res. 66, 2725–2731.
Leibovitz, A., et al., 1976. Classification of human colorectal adenocarcinoma cell lines. Cancer Res. 36, 4562–4569.
Lin, L.I., et al., 1998. Curcumin inhibits SK-Hep-1 hepatocellular carcinoma cell invasion in vitro and suppresses matrix metalloproteinase-9 secretion. Oncology 55, 349–353.
Lin, S.Y., Elledge, S.J., 2003. Multiple tumor suppressor pathways negatively regulate telomerase. Cell 113, 881–889.
Long, J., et al., 2005. Pc2-mediated sumoylation of Smad-interacting protein 1 attenuates transcriptional repression of E-cadherin. J. Biol. Chem. 280, 35477–35489. Maeda, G., et al., 2005. Expression of SIP1 in oral squamous cell carcinomas: implications
for E-cadherin expression and tumor progression. Int. J. Oncol. 27, 1535–1541. Massague, J., 2008. TGFbeta in cancer. Cell 134, 215–230.
Mejlvang, J., et al., 2007. Direct repression of cyclin D1 by SIP1 attenuates cell cycle progression in cells undergoing an epithelial mesenchymal transition. Mol. Biol. Cell 18, 4615–4624.
Mikkers, H., et al., 2002. High-throughput retroviral tagging to identify components of specific signaling pathways in cancer. Nat. Genet. 32, 153–159.
Miyoshi, A., et al., 2004. Snail and SIP1 increase cancer invasion by upregulating MMP family in hepatocellular carcinoma cells. Br. J. Cancer 90, 1265–1273.
Ozturk, N., et al., 2006. Reprogramming of replicative senescence in hepatocellular carcinoma-derived cells. Proc. Natl. Acad. Sci. U. S. A. 103, 2178–2183.
Park, S.M., et al., 2008. The miR-200 family determines the epithelial phenotype of cancer cells by targeting the E-cadherin repressors ZEB1 and ZEB2. Genes Dev. 22, 894–907.
Postigo, A.A., 2003. Opposing functions of ZEB proteins in the regulation of the TGFbeta/ BMP signaling pathway. EMBO J. 22, 2443–2452.
Postigo, A.A., et al., 2003. Regulation of Smad signaling through a differential recruitment of coactivators and corepressors by ZEB proteins. EMBO J. 22, 2453–2462.
Remacle, J.E., et al., 1999. New mode of DNA binding of multi-zincfinger transcription factors: deltaEF1 family members bind with two hands to two target sites. EMBO J. 18, 5073–5084.
Rosivatz, E., et al., 2002. Differential expression of the epithelial–mesenchymal transition regulators snail, SIP1, and twist in gastric cancer. Am. J. Pathol. 161, 1881–1891. Sayan, A.E., et al., 2009. SIP1 protein protects cells from DNA damage-induced
apoptosis and has independent prognostic value in bladder cancer. Proc. Natl. Acad. Sci. U. S. A.
Sivertsen, S., et al., 2006. Expression of Snail, Slug and Sip1 in malignant mesothelioma effusions is associated with matrix metalloproteinase, but not with cadherin expression. Lung Cancer 54, 309–317.
van Grunsven, L.A., et al., 2003. Interaction between Smad-interacting protein-1 and the corepressor C-terminal binding protein is dispensable for transcriptional repression of E-cadherin. J. Biol. Chem. 278, 26135–26145.
Vandewalle, C., et al., 2005. SIP1/ZEB2 induces EMT by repressing genes of different epithelial cell–cell junctions. Nucleic Acids Res. 33, 6566–6578.
Vandewalle, C., et al., 2009. The role of the ZEB family of transcription factors in development and disease. Cell. Mol. Life Sci. 66, 773–787.
Verschueren, K., et al., 1999. SIP1, a novel zinc finger/homeodomain repressor, interacts with Smad proteins and binds to 5′-CACCT sequences in candidate target genes. J. Biol. Chem. 274, 20489–20498.
Yoshida, J., et al., 2009. Changes in the expression of E-cadherin repressors, Snail, Slug, SIP1, and Twist, in the development and progression of ovarian carcinoma: the important role of Snail in ovarian tumorigenesis and progression. Med. Mol. Morphol. 42, 82–91.