FUNCTIONAL ANALYSIS OF TRANSGELIN
IN BREAST CANCER
A THESIS SUBMITTED TO
THE GRADUATE SCHOOL OF ENGINEERING AND SCIENCE OF BILKENT UNIVERSITY
IN PARTIAL FULFILLMENT OF THE REQUIREMENTS FOR THE DEGREE OF
MASTER OF SCIENCE IN
MOLECULAR BIOLOGY AND GENETICS
By
Nazlı Değer
FUNCTIONAL ANALYSIS OF TRANSGELIN IN BREAST CANCER
By Nazlı Değer June, 2018
We certify that we have read this thesis and that in our opinion it is fully adequate, in scope and in quality, as a thesis for the degree of Master of Science.
________________________ Işık Yuluğ (Advisor) ________________________ Onur Çizmecioğlu ________________________ Sreeparna Banerjee
Approved for the Graduate School of Engineering and Science
__________________ Ezhan Karaşan
Abstract
FUNCTIONAL ANALYSIS OF TRANSGELIN IN BREAST CANCER
Nazlı Değer
M.S. in Molecular Biology and Genetics Advisor: Işık Yuluğ
June, 2018
Transgelin (TAGLN) is an actin-binding protein. It is highly expressed in fibroblasts and smooth muscle cells. In smooth muscle cells, it takes part in processes including motility and differentiation and also it has a role in the formation of stress fibers. TAGLN gene has been found to be downregulated by promoter hypermethylation in breast and colon tissues and in these tissues, it acted as a tumor suppressor gene. However, in a study on nerve sheath tumors, TAGLN expression was found as upregulated via hypomethylation and in nerve sheath tumors, it acted as a proto-oncogene. To the best of our knowledge, the functional effect of TAGLN gene expression has not been studied in detail in breast carcinoma cell lines. The aim of this study was therefore to identify the functional role of TAGLN in breast cancer development. Hence, TAGLN gene expression was silenced or overexpressed and functional analysis was performed in selected breast cancer cell lines. Breast cancer cell lines were chosen according to their subtypes such as basal, HER2 positive or triple negative; their migratory properties; epithelial or mesenchymal characteristics and the expression level of TAGLN. Therefore, triple negative and mesenchymal MDA-MB-157 cells and MDA-MB-231 cells that express TAGLN at medium level were selected to silence TAGLN expression. The same cell lines and HER2 positive and epithelial MDA-MB-361 cells which express TAGLN at very low level were selected to overexpress TAGLN gene. Immunofluorescence and western blot analysis showed that in MDA-MB-157 and MDA-MB-231 cells mesenchymal marker Vimentin expression is correlated with TAGLN gene expression level. On the
spreading potential and viability capacity while TAGLN upregulated cells did not show any significant change. TAGLN silencing in MDA-MB-231 cells decreased the cell spreading potential and cell viability of the cells, TAGLN overexpression in MDA-MB-231 cells increased these properties of cells. MDA-MB-361 cells behaved differently with TAGLN overexpression; cells were able to form less colonies and cell viability decreased in TAGLN overexpressing cells. TAGLN gene silencing affected the cell cycles of MDA-MB-157 and MDA-MB-231 cells but TAGLN overexpression had no effect on the cell cycle.
In conclusion, TAGLN expression has an effect on Epithelial to Mesenchymal Transition (EMT) by altering the expression of established EMT markers E-Cadherin and Vimentin and its effect is based on the original morphology of the respective cell lines. In this study, the effect of TAGLN expression on cell proliferation was also studied and TAGLN seems to be acting as a tumor suppressor in MDA-MB-157 and MDA-MB-361 cells and as an oncogene in MDA-MB-231 cells. This might be due to the invasive character of MDA-MB-231 cells and the underlying mechanisms for this outcome should be investigated. Also, in vivo experiments can be performed to see whether changes in the expression of TAGLN gene has a role in tumor formation or metastasis capacity of cells.
Özet
MEME KANSERİNDE TRANSGELİN GENİNİN
FONKSİYONEL ANALİZİ
Nazlı Değer
Moleküler Biyoloji ve Genetik, Yüksek Lisans Tez Danışmanı: Işık Yuluğ
Haziran, 2018
Transgelin (TAGLN) aktin proteinine bağlanan bir proteindir. Fibroblastlarda ve düz kas hücrelerinde yüksek seviyede ifade edilir. Düz kas hücrelerinde, hareketlilik ve farklılaşmada görev alır ve stres liflerinin oluşumunda rol oynar. TAGLN geninin ifadesi, meme ve kolon kanseri dokularında promoter hipermetillenmesiyle düşürülmüştür ve TAGLN geni bu dokularda tümör baskılayıcı gen olarak davranmaktadır. Bununla birlikte, sinir kılıfı tümörleri üzerinde yapılan bir çalışmada, TAGLN geninin ifadesinin hipometilasyon ile artırıldığı ve bu dokularda, onkogen olarak davrandığı görülmüştür. Bildiğimiz kadarıyla, TAGLN geninin fonksiyonel etkisi daha önce meme karsinoma hücre hatlarında detaylı olarak çalışılmamıştır. Bu çalışmanın amacı, meme kanseri gelişiminde TAGLN geninin fonksiyonel rolünü ortaya çıkarmaktır. Bu sebeple, seçilen meme kanseri hücre hatlarında TAGLN geninin ifadesi azaltılmış ya da artırılmış ve sonrasında fonksiyonel analizler yapılmıştır. Meme kanseri hücre hatları seçilirken, hücre hatlarının alt tipleri, hücre göçü karakterleri, epitel ya da mezenkimal yapıda olma statüleri ve TAGLN geninin işlem yapılmamış hücrelerdeki ifade seviyeleri göz önüne alınmıştır. Bu sebeple, TAGLN genini orta seviyede ifade eden üçlü negatif mezenkimal MDA-MB-157 ve MDA-MB-231 hücreleri TAGLN geninin ifadesinin azaltılması için kullanılmıştır. Bu hücre hatları ve TAGLN genini az miktarda ifade eden HER2 pozitif ve epithel MDA-MB-361 hücreleri TAGLN geninin ifadesinin artırılması için kullanılmıştır. Immun floresan ve western blotlama analizleri MDA-MB-157 ve MDA-MB-231 hücrelerinde
TAGLN geninin yüksek ifadesiyle E-Cadherin ifadesinin arttığı ve Vimentin ifadesinin azaldığı görülmüştür. TAGLN geninin sessizleştirilmesi MDA-MB-157 hücrelerinde hücrelerin yayılma potansiyelini ve yaşama yeteneğini artırırken, TAGLN geninin ifadesinin artırılmasının bir etkisi olmamıştır. TAGLN geninin sessizleştirilmesi MDA-MB-231 hücrelerinde hücrelerin yayılma potansiyelini ve yaşama yeteneğini azaltırken, TAGLN geninin ifadesinin artırılması hücrelerin bu özelliklerinde artışa sebep olmuştur. MDA-MB-361 hücreleri TAGLN geninin yüksek ifadesinde daha farklı davranarak daha az koloni kurmuşlar ve yaşama yeteneklerinde azalma göstermişlerdir. MDA-MB-157 ve MDA-MB-231 hücrelerinde, TAGLN geninin sessizleştirilmesi hücre döngüsünde değişikliğe sebep olurken TAGLN geninin yüksek ifade edilmesi bir değişikliğe sebep olmamıştır.
Sonuç olarak, TAGLN geni E-Cadherin ve Vimentin ifadelerini değiştirerek epitel mezenkimal değişim (EMD) üzerinde bir etkiye sahiptir ve bu etki ilgili hücre hatlarının orijinal morfolojisine bağlıdır. Bu çalışmada, TAGLN ifadesinin proliferasyon üzerinde etkisi de çalışılmıştır ve TAGLN geninin MDA-MB-157 ve MDA-MB-361 hücrelerinde tümör baskılayıcı gen olarak, MDA-MB-231 hücrelerinde ise onkogen olarak işlevi olduğu görülmüştür. Bu farklılık MDA-MB-231 hücrelerinin invasif karakterinden kaynaklanıyor olabilir. Bu sebeple altta yatan mekanizmalar incelenmelidir. Ayrıca, TAGLN geninin ifadesindeki değişimlerin hücrelerin tümör oluşturma ve metastaz kapasitelerinde bir değişikliğe neden olup olmadığını anlamak için hayvan deneyleri yapılabilir.
Anahtar kelimeler: Meme kanseri, meme karsinoma hücre hattı, TAGLN, Transgelin
Acknowledgements
I started my master studies under supervision of Assoc. Prof. Dr. Işık Yuluğ in 2016. During my studies, she was always supportive and encouraging. She did not only provide advices and guidelines about lab but also about every other aspect of my life. Hence, I would like to thank her for being my advisor and for contributing me to be the researcher I am now.
I am very grateful to Assoc. Prof. Dr. Özlen Konu who reviewed statistics in my thesis and who was also very supportive as an advisor during the research projects we have worked on in my undergraduate years.
I would like thank Assist. Prof. Onur Çizmecioğlu who agreed to evaluate my thesis and be my jury member. In addition, I am grateful to him for his deep support during my assistantship to his course and also for his technical help for my experiments. I would like to also thank Prof. Dr. Sreeparna Banerjee for giving her precious time to evaluate my thesis and be a jury member.
I am also very grateful to all past and present MBG faculty members for their efforts in my education.
I would like to thank the past and present members of Yuluğ Group including Dr. Nilüfer Sayar Atasoy who set up the basics of my master’s project and Buse Nurten Özel for her kind welcome to the lab when I first joined the lab group. I thank Dr. Eda Süer and Ayşe Sedef Köseer who I have worked together in the same project for being good partners in lab. Also, I am very thankful to Gizem Sunar and Zeynep Ilgım Özerk for their kind support in my studies and for their genuine friendship both in lab and outside.
I would like to express my special thanks to my friends in department and to my close friends Fatma Betül Dinçaslan, Tuğçe Canavar and Merve Erden with whom I share a strong bond starting from our undergraduate years. I also want to express my gratitude to Zeynep Boyacıoğlu, Damla Güneş, Seniye Targen, Rojhat Onur Karasu and Rafet Sait Tiryaki with whom I have grown closer during my master studies.
Lastly, I am deeply grateful to my family: my mother and father for their love, support and trust which would make anyone feel stronger and happier.
Table of Contents
Abstract ... iii
Özet ... v
Acknowledgements ... viii
Table of Contents ... x
List of Figures ... xiii
List of Tables ... xv
Abbreviations ... xvi
Chapter 1. Introduction ... 1
1.1. Cancer ... 1
1.2. Breast Cancer ... 1
1.3. Human Mammary Gland ... 2
1.4. Anatomy of Human Mammary Gland ... 2
1.5. Histological Classification of Breast Cancer Subtypes ... 3
1.6. Molecular Classification of Breast Cancer ... 4
1.7. Epithelial to Mesenchymal Transition ... 6
1.8. Transgelin (TAGLN) Gene ... 8
1.9. Aim of the Study ... 9
Chapter 2. Materials and Methods ... 10
2.1. Materials ... 10
General Laboratory Chemicals and Reagents ... 10
Cell Culture Chemicals and Reagents ... 11
Nucleic Acids ... 12
Antibodies ... 14
PCR Primers ... 17
Equipment ... 18
2.2. Solutions and Media ... 19
Routinely Used Laboratory Solutions ... 19
Cell Culture Solutions and Media ... 20
2.3. Methods ... 23
Plasmid Isolation from Bacterial Glycerol Stocks ... 23
General Maintenance and Handling of Human Cell Lines ... 23
siRNA Transfection of MDA-MB-157 and MDA-MB-231 Cells ... 23
Kill Curve Assay and Determination of Selective Antibiotic Concentrations ... 24
Overexpression and shRNA Plasmid Transfection of Breast Cancer Cells ... 25
SDS-PAGE ... 26
Western Blot ... 27
Viability Assays ... 28
2D Colony Formation Assays ... 28
Co-immunofluorescence Staining of Breast Cancer and NT Breast Cells ... 28
FACS Analyses ... 29
Statistical Analyses ... 29
Experimental Approach ... 30
Chapter 3. Results ... 31
3.1. Immunofluorescence Staining of Breast Cancer Cell Lines ... 31
Co-immunofluorescence Staining of BT-474 Breast Carcinoma Cell Line ... 31
Co-immunofluorescence Staining of MCF-12A NT Breast Cell Line ... 34
Co-immunofluorescence Staining of MDA-MB-157 Breast Carcinoma Cell Line ... 37
Co-immunofluorescence Staining of MDA-MB-231 Breast Carcinoma Cell Line ... 40
Co-immunofluorescence Staining of MDA-MB-361 Breast Carcinoma Cell Line ... 43
3.2. Analysis of TAGLN Silencing in Breast Cancer Cell Lines ... 46
Silencing TAGLN Gene in MDA-MB-157 and MDA-MB-231 Cells at 72 Hours Affects Mesenchymal Marker Vimentin Expression. ... 48
Immunofluorescence Analysis of EMT markers in MDA-MB-157 and MDA-MB-231 cells transfected with Non-targeting siRNA and TAGLN siRNA ... 49
Colony Formation Assay of MDA-MB-157 and MDA-MB-231 Cells Transfected with Non-targeting siRNA and TAGLN siRNA ... 54
Cell Viability Assay of MDA-MB-157 and MDA-MB-231 Cells Transfected with Non-targeting siRNA and TAGLN siRNA ... 56
qRT-PCR Analysis of EMT Marker Panel in MDA-MB-157 and MDA-MB-231 Cells Transfected with Non-targeting siRNA and TAGLN siRNA. ... 57
Cell Cycle Analysis of MDA-MB-157 and MDA-MB-231 Cells Transfected with Non-targeting siRNA and TAGLN siRNA ... 59
3.3. Effect of TAGLN Overexpression in Breast Cancer Cell Lines ... 61
Overexpression of TAGLN in MDA-MB-157 Cells ... 61
3.3.1.1. Overexpressing TAGLN Gene in MDA-MB-157 Cells Affects Mesenchymal Marker Vimentin Expression. ... 61
3.3.1.2. Immunofluorescence Analysis of EMT Markers in MDA-MB-157 Cells Overexpressing TAGLN and Control ... 62
3.3.1.3. Colony Formation Assay in MDA-MB-157 Cells Overexpressing TAGLN and Control ... 65
3.3.1.4. Cell Viability Assay in MDA-MB-157 Cells Overexpressing TAGLN and Control ... 67
3.3.1.6. Cell Cycle Analysis of MDA-MB-157 Cells Overexpressing TAGLN and
Control ... 69
Overexpression of TAGLN in MDA-MB-231 Cells ... 71
3.3.2.1. Overexpressing TAGLN Gene in MDA-MB-231 Cells Increases Mesenchymal Marker Vimentin Expression ... 71
3.3.2.2. Immunofluorescence Analysis of EMT Markers in MDA-MB-231 Cells Overexpressing TAGLN and Control ... 72
3.3.2.3. Colony Formation Assay in MDA-MB-231 Cells Overexpressing TAGLN and Control ... 79
3.3.2.4. Cell Viability Assay in MDA-MB-231 Cells Overexpressing TAGLN and Control ... 82
3.3.2.5. qRT-PCR Analysis of MDA-MB-231 Cells Overexpressing TAGLN and Control ... 84
3.3.2.6. Cell Cycle Analysis of MDA-MB-231 Cells Overexpressing TAGLN and Control ... 86
Overexpression of TAGLN in MDA-MB-361 Cells ... 87
3.3.3.1. Overexpressing TAGLN Gene in MDA-MB-361 Cells ... 87
3.3.3.2. Immunofluorescence Analysis of EMT Markers in MDA-MB-361 Cells Transfected with pCMV6 TAGLN Vector and Control ... 88
3.3.3.3. Colony Formation Assay of MDA-MB-361 Cells Transfected with pCMV6 TAGLN Vector and Control ... 93
3.3.3.4. Cell Viability Assay of MDA-MB-361 Cells Transfected with pCMV6 TAGLN Vector and Control ... 95
3.3.3.5. qRT-PCR Analysis of EMT Marker Panel in MDA-MB-361 Cells Transfected with pCMV6 TAGLN Vector and Control. ... 96
Chapter 4. Discussion ... 98
Chapter 5. Future Perspectives ... 108
References ... 109
List of Figures
Figure 1.1. Structure of normal breast tissue and development of breast cancer. ... 2
Figure 1.2. Histological classification of breast cancer subtypes. ... 4
Figure 1.3. Epithelial to mesenchymal transition. ... 6
Figure 1.4. Types of EMT. ... 7
Figure 2.1. Experimental approach which was followed for siRNA and overexpression transfection. 30 Figure 3.1. Co-immunofluorescence staining of BT-474 cells... 33
Figure 3.2. Co-immunofluorescence staining of MCF-12A cells. ... 36
Figure 3.3. Co-immunofluorescence staining of MDA-MB-157 cells. ... 39
Figure 3.4. Co-immunofluorescence staining of MDA-MB-231 cells. ... 42
Figure 3.5. Co-immunofluorescence staining of MDA-MB-361 cells. ... 45
Figure 3.6. TAGLN gene was silenced in MDA-MB-157 and MDA-MB-231 cells with TAGLN siRNA after 72 hours of treatment. ... 47
Figure 3.7. TAGLN gene silencing was quantified in MDA-MB-157 and MDA-MB-231 cells with TAGLN siRNA after 72 hours of treatment. ... 47
Figure 3.8. TAGLN gene was silenced in MDA-MB-157 and MDA-MB-231 cells with TAGLN siRNA. ... 48
Figure 3.9. TAGLN gene silencing was quantified in MDA-MB-157 and MDA-MB-231 cells with TAGLN siRNA after 72 hours of treatment. ... 49
Figure 3.10. Silencing TAGLN gene in MDA-MB-157 and MDA-MB-231 cells effected the expression and localization of mesenchymal marker Vimentin. ... 53
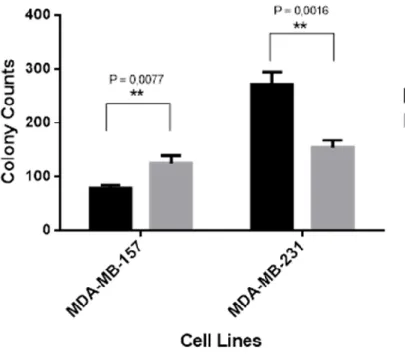
Figure 3.11. Silencing TAGLN gene has increased colony formation capacity of MDA-MB-157 cells but has reduced it in MDA-MB-231 cells. ... 54
Figure 3.12. Silencing TAGLN gene caused the formation of more colonies in MDA-MB-157 cells but less colonies in MDA-MB-231 cells. ... 55
Figure 3.13. Silencing TAGLN gene increased the viability of MDA-MB-157 cells but decreased the viability of MDA-MB-231 cells. ... 56
Figure 3.14. qRT-PCR analysis of TAGLN and EMT markers in MDA-MB-157 and MDA-MB-231 cell lines with TAGLN silencing... 58
Figure 3.15. Cell cycle analysis of A) MDA-MB-157 and B) MDA-MB-231 cells upon TAGLN silencing. ... 60
Figure 3.16. TAGLN gene was overexpressed in MDA-MB-157 cells with pCMV6 TAGLN vector. 61 Figure 3.17. TAGLN gene overexpression was quantified in MDA-MB-157 cells. ... 62
Figure 3.18. Overexpressing TAGLN gene in MDA-MB-157 cells effected the expression of mesenchymal marker Vimentin. ... 64
Figure 3.20. Overexpressing TAGLN gene has no effect on the formation of colonies in MDA-MB-157 cells. ... 66 Figure 3.21. Overexpressing TAGLN gene has no effect on the viability of MDA-MB-157 cells... 67 Figure 3.22. qRT-PCR analysis of TAGLN and EMT markers in MDA-MB-157 cells. ... 69 Figure 3.23. Propidium iodide staining of MDA-MB-157 cells revealed no change in cell cycle phases with TAGLN overexpression. ... 70 Figure 3.24. TAGLN gene was overexpressed in MDA-MB-231 cells with pCMV6 TAGLN vector. 71 Figure 3.25. TAGLN gene overexpression was quantified in MDA-MB-231 cells. ... 72 Figure 3.26. Overexpressing TAGLN gene in MDA-MB-231 cells effected the expression of mesenchymal marker Vimentin. ... 78 Figure 3.27. Overexpressing TAGLN gene has increased colony formation capacity of MDA-MB-231 T2 OE cells. ... 80 Figure 3.28. Overexpressing TAGLN gene has caused the formation of more colonies in MDA-MB-231 T2 OE cells. ... 81 Figure 3.29. Overexpressing TAGLN Gene has increased the viability of MDA-MB-231 T2 OE Cells. ... 83 Figure 3.30. qRT-PCR analysis of TAGLN and EMT markers in MDA-MB-231 cells overexpressing TAGLN and control. ... 85 Figure 3.31. Propidium iodide staining of MDA-MB-231 cells revealed no change in cell cycle phases with TAGLN overexpression. ... 86 Figure 3.32. TAGLN gene was overexpressed in MDA-MB-361 cells with pCMV6 TAGLN vector. 87 Figure 3.33. TAGLN gene overexpression was quantified in MDA-MB-361 cells. ... 88 Figure 3.34. Overexpressing TAGLN gene in MDA-MB-361 cells effected the expression of epithelial marker E-Cadherin and mesenchymal markers N-Cadherin and Vimentin. ... 92 Figure 3.35. Overexpressing TAGLN gene has decreased the colony formation capacity of MDA-MB-361 cells. ... 93 Figure 3.36. Overexpressing TAGLN Gene has caused the formation of less colonies in MDA-MB-361 cells. ... 94 Figure 3.37. Overexpressing TAGLN gene has decreased the viability of MDA-MB-361 Cells. ... 95 Figure 3.38. qRT-PCR analysis of TAGLN and EMT markers in MDA-MB-361 cells overexpressing TAGLN and control. ... 96
List of Tables
Table 1.1. Molecular classification of breast cancer. ... 5
Table 2.1: Chemicals, reagents, enzymes and kits used for general laboratory purposes. ... 10
Table 2.2: Chemicals, reagents, kits and media used in cell culture. ... 12
Table 2.3: List of nucleic acids used for gene editing. ... 13
Table 2.4: Antibodies used in the study. ... 14
Table 2.5. Concentrations and secondary antibodies of primary antibodies. ... 15
Table 2.6. Concentrations and usage areas of secondary antibodies. ... 16
Table 2.7: Primers used in the study. ... 18
Table 2.8: Equipment used for the experiments. ... 19
Table 2.9: Routinely used buffers and solutions. ... 19
Table 2.10: Cell lines and their growth media. ... 21
Table 2.11. Characteristics of breast carcinoma cell lines... 22
Table 2.12. Constituents of SDS-Polyacrylamide Gel. ... 27
Table 3.1. Summary table of staining with TAGLN and EMT markers in breast carcinoma cell lines. ... 31
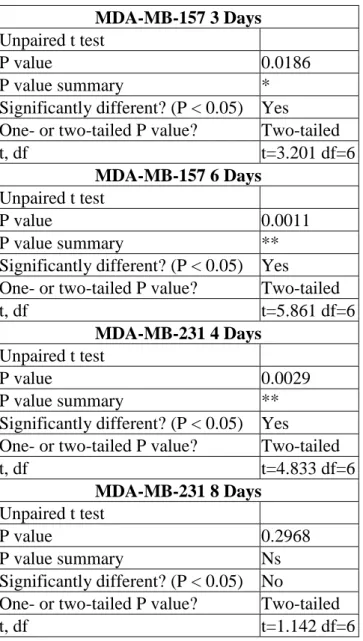
Table 3.2. Statistics of colony formation of MDA-MB-157 and MDA-MB-231 cells transfected with Non-targeting siRNA and TAGLN siRNA. ... 55
Table 3.3. Statistics of viability of MDA-MB-157 and MDA-MB-231 cells transfected with Non-targeting siRNA and TAGLN siRNA. ... 57
Table 3.4. Expression values that were used in Figure 3.14... 58
Table 3.5. Statistics of colony formation of MDA-MB-157 cells overexpressing TAGLN and control. ... 66
Table 3.6. Statistics of viability of MDA-MB-157 cells overexpressing TAGLN and control. ... 68
Table 3.7. Expression values that were used in Figure 3.22... 69
Table 3.8. Statistics of colony formation of MDA-MB-231 cells overexpressing TAGLN and control. ... 82
Table 3.9 Statistics of viability of MDA-MB-231 cells overexpressing TAGLN and control. ... 84
Table 3.10. Expression values that were used in Figure 3.30... 85
Table 3.11. Statistics of colony formation of MDA-MB-361 cells overexpressing TAGLN and control. ... 94
Table 3.12. Statistics of viability of MDA-MB-361 cells overexpressing TAGLN and control. ... 95
Table 3.13. Expression values that were used in Figure 3.28... 96
Abbreviations
ANLN Annilin NT Non-tumorigenic
BC Breast carcinoma OD Optical density
CDH1 E-Cadherin OS Overall survival
CDH2 N-Cadherin PBS Phosphate buffered saline
DBC Ductal breast carcinoma PR Progesterone receptor DCIS Ductal carcinoma in situ RT Room temperature ddH2O Double distilled H2O shRNA Short hairpin RNA DMSO Dimethyl sulfoxide siRNA Small interfering RNA EMT Epithelial to mesenchymal
transition SMC Smooth muscle cell
ER Estrogen receptor SNAI2 Snail family transcriptional repressor 2
FACS Fluorescence assisted cell
sorting TAGLN Transgelin
FBS Fetal bovine serum TBS Tris buffered saline
FN Fibronectin TCA Trichloroacetic acid
IDC Invasive ductal carcinoma TN Triple negative
IF Immunofluorescence TSG Tumor suppressor gene ILC Invasive lobular carcinoma TSS Transcription start site
KRT18 Keratin 18 um Micrometer
LBC Lobular breast carcinoma UTR Untranslated region LCIS Lobular carcinoma in situ VIM Vimentin
MET Mesenchymal to epithelial
transition WB Western blotting
Chapter 1. Introduction
1.1. Cancer
Cancer is the one of leading causes of death worldwide. According to World Health Organization Statistics, in 2012, there were 14.1 million new cancer cases and 8.2 million cancer mortality worldwide. While cancer cases occurred throughout the world in people at different socioeconomic status, in 2012, 57% of new cancer cases occurred in less developed regions of the world and 65% of cancer mortality was observed in these regions (1).
1.2. Breast Cancer
Breast cancer is the most common cancer observed among women followed by lung and bronchus cancer. In 2018, 266,120 new cases were estimated to occur in U.S. For cancer mortality, breast cancer stands at the second position behind lung and bronchus cancer. In U.S., in 2018, there were an estimated 40,920 breast cancer related deaths. Breast cancer is common in middle-aged and older women while it can rarely develop in men. Survival is more likely among younger women when compared to women at an advanced age (2 and 56).
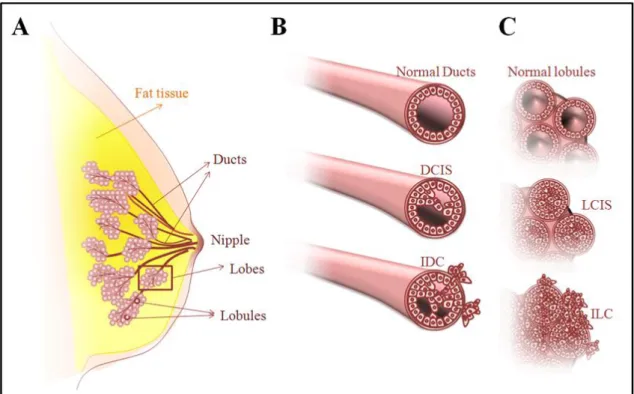
Figure 1.1. Structure of normal breast tissue and development of breast cancer.
(A) shows the structure of the normal breast tissue. (B) shows the development and progression of ductal carcinoma in situ (DCIS) and invasive ductal carcinoma (IDC). (C) shows the development of progression of lobular carcinoma in situ (LCIS) and invasive lobular carcinoma (ILC) (Figure taken from (3)).
1.3. Human Mammary Gland
Human mammary glands have a unique and specific function to synthesize, secrete and deliver milk to a new-born baby. During pregnancy and lactation, the mammary glands reach their mature development states under the influence of hormones through which the mammary glands are remodeled into milk-secreting organs. During reproductive life, human mammary glands have the capacity to cycle from resting state to lactation and with the cessation of lactation to the resting state. Tight hormonal regulation is critical for the normal functioning of the glands (4).
1.4. Anatomy of Human Mammary Gland
milk glands (lobules) and milk ducts exist. Milk ducts are responsible for carrying milk from milk glands to the nipple during lactation. Milk ducts branch into smaller units called ductules and they channel into the lobules of a lobe (4).
1.5. Histological Classification of Breast Cancer Subtypes
To date, several pathological subtypes of breast cancer have been defined. Among them, some are widely occurring while others are classified as rare. Breast cancer is a heterogeneous disease which is also the reason for high numbers of breast cancer related mortality. This heterogeneity means that the breast tumor can be composed of more than one type at the pathological level (5). Breast cancer is mainly classified as in situ carcinoma and invasive carcinoma. Breast carcinoma in situ is classified as ductal or lobular carcinoma. Ductal carcinoma in situ (DCIS) is observed more commonly than lobular carcinoma in situ (LCIS). DCIS includes tumors from a heterogeneous origin. DCIS can be further classified as Comedo, Cribiform, Micropapillary, Papillary and Solid (6).
Figure 1.2. Histological classification of breast cancer subtypes.
Breast cancer is mainly classified as in situ carcinoma or invasive (infiltrating) carcinoma which are further classified into groups. Classification is done according to growth patterns and architectural features (Figure taken from (6)).
1.6. Molecular Classification of Breast Cancer
Breast tumors are classified into separate groups based on their global expression profiles. They are generally grouped into subtypes based on the prognosis of patients, aggressiveness of the disease and treatment selection.
Table 1.1. Molecular classification of breast cancer.
Breast cancer tumors can be categorized based on their expression profiles. Several subtypes shows different occurrences and disease progression (Table adapted from (7)).
Subtype Alias Biomarker
Status Grade Outcome Prevalence
Luminal Luminal A [ER+|PR+] HER2-KI67- 1|2 Good 23.7% Luminal B [ER+|PR+] HER2-KI67+ 2|3 Intermediate 38.8% [ER+|PR+] HER2+KI67+ Poor 14% HER2 positive HER2
overexpression ER-PR-HER2+ 2|3 Poor 11.2%
Triple negative
Basal ER-PR-HER2-,
basal marker+ 3 Poor 10-25%
12.3% Claudin-low ER-PR-HER2-, EMT marker+, Stem-cell marker+, claudin- 3 Poor 7-14% Metaplastic breast cancer (MBC) ER-PR-HER2-, EMT marker+, Stem-cell marker+ 3 Poor 1% Interferon-rich ER-PR-HER2-, interferon regulated genes+ 3 Intermediate ~10% Molecular apocrine cancer (MAC) Molecular apocrine cancer (MAC) ER-PR-AR+ 2|3 Poor 13.2%
1.7. Epithelial to Mesenchymal Transition
Epithelial-mesenchymal transition (EMT) is a biological process through where epithelial cells undergo multiple biochemical changes and then transform into a mesenchymal cell phenotype. During this process, several transcription factors are activated, specific cell-surface proteins are expressed, cytoskeletal proteins are expressed and reorganized, ECM-degrading enzymes are produced and changes in the expression of specific microRNAs occur. These changes can be used as tools in other words as biomarkers to distinguish the phenotype of cells and any change (8).
Figure 1.3. Epithelial to mesenchymal transition.
During EMT, changes in cell morphology and in the expression of established biomarkers occur (Figure taken from (8)).
During EMT, while epithelial markers decrease in cells, the expression of mesenchymal markers increases, supporting cells to take on the mesenchymal phenotype.
The reverse of EMT called Mesenchymal to Epithelial Transition (MET) is also possible and has been observed in fibroblasts during the generation of induced pluripotent stem cells (9). During the process of MET, cells lose mesenchymal markers and the expression of epithelial markers increase.
implantation, embryogenesis and organ development. Structures formed by EMT can be further induced to differentiate into other types of epithelial tissues via MET and also with subsequent EMT, cells of connective tissue can be generated. Type 2 EMT is associated with wound healing, tissue generation and organ fibrosis. Type 2 EMT starts as a repair event to reconstruct tissues after a trauma or inflammatory injury. During this event, new fibroblasts are generated. With the case of wound healing and tissue generation, inflammation occurs and then ceases. However, with organ fibrosis, Type 2 EMT continues with ongoing inflammation which at the last causes organ destruction. Type 3 EMT is associated with cancer prognosis and metastasis (8). Excessive proliferation of epithelial cells and angionesis are characteristics of primary epithelial cancers (10). Newly gained abilities such as invasiveness and increased proliferation rate through EMT might cause threatening outcomes. Several studies show the carcinoma cells to gain a mesenchymal phenotype and express mesenchymal markers (8).
Figure 1.4. Types of EMT.
Different types of EMT are associated with different outcomes in cells. While Type 1 EMT is mainly for developmental purposes, Type 2 EMT is associated with tissue regeneration and organ fibrosis whereas Type 3 is linked to cancerous outcomes
1.8. Transgelin (TAGLN) Gene
TAGLN (Transgelin) is a protein coding gene expressed in humans. It is also known
by the name of SM22, SMCC, TAGLN1, WS3-10 and SM22-alpha. TAGLN gene has homologs in the chicken, chimpanzee, cow, dog, frog, mouse, rat and zebrafish. It is located on chromosome 11q23.3. It has 5 exons and 2 mRNA variants. Variant 1 is longer than Variant 2 which differs in its 5’ Untranslated Region (UTR). These 2 variants encode for the same protein. Conserved domain of TAGLN includes Calponin homology domain which is an actin binding domain and therefore can facilitate actin binding. This Calponin domain can be as a single copy or in tandem repeats by which binding affinity is increased. This domain is found in cytoskeletal and signal transduction proteins, proposing some roles for TAGLN protein (12).
TAGLN is an actin binding protein though its previously stated Calponin domain. Therefore, it can interact closely with the actin cytoskeleton and it is highly expressed in smooth muscle cells (SMC) (13 and 14). In SMCs, TAGLN has roles in processes including motility and differentiation. Also, it takes part in the formation of stress fibers. TAGLN gene expression is differentially regulated in different diseases according to the different researches. While it is downregulated in breast, colon and prostate cancers (15 and 16), it is upregulated in pancreatic and gastric cancers and nerve sheath tumors (17, 18 and 19). This behavior of TAGLN gene makes it undefinable as tumor suppressor or oncogene. A previous study in breast cancer has revealed that TAGLN gene is downregulated in 19 out of 21 tumors if compared to paired normal tissues due to DNA hypermethylation in tumors (20). In a study, TAGLN was shown to have a role in migration such that the reduced expression in REF52 fibroblasts with the disruption of actin organization results in the increase in the capacity of cells to invade. The same study also showed that re-expressing TAGLN in PC3 prostate epithelial cancer cells with undetectable TAGLN expression had reduced ability to migrate (21). TAGLN is also reported as a negative regulator of MMP9 which is a strong mediator of metastasis in HT1080 cells, connective tissue cells (22). MMP9 is found as a driver of malignant progression and metastasis in breast cancer (23) where TAGLN gene is known to be downregulated (20), proposing a role
Some research propose TAGLN protein to be a mesenchymal protein. Also, TGF- β has been identified as an inducer of TAGLN gene and also an inducer of EMT in cancer cells (25 and 26). This result brings the question of TAGLN expression being concurrent with EMT process.
1.9. Aim of the Study
The aim of this study was to identify the functional role of TAGLN gene in breast cancer. Different breast carcinoma cell lines were used in order to understand the functional role of TAGLN. Hence, TAGLN gene was upregulated in MDA-MB-157, MBA-MB-231 and MDA-MB-361 using an overexpression vector pCMV6 TAGLN and its empty vector as a control. Also, TAGLN gene was downregulated in MDA-MB-157 and MBA-MB-231 cell lines using TAGLN siRNA and Non-targeting siRNA as a control. Selected TAGLN overexpressing cell clones were used to analyze the role of TAGLN in cell cycle, cell growth, and EMT. The same analysis were also performed in TAGLN siRNA downregulated breast carcinoma cells.
Chapter 2.
Materials and Methods
2.1. Materials
General Laboratory Chemicals and Reagents
General laboratory chemicals and reagents are routinely used substances which are used in common techniques such as PCR, western blotting, agarose gel electrophoresis, bacterial growth etc. Table 2.1 lists these materials, their catalog numbers and the companies providing them.
Table 2.1: Chemicals, reagents, enzymes and kits used for general laboratory purposes.
Name Catalog # Company (Country)
Molecular Biology Grade Water SH30538 Thermo Scientific (USA) Nucleospin RNA extraction kit 740955 Macherey Nagel (Germany) RevertAid First Strand cDNA
Synthesis Kit K1622 Thermo Scientific (USA)
DyNAmo HS SYBR Green
qPCR Kit F-410L Thermo Scientific (USA)
Taq DNA Polymerase and
buffers EP0402 Thermo Scientific (USA)
Agarose BHE500 Prona (Spain)
Ethidium Bromide 17898 Thermo Scientific (USA)
Gene Ruler 1 kb DNA Ladder SM0311 Thermo Scientific (USA) Gene Ruler 50 bp DNA Ladder SM373 Thermo Scientific (USA)
Yeast extract 1702 Conda (Spain)
Agar (microbiology grade) 05039 Sigma Aldrich (USA)
Bacto-tryptone 1612 Conda (Spain)
Table 2.1: Chemicals, reagents, enzymes and kits used for general laboratory purposes.
Name Catalog # Company (Country)
PureLink Quick Plasmid
Miniprep Kit K210011 Thermo Scientific (USA)
Proteinase inhibitor cocktail P8340 Sigma Aldrich (USA)
Triton X-100 T8787 Sigma Aldrich (USA)
2-mercaptoethanol M3148 Sigma Aldrich (USA)
EDTA A3562 Applichem (Germany)
SDS 71725 Sigma Aldrich (USA)
Ammonium per-sulfate A3678 Sigma Aldrich (USA)
TEMED 1610801 Biorad (USA)
PageRuler Prestained Protein
Ladder, 10 to 170kDa 26616 Thermo Scientific (USA) Glacial acetic acid 27225 Sigma Aldrich (USA)
Tris (Trizma Base) T1503 Sigma Aldrich (USA)
Glycine G8898 Sigma Aldrich (USA)
Roche PVDF Membranes 0.2uM 3010040001 Roche (USA) Bovine Serum Albumin Fraction
V (BSA) 10735078001 Roche (USA)
Tween-20 822184 Merck /Germany)
ECL Prime System RPN2232 Life Sciences (USA) Mounting medium for IHC CS70330 Dako (Denmark) Sulforhodamine B (SRB) 230162 Sigma Aldrich (USA) Trichloroacetic acid (TCA) 33731 Sigma Aldrich (USA)
Cell Culture Chemicals and Reagents
Chemicals, reagents and media which are used in the cell culture experiments are listed in Table 2.2.
Table 2.2: Chemicals, reagents, kits and media used in cell culture.
Name Catalog # Company (Country)
DMEM, High Glucose SH30243 GE Healthcare (UK) DMEM, Low Glucose SH30021 GE Healthcare (UK) DMEM:HAM’s F-12 1:1 SH30023 GE Healthcare (UK)
OptiMEM I 11058 Thermo-Fischer Scientific
(USA)
Fetal Bovine Serum CH30160 GE Healthcare (UK)
L-glutamine SH30034 GE Healthcare (UK)
Non-Essential Amino Acids SH30238 GE Healthcare (UK) Penicillin/Streptomycin SV30010 GE Healthcare (UK) Sodium Pyruvate (100mM) 11360 Thermo-Fischer Scientific
(USA)
Hydrocortisone H4001 Sigma Aldrich (USA)
Epidermal Growth Factor E9644 Sigma Aldrich (USA)
Insulin I9278 Sigma Aldrich (USA)
PBS SH30256 GE Healthcare (UK)
Trypsin/EDTA (0.25%) SV30031 GE Healthcare (UK) Dimethyl sulfoxide (DMSO) A1584 Applichem (Germany) UltraCruz™ Mounting Medium for
IF SC24941
Santa Cruz Biotechnology (USA) Lipofectamine 2000 transfection reagent 11668 Thermo-Fischer Scientific (USA) Nucleic Acids
Nucleic acids such as siRNAs, shRNA and overexpression vectors which are used in the experiments are listed in Table 2.3. Description of vectors and sequences of siRNAs are also provided.
Table 2.3: List of nucleic acids used for gene editing.
Name Catalog # Company Description/Target sequence
pCMV6-Entry PS100001 OriGene (USA)
Mammalian vector with C-terminal Myc- DDK Tag
pCMV6-TAGLN RC215789
OriGene (USA)
TAGLN (Myc-DDK-tagged)-Human transgelin (TAGLN), transcript variant 2 (NM_003186) siGENOME Non-Targeting siRNA #2 D-001210-02-20 Thermo Scientific (USA) UAAGGCUAUGAAGAGAUAC siGENOME Human TAGLN siRNA, SMARTpool M-003714-02-0020 Thermo Scientific (USA) siRNA1- AGAAAGCGCAGGAGCAUAA siRNA2- CCAGACUGUUGACCUCUUU siRNA3- CCAAAAUCGAGAAGAAGUA siRNA4- UGUCCUCCUUGGCGGCAAA GIPZ Non-silencing Lentiviral shRNA Control RHS4346 Dharmacon
(USA) Non-silencing shRNA
GIPZ Lentiviral Empty Vector shRNA Control
RHS4349 Dharmacon
(USA) Empty Lentiviral shRNA
GIPZ TAGLN shRNA RHS5086-EG6876 Dharmacon (USA) V2LHS_153751-ACATGTCAGTCTTGATGAC V3LHS_395056-TCAAAGAGGTCAACAGTCT V3LHS_395059-TGAAGACCATGGAGGGTGG
Antibodies
Antibodies which are used in the western blot and immunofluorescence experiment are listed in Table 2.4.
Table 2.4: Antibodies used in the study.
Name of the antibody Catalog # Company
Rabbit anti-SM22 alpha (TAGLN) ab14106 Abcam (UK) Mouse anti-E Cadherin [HECD-1] ab1416 Abcam (UK)
Mouse anti-Vimentin [V9] ab8069 Abcam (UK)
Rabbit anti-Vimentin (D21H3) XP 5741
Cell Signaling Technology (USA)
Rabbit anti-Calnexin C4731 Sigma Aldrich
(USA)
Mouse anti-N-cadherin Antibody (3B9) 33-3900 Thermo Fisher (USA)
Mouse anti-Occludin Antibody (OC-3F10) 33-1500 Thermo Fisher (USA)
Anti-rabbit IgG-HRP A6154 Sigma-Aldrich
(USA)
Anti-mouse IgG-HRP A0168 Sigma-Aldrich
(USA) Donkey polyclonal Secondary Antibody to
Mouse IgG - H&L (Alexa Fluor® 488), pre-adsorbed
ab150109 Abcam (UK)
Donkey anti-Rabbit IgG (H+L) Secondary
Antibody, Alexa Fluor® 568 conjugate A10042
Life Sciences (USA)
Table 2.5. Concentrations and secondary antibodies of primary antibodies. Name of Primary Antibody Type of Secondary Antibody Concentration for Western Blotting Concentration for Immunofluorescence Anti-TAGLN Rabbit 0.2 µg/mL 1 µg/mL Anti-E-Cadherin Mouse 1/2000 1/2000 Anti-Vimentin [V9] Mouse N/A 1 µg/mL Anti-Vimentin [D21H3] Rabbit 1 µg/mL N/A
Anti-Calnexin Rabbit 1/10000 N/A
Anti-N-Cadherin Mouse 0.5 µg/mL 2 µg/mL
Anti-Occludin Mouse 0.5 µg/mL 3 µg/mL
Table 2.6. Concentrations and usage areas of secondary antibodies. Name of Secondary Antibody Usage Area of Secondary Antibody Concentration for Western Blotting Concentration for Immunofluorescence Anti-Rabbit IgG-HRP
Western Blotting 1/5000 N/A
Anti-Mouse IgG-HRP
Western Blotting 1/5000 N/A
Anti-Mouse IgG H&L (Alexa Fluor® 488) Immunofluorescence N/A 4 µg/mL Anti-Rabbit IgG H&L (Alexa Fluor® 568) Immunofluorescence N/A 4 µg/mL
PCR Primers
Primers which are used for qRT-PCR are listed in Table 2.7. Also, associated amplicon sizes, Tm values for the annealing step of PCR and qRT-PCR efficiency percentages are given. All primers were purchased from and synthesized by Iontek (Istanbul) or Sentromer (Istanbul). All primers were solved in nuclease-free water upon arrival to be 100 µM and later they were kept at -20°C for storage.
Table 2.7: Primers used in the study.
Primer Name PCRa Primer Sequence (5’ to 3’) Tm b (°C) Sizec (bp) Eff.d % GAPDH F RT GGCTGAGAACGGGAAGCTTGTCAT 60 140 99 GAPDH R CAGCCTTCTCCATGGTGGTGAAGA TAGLN F RT TGCGAGCCCTGAGGAAGCCT 60 220 104 TAGLN R TCAGAATCACGCCATTCTTCAGCCA
Primers designed and kindly provided by Assoc. Prof. Dr. Özgür Şahin:
CDH1 F RT CCCGGGACAACGTTTATTAC 58 72 92 CDH1 R GCTGGCTCAAGTCAAAGTCC CDH2 F RT ACAGTGGCCACCTACAAAGG 58 201 105 CDH2 R CCGAGATGGGGTTGATAATG FN F RT CTGGCCGAAAATACATTGTAAA 58 114 91 FN R CCACAGTCGGGTCAGGAG KRT18 F RT TGATGACACCAATATCACACGA 58 112 98 KRT18 R GGCTTGTAGGCCTTTTACTTCC MMP9 F RT GAACCAATCTCACCGACAGG 58 67 103 MMP9 R GCCACCCGAGTGTAACCATA SNAI2 F RT TGGTTGCTTCAAGGACACAT 58 66 93 SNAI2 R GTTGCAGTGAGGGCAAGAA VIM F RT GGTGGACCAGCTAACCAACGA 58 183 N/A VIM R TCAAGGTCAAGACGTGCCAGA ZEB1 F RT GGGAGGAGCAGTGAAAGAGA 58 70 96 ZEB1 R TTTCTTGCCCTTCCTTTCTG ZEB2 F RT AAGCCAGGGACAGATCAGC 58 74 100 ZEB2 R CCACACTCTGTGCATTTGAACT ZO1 F RT CAGAGCCTTCTGATCATTCCA 58 69 98 ZO1 R CATCTCTACTCCGGAGACTGC
a Purpose of PCR, RT: qRT-PCR. b Annealing temperature. cAmplicon size. dEff:
Efficiency values calculated by Dr. Nilüfer Sayar (3).
Equipment
Table 2.8: Equipment used for the experiments.
Name of the instrument Company
PCR Thermal cycler Applied Biosystems (USA)
AutoFlow NU-8500 Water Jacket CO2 Incubator NuAire (USA)
AxioCam MRc5 image capture device Carl Zeiss (Germany) Centrifuges 5810 and 5810 R Eppendorf (Germany) Stratagene Mx3005P Real-Time PCR System Agilent (USA)
Bond Max equipment Leica Microsystems (Germany)
Amersham Imager 600 Dharmacon (USA)
2.2. Solutions and Media
Routinely Used Laboratory Solutions
Buffers and solutions which are commonly used in the laboratory are listed in Table 2.9.
Table 2.9: Routinely used buffers and solutions.
Buffer For 100 ml aqueous solution (if not otherwise stated)
30% Acryl:Bis-acryl Solution
29 g acrylamide; 1 g bis-acrylamide (in dark)
0.5 M EDTA 18.61 g disodium EDTA.2H2O (pH=8.0)
50X TAE 24.2 g Tris-base; 5.71 ml glacial acetic acid; 10 mL 0.5 M EDTA (pH=8.0)
10X PBS 8.0 g NaCl; 0.2 g KCl; 1.44 g Na2HPO4.2H2O; 0.24 g KH2PO4 (pH=7.4)
10X TBS 2.4 g Tris-base; 8.8 g NaCl. pH = 8.0 10X Running Buffer 3.03 g Tris-base; 14.41 g glycine; 1 g SDS
Table 2.9: Routinely used buffers and solutions.
Buffer For 100 ml aqueous solution (if not otherwise stated)
Lysis Buffer (1ml) 67.5 µl 2M NaCl; 45 µl 1M Tris-HCL (pH = 8.0); 10 µl Triton X-100, 100 µl 10X Proteinase inhibitor.
5x Protein Loading Buffer
0.001g Bromophenol blue; 2g SDS; 62.5 mM Tris-HCL (pH:6.8); 15% glycerol. 5% β-mercaptoethanol is added prior to loading.
Wet Transfer Buffer 0.6 g Tris-Base; 2.88 g glycine; 15% Methanol Crystal Violet
Solution
0.5% crystal violet; 25% MetOH in 1X PBS
Fixation Solution for IF
4% Formaldehyde in 1X PBS
Permeabilization Solution for IF
0.25 % Triton X-100 in 1X PBS
LB 1 g Tryptone; 1 g NaCl; 0.5 g Yeast Extract
Cell Culture Solutions and Media
Table 2.10: Cell lines and their growth media.
Cell line kindly provided by Assoc. Prof. Dr. Ali Osmay Güre, Bilkent University, Ankara. ** Cell line kindly provided by Assoc. Prof. Dr. Elif Erson Bensan, METU, Ankara. Other cell lines were purchased from ATCC. Basic Media consist of the given medium; 10% FBS; 1% Penicillin/Streptomycin; 1% Non-essential amino acids; 1% L-glutamine.
Cell Line Medium
BT474 Basic DMEM; 10μg/ml insulin
MCF10A** Basic DMEM/Ham's F12; 10μg/ml insulin; 20 ng/ml EGF; 0.5 mg/ml hydrocortisone
MDA-MB-157 Basic DMEM; 1mM Sodium pyruvate MDA-MB-231 Basic DMEM
MDA-MB-361 Basic DMEM; 1mM Sodium pyruvate
General characteristics of breast carcinoma cell lines used in this study is given in Table 2.11.
Table 2.11. Characteristics of breast carcinoma cell lines.
Characteristics of each cell line is given. ER: Estrogen Receptor, PR: Progesterone Receptor, HER2: Human Epidermal Growth Factor Receptor 2; BRCA1: Breast Cancer 1; WT: Wild Type; MU: Mutated; LA: Luminal A; LB: Luminal B; H: HER2 positive; TNA: Triple Negative A; TNB: Triple Negative B; AC: Adenocarcinoma; DC: Ductal Carcinoma; IDC: Invasive Ductal Carcinoma; MC: Medullary Carcinoma; NT: Non-tumorigenic and N/A: Not Available (Table adapted from (27).
Cell Lines ER PR HER2 BRCA1
Mutation Subtype Tumor Morphology
BT20 - - - WT TNA IDC Epithelial
BT474 + + + WT LB IDC Epithelial
HCC1937 - - - MU TNA DC Epithelial
MCF10A - - - N/A NT Epithelial
MCF12A - - - N/A NT Epithelial
MCF7 + + - WT LA IDC Epithelial
MDAMB157 - - - WT TNB MC Mesenchymal
MDAMB231 - - - WT TNB AC Mesenchymal
MDAMB436 - - - MU TNA AC Mesenchymal
MDAMB453 - - + WT H AC Epithelial
MDAMB468 - - - WT TNA AC Epithelial
SKBR3 - - + WT H AC Epithelial
2.3. Methods
Plasmid Isolation from Bacterial Glycerol Stocks
Bacteria containing pCMV6 Entry and pCMV6 TAGLN overexpression vectors and bacteria containing GIPZ Empty shRNA and GIPZ TAGLN shRNA vectors glycerol stocks were stored at -80°C. Bacteria were initially grown in a smaller vessel to be a starter culture and after 2-3 hours, then were transferred to a larger vessel and grown for overnight. Plasmid DNAs were isolated from bacteria by using Qiagen Plasmid MidiPrep Kit according to the manufacturer’s instructions. Concentrations and A260/A280 and A260/A230 of DNA were measured by using NanoDrop.
General Maintenance and Handling of Human Cell Lines
All cell culture practices were performed in sterile environment by using sterile techniques under cell culture laminar flow hoods. Cells were preserved in sterile screw capped cryo-vials in liquid nitrogen tanks for long term storage. Before using them, the cells were thawed. The cryo-vial was heated until almost completely melted and the mixture was transferred to 37°C growth medium which was followed by centrifugation at 1500 rpm for 5 minutes at room temperature. After the supernatant was removed, the cell pellet was dissolved in growth medium and then transferred to T25 tissue culture flask. All cells were maintained in CO2 incubators with 5% CO2 and 37°C temperature. Cells were split or passaged to a larger tissue culture flask once they reached confluency. Cells were detached from the flasks by washing cells with 1X PBS and then treating them with 0.25% Trypsin/EDTA with volumes adequate to cover the entire surface. To freeze the cells, the detached cells were mixed with the freshly prepared freezing medium including 90% FBS and 10% DMSO. Later, cells were kept in -20°C freezer for 1 hour, in -80°C freezer for overnight and then transferred to liquid nitrogen tanks.
2000 Transfection Reagent. For control, siGENOME Non-Targeting siRNA #2 (Thermo Scientific) was used for the transfection of the cells. Cells were transfected by using reverse transfection protocol. For this protocol, 100 pmol of siRNA was diluted in 250 µl of Opti-MEM Reduced Serum Medium in wells of 6 well plate. 5 µl of Lipofectamine 2000 Transfection Reagent was diluted in 250 µl of Opti-MEM Reduced Serum Medium. After 5 minutes, diluted Lipofectamine 2000 Transfection Reagent was added to diluted siRNA in wells. The mixture was incubated at room temperature for 20 minutes. Later, 150,000 cells were added to the mixture in the wells. The silencing of TAGLN gene was assessed with qRT-PCR and western blot experiments.
Kill Curve Assay and Determination of Selective Antibiotic Concentrations
In order to determine the selective antibiotic concentration for stable cell line generation, cells were treated with varying antibiotic concentrations and then SRB assay was performed to calculate the survival percentage of the cells. For kill curve assay, 50,000 cells per well were seeded to each well of 24 well plate. One day later, the medium was aspirated from wells and fresh medium without antibiotics and with antibiotics at varying concentrations were given to the cells. Cells were treated for one week by changing media every three days. After one week, SRB assay was performed. For SRB assay, medium was aspirated from cells. Cells were washed with 1X PBS and then they were fixed with 10% ice-cold TCA for 1 hour at 4°C in dark. After one hour, cells were washed with ddH2O for 5 times and they were left to air dry. 0.04 g
of SRB dye was dissolved in 10 mL of 1% acetic acid to prepare the SRB solution which was added to the cells. Plates were incubated for 10 minutes at room temperature in dark. After 10 minutes, cells were washed with 1% acetic acid for 5 times and they were left for air dry. Finally, 300 µl of 0.5X TBS was added to the wells and then the absorbance values were read at 562 nm. The minimum concentration at which all the cells were killed were determined to be used for the stable clone generation.
Overexpression and shRNA Plasmid Transfection of Breast Cancer Cells
TrueORF-Gold pCMV6 TAGLN (Origene) vector was used for overexpression of
TAGLN gene in MDA-MB-157, MDA-MB-231 and MDA-MB-361 cells and GIPZ
Lentiviral TAGLN shRNA (Dharmacon) vectors were used for knockdown of TAGLN gene in MDA-MB-157 and MDA-MB-231 cells. TrueORF-Gold pCMV6 Entry (Origene) and GIPZ Lentiviral Empty shRNA (Dharmacon) vectors were used as control for overexpression of TAGLN gene and knockdown of TAGLN gene, respectively. For plasmid transfection, 250,000 cells were seeded per well to 6 well plates one day before. Next day, 1.5 µg of vector was diluted in 250 µl of Opti-MEM Reduced Serum Medium and 3 µl of Lipofectamine 2000 Transfection Reagent was diluted in 250 µl of Opti-MEM Reduced Serum Medium. 5 minutes later, they were mixed and the mixtures were incubated at room temperature for 20 minutes. Then, the mixtures were added to cells in 6 well plates. Medium was refreshed 6 hours after transfection. 3 days later, the cells were transferred to 100 mm cell culture plates in growth medium with selective antibiotics at the pre-determined concentrations. Single cells were allowed to form colonies by changing antibiotic containing media every three days. After colonies were formed, they were collected by colony rings and then they were grown and the cells were harvested for the validation of successful transfection. The cell clones were frozen for further use.
RNA Isolation and Determination of Quantity
The cells were trypsinized and collected with ice-cold PBS and centrifuged to collect the cell pellets. RNA isolation were performed from cell pellets by using MN Nucleospin RNA Kit as described in the kits’s user protocol. Concentrations and A260/A280 and A260/A230 of RNA samples were measured by using NanoDrop. Isolated RNAs were stored at -80°C for later use.
cDNA Preparation of RNA Samples
qRT-PCR and Expression Analysis
qRT-PCRs were performed in duplicates by using DyNAmoTM HS SYBER® Green qPCR Kit. The reaction volume was 10 µl which includes 2 µl of cDNA, 0.4 µl of the indicated primers (10 µM), 5 µl of master mix and 2.2 µl of nuclease free water. The reaction conditions were as follows: Initial denaturation at 95°C for 15 minutes, 40 cycles denaturation at 94°C for 20 seconds, annealing (Tms as in Table 2.7) for 20 seconds and elongation at 72°C for 15 seconds. Melting curve was performed at 95°C for 1 minute, at 55°C for 10 seconds and at 95°C for 30 seconds. The Ct values (cycle number at which the fluorescence exceeds the fixed threshold) of the duplicates were averaged and the expression values of the target gene were normalized to the housekeeping control gene GAPDH. The relative expression values were compared using the equation below. The qRT-PCR experiments were performed with Stratagene Mx3005P Real-Time PCR System.
Protein Isolation from Cell Pellets
The cells were trypsinized and collected with ice-cold PBS and centrifuged to collect the cell pellets. Depending on the size of the pellets, 30-100 µl cell lysis buffer (Table 2.9) was added to the cells on ice and they were mixed by pipetting. The mixtures were incubated on ice for 30 minutes with occasional vortex and then they were centrifuged at 13,000 rpm for 30 minutes at 4°C. Supernatant, the cell lysate containing proteins, was collected and stored at -80°C to be used in western blot experiments.
SDS-PAGE
10-12% gels were used for proteins, as shown in Table 2.12. 𝑅𝑒𝑙𝑎𝑡𝑖𝑣𝑒 𝑒𝑥𝑝𝑟𝑒𝑠𝑠𝑖𝑜𝑛
= 𝐸𝑓𝑓(𝑡𝑎𝑟𝑔𝑒𝑡)
−𝐶𝑡(𝑡𝑎𝑟𝑔𝑒𝑡)
Table 2.12. Constituents of SDS-Polyacrylamide Gel. SDS-Polyacrylamide Gel Preparation
Resolving Gel Stacking Gel Constituent 10% 12% Constituent 5% ddH20 3.9 mL 3.3 mL ddH20 3.4 mL 30% Acrylamide-bisacrylamide Mix 3.4 mL 4.0 mL 30% Acrylamide-bisacrylamide Mix 830 µl 1M Tris HCl (pH 8.8) 2.5 mL 2.5 mL 1 M Tris HCl (pH 6.8) 630 µl 10% SDS 100 µl 100 µl 10% SDS 50 µl 15% APS 100 µl 100 µl 15% APS 50 µl TEMED 4 µl 4 µl TEMED 5 µl
Gels were run in 1X running buffer (Table 2.9) at 80V for 15 minutes and at 120V until the loading dye reaches the end of the gel.
Western Blot
The proteins which were run in SDS-PAGE were transferred to nitrocellulose membranes by using wet transfer system (Bio-Rad) and wet transfer buffer (Table 2.9). Proteins were transferred at 150A for 2 hours. After the transfer, the membrane was incubated in blocking solution, including 5% skim milk powder in 1X TBS with 0.2% Tween-20 (0.2 % TBS-T) for 1 hour at room temperature on shaker (slow). After 1 hour, the membrane was transferred to primary antibody solution, including 5% BSA in 0.2% TBS-T and primary antibody (Table 2.4 and Table 2.5) for overnight at +4°C on shaker (slow). After the incubation, the membrane was washed three times with 0.2% TBS-T for 10 minutes each on shaker (fast). The membrane was transferred to the secondary antibody solution, including 5% skim milk powder in 0.2% TBS-T and secondary antibody (Table 2.4 and Table 2.6) for 1 hour at room temperature on shaker (slow). After the incubation, the membrane was washed again as before, and was developed using ECL prime system as described, visualization was performed in Amersham Imager 600.
Viability Assays
After 72 hours of siRNA transfections, the cells were seeded as 10,000 cells per well in 24-well plates in triplicates. Cells were left to grow for different time periods and then SRB assay was performed as described previously. Absorbance values were used as estimations for cell viability. The same experiments were also performed for stable cells containing TAGLN overexpression and control vectors. Statistical significance of differences between the absorbance values were determined with two-tailed t-test in GraphPad Prism 6.01.
2D Colony Formation Assays
After 72 hours of siRNA transfections, the cells were collected and 2000 cells seeded per well in 6-well plates in triplicates. The medium was changed every three days. Once the colonies were visible, the cells were fixed with ice-cold 100% Methanol for 10 minutes in freezer and they were stained with 0.5% crystal violet solution for 15 minutes at room temperature in dark. The wells were washed with ddH2O at least 5
times and left to air dry. Then, the photos of the wells were taken and the colonies were counted. Image J program was used to determine the number of the colonies. Statistical significance of differences between the numbers of the colonies were determined with two-tailed t-test in GraphPad Prism 6.01.
Co-immunofluorescence Staining of Breast Cancer and NT Breast Cells
Cells were plated onto cover-slips in 6-well plates, and allowed to settle and grow for two days to reach 50% confluency. Then, cells were fixed with 4% Formaldehyde in 1X PBS for 15 minutes under the hood, followed by 3 times wash with 1X PBS. Then the cell membranes were permeabilized by using 0.25% Triton X-100 in 1X PBS for 10 minutes at room temperature. After washing 2 times with 1X PBS, plates were incubated with blocking solution, including 5% BSA and 0.1% Tween-20, for one hour at room temperature. Plates were incubated with primary antibody solutions, including
including 1% BSA and 0.1% Tween-20 and secondary antibody (Table 2.4 and Table 2.6), for 1 hour at room temperature. The washing steps were repeated as before, and finally the slides were washed with ddH2O, removed from the plates and they were
mounted using 10 µl of mounting medium (Santa-Cruz).
FACS Analyses
200,000 cells were plated in wells of 6-well plates and were grown in normal growth conditions for 24 hr. After 24 hr, cells were trypsinized and collected in PBS, followed by centrifugation at 13000 rpm for 10 minutes at +4°C. After the PBS was discarded, 300 µl of 1X PBS was added onto the pellets. The tubes were vortexed vigorously, while at the same time 700 µl of ice-cold 100% Ethanol was added drop-wise. The tubes were incubated on ice for 30 minutes with occasional vortex. Cells were centrifuged at 13000 rpm for 10 minutes to remove supernatant which was followed two times wash with 1X PBS and centrifugation. Then, the cell pellet was dissolved in 1X PBS and then transferred to +4°C for storage or were directly stained with propidium iodide (PI). For staining, RNase A at the final concentration of 20 µg/mL was added and the mixture was incubated at 37°C for 15 minutes. Then, the mixture was centrifuged at 13000 rpm for 10 minutes and dissolved in 1X PBS. PI solution (0.5 µg/mL) at the final concentration of 40 µg/mL was added and the cells were incubated at room temperature for 30 minutes in dark. After the incubation was completed, the cells were used to perform FACS analyses.
Statistical Analyses
All statistical analyses were performed in GraphPad Prism 6.01 software. Comparison of data for 2D colony formation and viability were performed with two-tailed t test or one-way ANOVA or two-way ANOVA where applicable.
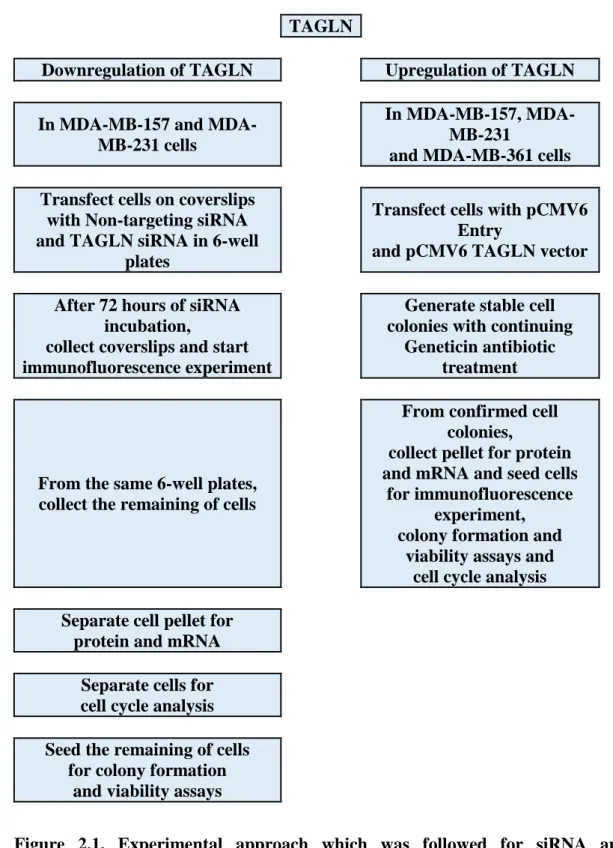
Experimental Approach
TAGLN
Downregulation of TAGLN Upregulation of TAGLN
In MB-157 and MDA-MB-231 cells
In MB-157, MDA-MB-231
and MDA-MB-361 cells
Transfect cells on coverslips with Non-targeting siRNA and TAGLN siRNA in 6-well
plates
Transfect cells with pCMV6 Entry
and pCMV6 TAGLN vector
After 72 hours of siRNA incubation,
collect coverslips and start immunofluorescence experiment
Generate stable cell colonies with continuing
Geneticin antibiotic treatment
From the same 6-well plates, collect the remaining of cells
From confirmed cell colonies,
collect pellet for protein and mRNA and seed cells
for immunofluorescence experiment, colony formation and
viability assays and cell cycle analysis
Separate cell pellet for protein and mRNA
Separate cells for cell cycle analysis
Seed the remaining of cells for colony formation
and viability assays
Figure 2.1. Experimental approach which was followed for siRNA and overexpression transfection.
Chapter 3. Results
3.1. Immunofluorescence Staining of Breast Cancer Cell Lines
Various breast cancer cell lines and non-tumorigenic cell line were stained with Anti-TAGLN antibody and different Epithelial to Mesenchymal Transition (EMT) markers. The characteristics of the breast carcinoma cell lines used are given in Table 3.1. In this study, E-Cadherin and Occludin were used as epithelial cell markers whereas N-Cadherin and Vimentin were used as mesenchymal cell markers.
Table 3.1. Summary table of staining with TAGLN and EMT markers in breast carcinoma cell lines.
-: Non-stained due to low expression; NS: No staining with the indicated antibody and + or ++ or +++: Staining degrees from low to high.
Cell Line TAGLN E-Cadherin N-Cadherin Occludin Vimentin
BT-474 ++ +++ NS NS -
MCF-12A ++ + NS NS ++
MDA-MB-157 +++ - NS NS +++
MDA-MB-231 ++ - NS NS ++
MDA-MB-361 + + NS NS -
Initially, epithelial BT-474 cells and epithelial MCF-12A cells were co-stained with EMT antibodies to assess the efficiency of EMT antibodies.
Co-immunofluorescence Staining of BT-474 Breast Carcinoma Cell Line
Co-immunofluorescence staining of BT-474 cells showed that TAGLN expression was more intense in nucleus where it co-localized with DAPI staining and it was also
Vimentin expression was not present in the same cells. Occludin and N-Cadherin were undetectable in the same BT-474 cells (Figure 3.1).
A)
C)
D)
Co-immunofluorescence Staining of MCF-12A NT Breast Cell Line
One non-tumorigenic epithelial breast cell line, MCF-12A, was also included to test the quality of EMT antibodies. Co-immunofluorescence staining of MCF-12A cells showed that TAGLN expression was observed throughout the cell body. MCF-12A cells displayed low E-Cadherin and high Vimentin expression contrary to the fact that it was reported as epithelial cell (24). Occludin and N-Cadherin were
A)
C)
D)
Figure 3.2. Co-immunofluorescence staining of MCF-12A cells.
Co-immunofluorescence Staining of MDA-MB-157 Breast Carcinoma Cell Line
Co-immunofluorescence staining of MDA-MB-157 cells showed that TAGLN expression was more intense in nucleus where it co-localized with DAPI staining and it was also observed throughout the cell body. MDA-MB-157 cells displayed high Vimentin expression which supported the mesenchymal characteristics of MDA-MB-157 cells. Epithelial marker E-Cadherin was not present in the same cells. Occludin and N-Cadherin were undetectable in the same MDA-MB-157 cells (Figure 3.3).
A)
C)
D)
Co-immunofluorescence Staining of MDA-MB-231 Breast Carcinoma Cell Line
Co-immunofluorescence staining of MDA-MB-231 cells showed that TAGLN expression was more intense in nucleus where it co-localized with DAPI staining and it was also observed throughout the cell body. MDA-MB-231 cells displayed high Vimentin expression which supported the mesenchymal characteristics of MDA-MB-231 cells. Epithelial marker E-Cadherin was not present in the same cells. Occludin and N-Cadherin were undetectable in the same MDA-MB-231 cells (Figure 3.4).
A)
C)
D)
Figure 3.4. Co-immunofluorescence staining of MDA-MB-231 cells.
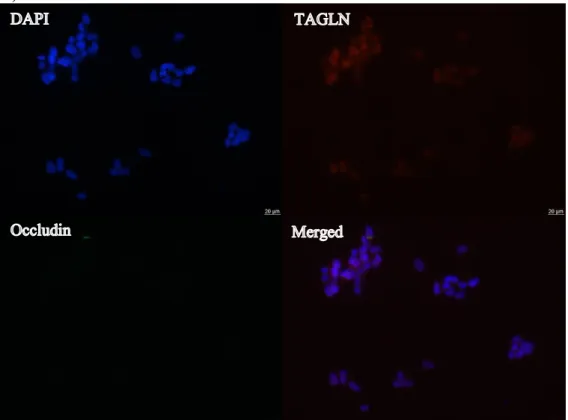
Co-immunofluorescence Staining of MDA-MB-361 Breast Carcinoma Cell Line
Co-immunofluorescence staining of MDA-MB-361 cells showed that TAGLN expression was low and it was observed throughout the cell body. MDA-MB-361 cells displayed medium E-Cadherin expression that supported the epithelial characteristics of MDA-MB-361 cells. Mesenchymal marker Vimentin expression was not present in the same cells. Occludin and N-Cadherin were undetectable in the same MDA-MB-361 cells (Figure 3.5).
A)
C)
D)
Figure 3.5. Co-immunofluorescence staining of MDA-MB-361 cells.
3.2. Analysis of TAGLN Silencing in Breast Cancer Cell Lines
TAGLN gene was aimed to be silenced in MDA-MB-157 and MDA-MB-231 cells by stable transfection by using GIPZ-TAGLN vectors. Although the cells were transfected successfully and showed green fluorescence signal, TAGLN gene silencing could not be maintained in the cells in the long run with selection medium. It was also observed that cells which were transfected with Empty shRNA vector showed more decrease in TAGLN expression compared to the cells which transfected with TAGLN shRNA vectors (Data not shown).
Therefore, it was decided to use siRNA transfection for gene silencing.
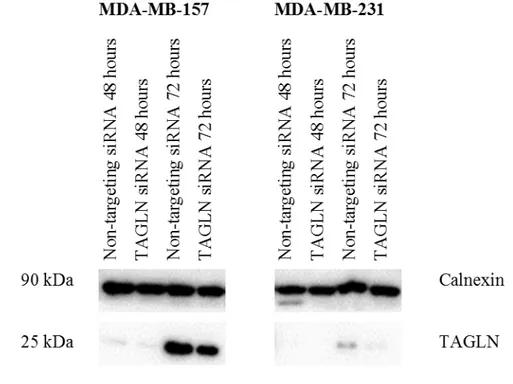
TAGLN gene was transiently silenced in MDA-MB-157 and MDA-MB-231 cells by siRNA transfection. The cells were collected after 48 and 72 hours of siRNA treatment and analyzed with Western Blot. At 48 hours, TAGLN expression was very low in both Non-targeting siRNA transfected and TAGLN siRNA transfected cells. Long exposure did not reveal any better quality. It was concluded that at 72 hours TAGLN siRNA treatment is better in decreasing TAGLN expression and used to perform further experiments (Figure 3.6). TAGLN protein expression reduced by 35% in MDA-MB-157 cells and by 51% in MDA-MB-231 cells when compared to Non-targeting siRNA treated cells (Figure 3.7).
Figure 3.6. TAGLN gene was silenced in MDA-MB-157 and MDA-MB-231 cells with TAGLN siRNA after 72 hours of treatment.
MDA-MB-157 and MDA-MB-231 cells were transfected with Non-targeting siRNA or TAGLN siRNA. Proteins were collected at 48 hours and at 72 hours. The experiment was performed once.
Figure 3.7. TAGLN gene silencing was quantified in MB-157 and MDA-MB-231 cells with TAGLN siRNA after 72 hours of treatment.
Quantification was performed only for samples at 72 hours since at 48 hours, the
1 1 0,65 0,49 0 0,2 0,4 0,6 0,8 1 1,2 MDA-MB-157 MDA-MB-231