Productivity of Labor
Siibidey Togan
According to Dollar and Wolff (1993) labor productivity indicates the extent to which a country can be a competitive low-cost producer while maintaining high wages. Total factor productivity (TFP), on the other hand, measures the output produced by given amounts of labor and capital together with a high TFP meaning that both capital and labor can earn large returns while the cost of production remains low. According to Dollar and Wolff (1993), a nation with high labor productivity and high TFP is one that can compete intema-tionally with high incomes and a high standard of living.
The purpose of this chapter is to provide evidence on productivity trends in MENA countries, analyze the determinants of productivity growth in those countries, and study issues related to macroeconomic stability. After studying the productivity of labor in Section 1, Section 2 concentrates on total factor productivity growth, and Section 3 deals with the determinants of total factor productivity growth. While Section 4 considers the effects of infrastructure, Section 5 concentrates on total factor productivity in Turkish manufacturing sub-sectors. Section 6 considers the effects of booms and busts on competi-tiveness and the chapter concludes with a summary of results.
1
1. Productivity of Labor
The economic performance of four MENA countries (Egypt, Morocco, Tunisia and Turkey) is shown in Table 12.1. During 1975, Turkey had the highest per capita income, followed by Tunisia, Morocco, and Egypt. During the period 1975—98 the highest growth rate of GDP was achieved by Egypt followed by Tunisia, Turkey, and Morocco. On the other hand, Egypt also had the highest population growth rate followed by Tunisia, Morocco and Turkey. That said the highest increase in per capita income was achieved by Egypt followed by Turkey, Tunisia, and Morocco. Thus, by 1998 Turkey. had the highest per capi-ta income level, followed by Tunisia, Morocco, and Egypt. Consideration of productivity figures, reveal that during 1975, Turkey had the highest
produc-tivity figure followed Tunisia, Morocco, and Egypt. During the period
1975-1998, the highest productivity increase was achieved by Egypt, followed by Turkey, Tunisia, and Morocco. By 1998, Turkey once again had the highest
productivity figure, followed by Tunisia, Morocco and Egypt.
Sz'ibidey Togan .883 «:3 335 .6239. NmN SN 0: and m _m6 momd o3; coo“_ mime may—SH mim VNN owe vmwfi momxu mwfim mNmJ cemnmmmd Emma—E. 3N mod mm.m wmmfi mmn.~ mmm; oma ooo finfi nm 08902
03
SN
36
83
wt:
82
a?
8336
Emm
mg 733 33-5.3 mam—-33 33 m3" wag mpg :3 3.8m .895 gun—snow new am: mag Am mag aw: mam @mD may gun—23m ho 8mm .3 35— .3 83m «53283 33395 2.5283 Emu—SUV 539.0 53q 539—0 figuuscem 33526o 2:35 2:3:— ucnaa .885 «:93 hon— nznau hemmafia—:50
dim—Z
E
5330
fiEc—Su
fl
.8
233:5—
ofiam
”fifl
min?
386Productivily of Labor
In this chapter, we address the questions of what accounts for cross coun-try differences in the levels and growth rates of labor productivity, as well as
growth differences in labor productivity over time. To study these problems we
'consider the basic production relation:
Q = A K“ (HL)“
where Q denotes output, K is capital, L is labor, H is index of labor quality, A denotes technical progress, 0t indicates the output elasticity with respect to capital, and [3 is the output elasticity with respect to labor. Under constant returns to scale, which we assume, these weights are given by the shares of these two inputs in aggregate output. Productivity of labor is given by:
(Q/L) =A (1%)“ OH)"
(1)
where B = (I-OL). Denoting by q = (Q/L) the labor productivity, k = (K/L) the capital-labor ratio, q the growth rate of labor productivity, A the growth rate of technical progress, It the growth rate of the capital-labor ratio and H the growth rate of labor quality. We arrive at:
q'=A+o¢ic+(1—oc)H
(2)
The equation reveals that if a country wants to increase its competitiveness through increases in productivity, it has to increase any of the following three sources of growth or a combination thereof:
0 k, growth in the amount of capital per worker in the economy (capital
deep-ening)
0 H, improvements in the labor quality
0 A, total factor productivity (TF P) growth.
It has been shown by various economists that over the long run rapid
eco-nomic growth does not take place without large investments in fixed capital.
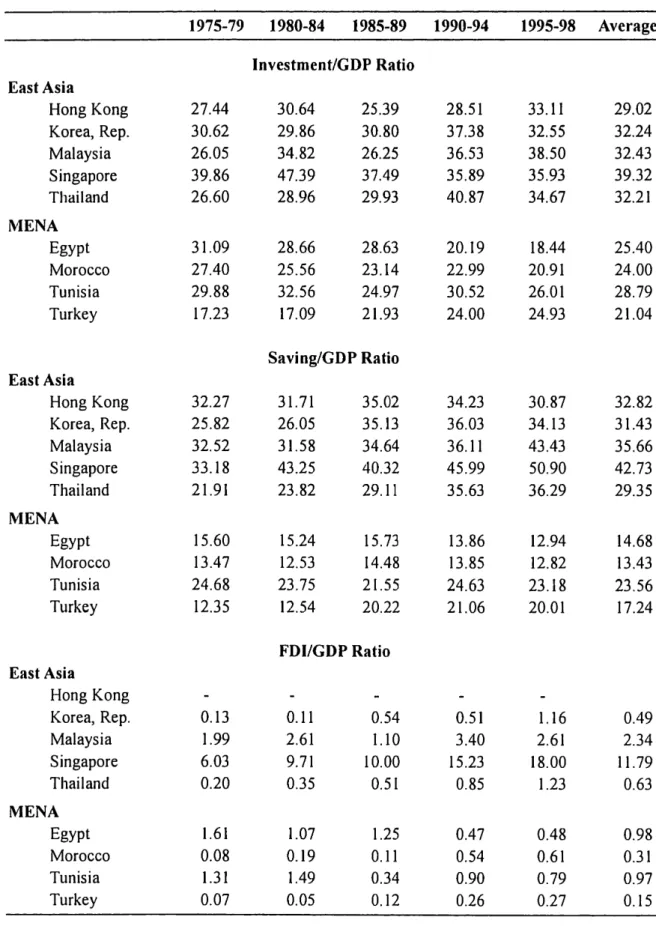
MENA countries are no exception, and in order to grow they need high rates of investment so that the amount of capital per worker grows over time. Table 12.2 shows that investment rates in MENA countries have been substantially lower than those in East Asian countries. Over the period of 1975—98, the aver-age value of the investment/GDP ratio equaled 39 percent in Singapore, 32 percent in Korea, Malaysia and Thailand, and 29 percent in Hong Kong. On the other hand, the average investment/GDP ratio equaled 29 percent in Tunisia, 25 percent in Egypt, 24 percent in Morocco, and 21 percent in Turkey. Whereas the investment rate increased in East Asian countries over the period of 1975—98 the investment rates have declined in Egypt, Morocco and Tunisia.
Sfibia’ey Togan
Table 12.2: Investment, Savings, FDI and Current Account
to GDP Ratio in East Asian and MENA Countries
1975-79 1980-84 1985-89 1990-94 1995-98 Average Investment/GDP Ratio East Asia Hong Kong 27.44 30.64 25.39 28.51 33.11 29.02 Korea, Rep. 30.62 29.86 30.80 37.38 32.55 32.24 Malaysia 26.05 34.82 26.25 36.53 38.50 32.43 Singapore 39.86 47.39 37.49 35.89 35.93 39.32 Thailand 26.60 28.96 29.93 40.87 34.67 32.21 MENA Egypt 31.09 28.66 28.63 20.19 18.44 25.40 Morocco 27.40 25.56 23.14 22.99 20.91 24.00 Tunisia 29.88 32.56 24.97 30.52 26.01 28.79 Turkey 17.23 17.09 21.93 24.00 24.93 21.04 Saving/GDP Ratio East Asia Hong Kong 32.27 31.71 35.02 34.23 30.87 32.82 Korea, Rep. 25.82 26.05 35.13 36.03 34.13 31.43 Malaysia 32.52 31.58 34.64 36.11 43.43 35.66 Singapore 33.18 43.25 40.32 45.99 50.90 42.73 Thailand 21.91 23.82 29.11 35.63 36.29 29.35 MENA Egypt 15.60 15.24 15.73 13.86 12.94 14.68 Morocco 13.47 12.53 14.48 13.85 12.82 13.43 Tunisia 24.68 23.75 21.55 24.63 23.18 23.56 Turkey 12.35 12.54 20.22 21.06 20.01 17.24 FDl/GDP Ratio East Asia Hong Kong - - - - -Korea, Rep. 0.13 0.11 0.54 0.51 1.16 0.49 Malaysia 1.99 2.61 1.10 3.40 2.61 2.34 Singapore 6.03 9.71 10.00 15.23 18.00 11.79 Thailand 0.20 0.35 0.51 0.85 1.23 0.63 MENA Egypt 1.61 1.07 1.25 0.47 0.48 0.98 Morocco 0.08 0.19 0.11 0.54 0.61 0.31 Tunisia 1.31 1.49 0.34 0.90 0.79 0.97 Turkey 0.07 0.05 0.12 0.26 0.27 0.15
Source: Wo'rld Bank (2000).
Productivity of Labor
In a closed economy, saving is the only source of investment, and savings and investment, by definition, must be equal. But in an open economy,
invest-ment can be financed by borrowing from abroad as well as using saving of
for-eigners. In an open economy, CA = S — I where CA refers to current account, S to savings and I to investment. Thus, I > S implies a current account deficit. In that case, the country must be running down its assets or accumulating foreign liabilities. In MENA countries, the average saving/GDP ratio amounted to 24 percent in Tunisia, 17 percent in Turkey, 15 percent in Egypt, and 13 percent in Morocco. Since savings rates have been substantially lower than investment rates in MENA countries these countries resorted to foreign savings. On the other hand, in East Asian countries the average value of domestic savings rate was 43 percent in Singapore, 36 percent in Malaysia, 33 percent in Hong Kong, 31 percent in Korea, and 29 percent in Thailand. Foreign savings have con-tributed to domestic investment financing only in Korea and Thailand. Other East Asian countries have been net investors in foreign countries.
The data reveal that the MENA countries, in order to accelerate productivi-ty growth, have to increase not only their investment ratios but also their domes-tic savings rates as too much reliance on foreign savings over long period of time may cause problems of solvency and sustainability. Since a current account deficit implies that the country is running down its foreign assets or accumulat-ing foreign liabilities, the current account equals the change in the net interna-tional investment position of the country. When the difference between the stock of foreign assets and liabilities is negative, the country is a net debtor to the rest of the world. If the country is a net debtor then— in principle— the economy must at some point in the future run current account surpluses that have a pre-sent discounted value equal to its debt. The ability of the country to generate future current account surpluses sufficient to repay existing debt is known as solvency. Thus a country is solvent if the present value of future current account surpluses is at least equal to its current external debt. On the other hand sustain-ability is a more complicated concept. Here we assume the continuation of pre-sent macroeconomic policies into the future. The current stance of policies is said to be sustainable if its continuation into the future does not violate the sol-vency constraint. If not, then the country is expected to face an exchange rate collapse or an external debt default, which in turn will imply a reduction in real income and employment during the adjustment period to sustainable policies, deviating from the long run growth path of the country.
Among external sources of finance, the most preferred one is unquestionably foreign direct investment. Table 12.2 shows developments in the foreign direct investment/GDP ratio. Whereas this ratio was 11.8 percent in Singapore and 2.3 percent in Malaysia the ratio equaled 0.98 percent in Egypt, 0.97 percent in Tunisia, 0.31 in Morocco, and 0.15 percent in Turkey. The data reveal that MENA countries have also not been successful in attracting foreign direct investment.
S z'lbidey Togan $.32 333223: 25 1, E132 koxmsssgnz 23... .332 93C wua PE 9.8m 6.958% Em mom 9% gm 2m 2: 2: Emma 3:30 825 wmd omm wé 5m 0.0 ms fimv 0.0 _.mm ooom on.“ omm 5m wd We ad 09. 0.0 0.3 32 cm; SN wN Nd fim We Em ma: mdm com: 8; 0? Wm w; 0% ad _.om m4; mdv mm? 9: m: QN o; w.m m6 Qmm v.2 Wmm cam“ 33 52 o; wd m.m _.v 05 0A: odm m3— ofio m2 ad 50 5m Tm wgm g: 9% 32 omd H2 md md 9m 0m o._m Q: mam $9 on; w: to md 5N Wm md— o.m_ Now 89 m9 md md n; Wm o8 ad fimw omfl hate. mm._ SN m6 ed ed m: a... wdm N; ooom om; ow. mg,” md 5m >6 v.2 odm Nov 32 Q: N: Qm vd ms w.m Qm 9: wdm oom— mmg 02 md md 0.0 v6 m6 0.9 new 39 32.0. m3 m2 Nd wé :V w.m v.2 fimn owe Q: o2 : _.o Nm NM N.m m6 5% 2.3 mud S: wd _.o w; o.m Wm m6 whm 33 mud n: 50 _.o v; 0; Wm 56 flow 32 N: 9o _.o ad N; n; v.m fima owe :Emizh SN mmm To m4 YE o.m_ o6 w.: flow ooom mw._ 2N ms 0; wd m.o_ v.0 o.m_ _.Nm 32 3.. _o_ m6 wd fiw Wm o6 Q: vwm emo— mo.m v: o6 9o ms m1. m.m Q: five 33 EM >2 ad 0d ago. 2“ Ne Wm 0.9 owe 3: ad v.0 w.m QN m: Tm Wow 2.2 $9t mew oz 8% oz new a Z w==oosum 85— x35 kiwi Emczcuom in firm oz 539.0 3530 EBEEoU 632950 952955 _m==:< Saun—
95225
82:83
$5.55
3
5:238
:32
£8
“55532
3:328:3—
umfi
2.3;
390Productivity of Labor
Table 12.4: Educational Attainment of Adult Population
in East Asia, 1975-2000 (percent)
Completed Completed Completed
No Primary Secondary Higher
Schooling No Yes No Yes No Yes
Hong Kong 1975 28.5 19.8 22.5 9.9 15.5 1.6 2.2 1980 22.5 16.7 23.1 13.2 17.3 3.0 4.2 1985 18.4 16.5 19.1 17.7 20.6 3.3 4.4 1990 15.7 14.5 15.8 17.8 25.5 4.5 6.2 1995 11.4 12.9 14.0 18.6 28.6 6.2 8.3 2000 10.7 12.7 13.9 18.7 28.7 6.6 8.7 Korea 1975 25.2 22.0 17.2 14.5 14.2 1.8 5.1 1980 19.7 17.4 17.1 18.2 18.7 2.3 6.6 1985 15.4 9.5 18.1 19.7 25.6 3.0 8.7 1990 11.0 0.8 20.9 18.9 35.0 3.5 9.9 1995 8.7 0.9 17.3 15.7 36.2 5.5 15.7 2000 8.0 0.8 15.9 15.0 34.5 6.7 19.1 Malaysia 1975 37.8 28.3 19.7 6.6 6.0 0.3 1.3 1980 34.3 21.4 23.0 10.1 9.8 0.2 1.2 1985 29.9 25.0 19.8 12.2 11.1 0.3 1.7 1990 25.6 21.8 22.7 13.2 13.9 0.4 2.4 1995 16.7 13.0 20.6 19.3 23.5 1.0 5.9 2000 13.9 13.8 21.8 19.4 23.6 1.2 6.3 Singapore 1975 40.7 20.8 11.4 16.0 8.1 1.0 2.0 1980 43.7 24.5 13.8 9.6 5.0 1.1 2.3 1985 35.3 24.8 15.3 13.2 7.1 1.4 2.9 1990 29.1 19.5 15.4 23.2 8.1 1.5 3.2 1995 14.3 11.2 16.5 36.8 13.7 2.4 5.1 2000 12.7 11.5 16.8 35.3 13.2 3.4 7.1 Taiwan 1975 29.6 20.7 24.0 9.2 10.8 2.8 2.9 1980 23.0 6.3 38.1 10.0 13.3 4.6 4.7 1985 19.3 13.8 24.9 13.6 17.4 5.4 5.6 1990 16.4 14.8 18.9 16.7 21.0 6.0 6.2 1995 14.2 13.1 16.9 17.8 22.4 7.6 8.0 2000 12.4 12.1 15.4 18.2 22.9 9.4 9.6 Thailand 1975 32.5 44.1 16.5 3.6 1.8 0.0 1.5 1980 20.5 67.3 2.4 4.5 2.3 0.0 3.0 1985 21.5 44.3 21.4 4.7 3.1 0.0 5.0 1990 22.3 34.7 27.2 4.5 3.5 0.0 7.8 1995 19.6 34.8 27.3 5.0 3.9 0.0 9.4 2000 17.3 34.9 27.3 5.2 _' 4.1 0.1 11.1
Source: Barm and Lee, (1994).
Table 12.3 shows the educational attainment of the adult population in MENA countries and Table 12.4 presents the same for East Asian countries,
derived from data obtained from Barro and Lee (1996). Comparison of the
fig-ures in the two tables reveals that the East Asian education system is superior
Siibidey Togan
to that in MENA countries. In 2000, the proportion of the adult population with no schooling in Egypt was 46.1 percent, with 41.2 percent in Tunisia and 28.1 percent in Turkey. On the other hand, the proportion of adult population with no schooling was 10.7 percent in Hong-Kong, eight percent in Korea, 13.8 per-cent in Malaysia, 12.7 perper-cent in Singapore, 12.4 perper-cent in Taiwan, and 17.3 percent in Thailand. The proportions of the adult population that had complet-ed secondary schooling were 12.4 percent in Egypt, 9.6 percent in Tunisia and six percent in Turkey. In East Asian countries, the corresponding proportions are 28.7 percent in Hong-Kong, 34.5 percent in Korea, 23.6 percent in Malaysia, and 22.9 percent in Taiwan. Similarly, the proportion of adult popu-lation with higher education is 9.4 percent in Egypt, 5.3 percent in Tunisia, and 4.8 percent in Turkey. The corresponding proportions in East Asian countries are 8.7 percent in Hong-Kong, 19.1 percent in Korea, 6.3 percent in Malaysia, 7.1 percent in Singapore, 9.6 percent in Taiwan, and 11.1 percent in Thailand. The above considerations reveal that in order to accelerate productivity growth the MENA countries have to considerably increase their investment in human capital formation. MENA countries have to increase not only the pro-portion of the adult population with primary, secondary, and higher education, but also the quality of education at each of these levels.
2. Total Factor Productivity Growth
To estimate TFP growth in MENA countries empirically we rearrange terms in equation 2 and obtain:
A. = q.- a/r- (1-0L) H.
The estimation of TFP growth thus requires estimates of the series O” K., L.,
and H., as well as an estimate of the parameter 0L. Once the residual A is
obtained for each of the time periods under consideration using the above rela-tion, these residuals are averaged over the entire sample period to give an esti-mate of the amount of variation in productivity growth that is unexplained by the growth rates of the factor inputs, i.e. TFP.
As an estimate of the size'of output elasticity with respect to capital,
denoted by on, Maddison (1987) uses on value of equal to 0.3 for industrial
countries. Young (1995) obtains a capital share of 0.32 for Korea, 0.29 for Taiwan, 0.53 for Singapore, and 0.37 for Hong-Kong. On the other hand Collins and Bosworth (1996) use a uniform capital share of 0.35 for all coun-tries under their consideration. Recently Senhadji (1999), who has estimated the technology parameter 0L econometrically using panel data for 66 countries over the period of 1960—94, maintains that the parameter. value equals 0.44 for East Asia, 0.65 for the Middle East, and 0.54 for the industrial countries.
Productivity of Labor
Let us now turn to the discussion ofthe series Q., K., L,, and H. for the coun-tries under consideration. In our calculations, we use output and capital stock
data expressed in terms of national currency. As output figures expressed in
terms of national currency, except for Turkey, we use the GDP figures
mea-3ured at constant domestic prices given by the World Bank (2000), and as
cap-ital stock figures expressed in terms national currency, we consider the Nehru
and Dhareshwar (1993) capital stock data extended to 1998 using the World Bank (2000) investment data and the perpetual inventory formula:
Kl : Kl-l + 11 ' 5 Kl-l (3)
where Il denotes investment during time period t and 5 indicates the constant depreciation rate of capital. Following Nehru and Dhareshwar, we assume that 8 = 0.04. In the case of Turkey, we consider the GDP and investment series measured in constant prices provided by the State Institute of Statistics. For the capital stock series, we use equation (3) together with an initial capital stock figure estimated in the following way: we assume, following Young (1995),
that the growth rate of investment in the first five years of the national
accounts investment series is representative of the growth of investment prior to the beginning of the series. In particular, the initial capital stock is estimat-ed by the formula:
K. = Z 1..-.(1- 6)’ = Z 1.,(1+g)-'-' <1-6)’ = o / (g + 6)
(4)
i=0 i=0
where I0 is the first year of investment data calculated as the average
invest-ment figure during the first five years of investment series, g is the average
growth of investment in the first five years of the investment series and
8 = 0.04.
For labor, again excepting Turkey, we use the labor force data provided by the World Bank (2000). In the case of Turkey, we use the employment data provided by Turkish State Institute of Statistics (2000). The index H is con-structed following the Barro and Lee (1994) methodology based on educa-tional attainment. It is defined as follows:
7 FIZZ/117T}
j=|
where it,- represents the share of the population that completed the level of edu-cation j (j varies from 1, corresponding to the share of population with no schooling, to 7, corresponding to post-secondary education) and 7t,- represents aggregation weights based on the observed relative earnings of the different educational groups. The relevant data on it,- and 2»,- are shown in Table 12.3, derived from the study by Psacharopoulos (1994).
Su’bia’ey T ogan 55.23539 m 5.55“ 60.28% mndm mmdfi mmdv wad 2._ omd mm; . mod wN._N wo._m w fihm 59o owd mm. adv or? wodm vw. 5 mm.— mm.— 32 SN fluom KAN 3.? m5?” mfmm o..wm N_.m amigo. >853. Nm._m omdm w Saw moém mndm mo.wm QWN wmloofl £25... omdm -Eu; om.wm -E. 3. mod moi 52 08052 :1. one. 3% was a? 2.? a... .3602 Ewm 55:55.35. 99359.5 .5?» 3:5.— owficoohom .m m: mud mm; m: mud a: N_.m amigo— 55... who wwd v: vod mod co; om.m gloom: «553. :1 -mm; NM.— -.2 ._ mod woioo. 08052 26 mm._ 55 omd .31 mm; oma malocfl 593m 59» 5.— 352— .535.5935 .< A“; 555.5550 555.5550 .333 553.— 25. A15: 5:. 5525.550 55.52550 5:. 55.5550 5525.550 .5320 3.96 23. SD: .335 35. 35 553.62.. FEED: EMF—5: mg n 29: EEG 3.6 n 955 .3550 cm... M 9:23 53550
9.9.5
is...
233
Ea
.3o
.335
335225-255
.5330 5352.595 .5 mouhsom 5.2 25.? 394Productivity of Labor «ma: ism 35k... .vd \o 33?. 3:33 .8\ 335:3 93 35:30 vim: SK KEN 3 SEEM KQD S 20.23138 mMaEmEmmc 88% «55 ESE 2: M23: 335.28 :85 33 AB: 8.5228 350 SKEB Rat zoNnflEEoU namuogzm EEKEQ 83:38 QUMO .8\ $2: SEEM bméuzhogm .33 C 8:3. 36 23% EEKmLu mugamxbmefizwogk Satan. a -N3 MEN 5&5 : -mom 5._ N «is; 8 -as S: 8852 m -3m 2: Ewm SEE -ow -mom 5.: Essfi -«m -mam SN diam: -mm ww S w? 3% 535 -mm N 2 Rd 0.8 eoammem -mm 2 2 $3 33 «Box -mm E a; wow 952 mac: £m< «mam -mm -m3 is. m: -mm -SN Zn v5 -S -8+ 5% 53 -we -Sm ta :2 -om -EN m; Emfioo .3 -mm -93 w; 85E ammo 8%: 63: was can—mac 560:8:— husum 55:032. staimom w==c> tin».— ESB 5320 9:895 “M $55.55 um 2:30 358.695 .:om:3m_.:._U PE; 3 5.59.0 ~90 3 corzfibgu ow fisubm
AER
E
5330
8
Era—£5.80
«wag—593m
ES
5380
figtuzucum
.bguuscem
6.2
Bash
395Sz'lbidey Togan
Based on this study we assume following Hall and Jones (1998) a rate of return of 13.4 percent for primary education. For secondary education we assume a value of 13.1 percent. Finally, for higher education, we use the value Psacharopoulos reports for the OECD, which is 6.8 percent. The values of the labor quality index are shown in Column 8 of Table 12.3.
Table 12.5 shows the productivity growth as well as the sources of pro-ductivity growth of the MENA countries for three different values of capital share, namely OL = 0.35, OL = 0.4 and CL = 0.45. Table 12.6 shows the levels of productivity, productivity growth, and percentage contribution to productivity growth by TFP in OECD, East Asian and MENA countries. The tables reveal the following aspects:
0 The productivity levels in MENA countries are generally low relative to
the productivity levels in OECD and East Asian countries.
0 The productivity growth rates in MENA countries are generally low
rela-tive to the growth rates achieved in OECD and East Asian countries.
0 The percentage contributions to growth of GDP by TF P in MENA
coun-tries are generally lower than those in OECD and East Asian councoun-tries. The labor productivity levels shown in Table 12.6 are from Hall and Jones (1999). Their data refer to the year 1988 and are derived from the Penn World Tables Mark 5.6 revision of Summers and Heston (1991). The table shows that productivity in MENA countries is generally much lower than those in East Asian countries. According to the table, the productivity in Egypt equals 49.2 percent of that in Korea, and 42 percent of that in Taiwan. On the other hand the productivity in Turkey equals 57.4 percent of that in Korea and 49 percent ofthat in Taiwan. Similar considerations apply to other MENA countries.
Comparison of average productivity growth rates in MENA and East Asian countries reveal that the Egyptian growth rate equals 68 percent of that in Korea, and 77.6 percent of that in Taiwan. Similarly, the Turkish productivity growth rate equals 64.5 percent of that in Korea and 73.6 percent of that in Taiwan. Whereas the productivity growth rates in Egypt and Turkey exceed
those in France, Germany, Italy, the UK and the USA the (growth rates in
Morocco and Tunisia fall short of the growth rate in France, Germany and
Italy. "i.
Table 12.6 further reveals that the percentage contributions to growth of GDP by TFP in MENA countries are very low relative to those in OECD and East Asian countries. Whereas the contribution of TF P to GDP growth is 64 percent in Italy and 35 percent in Taiwan the contribution of TFP to GDP growth is 3 percent in Egypt , 11 percent in Tunisia , 21 percent in Turkey and 27 percent in Morocco. Thus the GDP growth in MENA countries is attribut-able mainly to capital accumulation, that is, accumulation of both physical and human capital. On the other hand Table 12.8 shows that similar considerations
Productivity of Labor
hold for productivity growth. The percentage contribution of physical capital to productivity growth ranges between 48.1 percent and 61.8 depending on the value of the share of capital. Similarly, the percentage contribution of physical capital in Turkey varies between 38.1 and 49 percent. The percentage contri-bution of human capital contricontri-bution varies between 48.1 and 37.2 percent in
Egypt and 38.1 and 21.3 percent in Turkey.
3. Determinants of Total Factor Productivity Growth
The sources of TFP growth are better technology, better organization, gains
from specialization, and innovations on the shop floor. It has been shown by
various economists that among the factors determining TFP, the following two factors are of prime importance: (i) acquiring knowledge, and (ii) competitive pressure and prudent macroeconomic policies as measured by an index of openness and the inflation rate in the economy.
Firms and societies use technical knowledge to improve their efficiency in the production of goods and services. Sometimes they create the knowledge themselves while at other times they adopt knowledge created by others. To create knowledge, industrial countries invest considerable resources in research and development. Without a system that protects the rights of those
who create knowledge, it is unlikely that individuals and firms would spend as
much as they do. Patents provide such protection. They provide to knowledge creators with the legally-enforceable power to exclude others from using their knowledge for a specified period. However, the importance of the protection provided by patents differs among industries. Patents are more important in industries where products tend to be long-lived (such as pharmaceuticals and chemicals). In other industries with shorter products cycles (such as electron-ic products), firms prefer secrecy to patents as an exclusion strategy.
It is expected that stronger patent protection should lead to greater R&D efforts in countries that offer such protection. The benefits of patents go beyond stimulating investment in R&D. Developing countries often use knowledge produced in industrial countries. Without strong patent protection in the developing countries, firms in industrial countries have no incentive to transfer knowledge paterns in the developing world. The level and quality of patent protection in developing countries, therefore, influences both FDI and direct technology transfer through licensing agreements and the vertical
inte-gration of multilateral firms
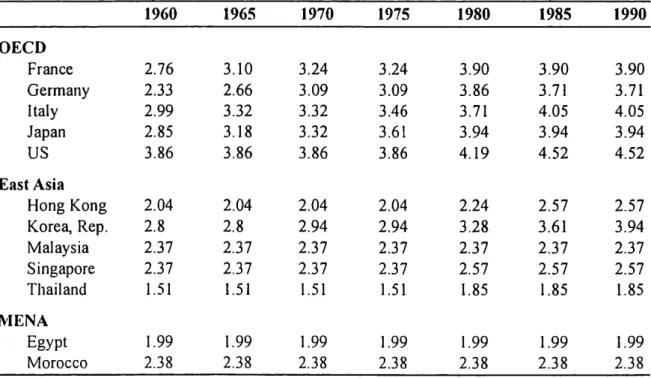
Recently Ginarte and Park (1997), who have quantified the levels of pro-tection across countries, constructed an index of patent rights by examining five categories of patent laws: (i) extent of coverage, (ii) membership in inter-national patent agreements, (iii) provisions for loss of protection, (iv) enforce-ment mechanism, and (v) duration of protection. The extent of coverage is
Sabidey Togan
measured by the patentability of pharmaceuticals, chemicals, food, plant and animal varieties, surgical products, microorganisms, and utility models. Under membership in international patent agreements, membership in the Paris Convention of 1883 (and subsequent revisions), the Patent Cooperation Treaty of 1970, and the International Convention for the Protection of New Varieties of Plants of 1961 have been examined. Provisions for loss of protection have concentrated on protection against losses arising from (a) working require-ments, (b) compulsory licensing, and (c) revocation of patents. Working requirements refer to the exploitation of inventions. Compulsory licensing requires patentees to share exploitation of the invention with third parties. On the other hand enforcement concentrates on the availability of preliminary injunctions, contributory infringement pleadings, and burden-of—proofs rever-sals. Here preliminary injunctions refer to pre-trial actions that require indi-viduals to cease an alleged infringement. Contributory infringements are actions that do not infringe a patent right but cause or otherwise result in infringement by others. Burden of proof reversals are procedures that shift the burden of proof in process patent infringement cases from the patentee to the alleged infringer. Finally, the duration of the patent is important for ensuring adequate returns on innovative activity. The index developed by Ginarte and
Park ranges in value from zero to five, and high values of index indicate
stronger protection. The index values for MENA, East Asian and OECD countries are shown in Table 12.7. The table shows that MENA and East Asian countries have not provided strong patent rights protection until recently.
Table 12.7: Index of Patent Rights, 1960-90
1960 1965 1970 1975 1980 1985 1990 OECD France 2.76 3.10 3.24 3.24 3.90 3.90 3.90 Germany 2.33 2.66 3.09 3.09 3.86 3.71 3.71 Italy 2.99 3.32 3.32 3.46 3.71 4.05 4.05 Japan 2.85 3.18 3.32 3.61 3.94 3.94 3.94 US 3.86 3.86 3.86 3.86 4.19 4.52 4.52 East Asia Hong Kong 2.04 2.04 2.04 2.04 2.24 2.57 2.57 Korea, Rep. 2.8 2.8 2.94 2.94 3.28 3.61 3.94 Malaysia 2.37 2.37 2.37 2.37 2.37 2.37 2.37 Singapore 2.37 2.37 2.37 2.37 2.57 2.57 2.57 Thailand 1.51 1.51 1.51 1.51 1.85 1.85 1.85 MENA Egypt 1.99 1.99 1.99 1.99 1.99 1.99 1.99 Morocco 2.38 2.38 2.38 2.38 2.38 2.38 2.38
Source: Ginarte and Park (I 997).
Productivity of Labor
The situation is expected to change after Egypt, Morocco, Tunisia and Turkey have signed the Agreement on Trade-Related Aspects of Intellectual Property Rights (TRIPS). On the other hand the OECD countries do provide strong patent rights with the US being the leader followed by Italy, Japan, France and Germany.
The index of patent rights developed by Ginaite and Park concentrates on statutory protection. But actual protection may differ from statutory protec-tion. Consideration of the case of Turkey reveals that new patent, copyright, trade mark and industrial designs laws came into effect in Turkey in June 1995. The laws are compatible with the TRIPS Agreement as well as with EU regulations as a requirement of the Customs Union Decision (CUD) of 1995. But Turkey still receives complaints about its lack of a patent enforcement mechanism. Efforts are under way to educate businesses, consumers, judges, and prosecutors regarding the implications of the laws. Turkey is in the process of establishing a number of special courts to hear intellectual proper-ty related cases under the new laws.
Table 12.8 shows annual patent applications by residents and non-resi-dents in OECD, East Asian, and MENA countries. The table reveals that the number of patent applications by residents in MENA countries is negligible compared to those in OECD countries. Only in Singapore is the number of patent applications by residents relatively large. Most of the patent applica-tions in East Asian countries and Turkey are from non-residents. For the rest of MENA countries even the number of patent applications by nonresidents is negligible.
Developing countries need local research in order to take advantage of the technological knowledge accumulated in industrial countries. Since the pri-vate sector in general is not willing to invest in R&D in developing countries, governments have tried to encourage it. Table 12.6 shows R&D expenditures as a percentage of GNP. The table reveals that the share of R&D in GNP is rather low in MENA countries compared to the levels in OECD countries, Korea and Singapore. Similarly, the number of scientists and engineers in R&D per million people is also low in MENA countries compared to the levels in OECD countries and Korea. The table shows that Korea, which has a significant industrial sector, has started to invest in industrial R&D. Other East Asian and MENA countries still do not feel the need for local research.
A second factor determining the TF P, aside from knowledge acquisition, is competitive pressure as measured by market concentration ratios, import
penetration rates and the index of openness of the economy. Competition
forces firms and countries to create knowledge themselves as well as
adopt-ing the knowledge created by others. Here the channels are mainly interna-tional trade, FDI, and licensing.
38% «5m 33k Sham 400 am 93 39.2 mm >35 2: 3 m2 one ms 3 22:5 3 2: .. .. SN om 885: com 3% mg 2: wow Ewm <zm2 E 3% m: 26 33 wmm Essfi .. .. .. m2 $18 $3 eoammam 8 3o ~26 a: 23222 38 39% 83 SN 32,3 3 «28“ .. .. .. .. ovum om m3 mcom £3 “am 38% cam“: cam SN 3&5: wowfimfl 3 $83 226 mixm 3.. 232 SEN v5 3&3 Saw 83V 32 53.8 33.5. 5:5 $3 $2; 23 SN 08% £3 22 23m «.83 53 12 $3: Nmoé 2250 .3 m.mmm.~ SEN $3. mam momma $3: 8:3 aumo am: SEE Gm: SEE 938; 55:: :5 £20 .8 {L 3528.52 2 3528: B mufiouom 35:;5— add 5 236:0a 223233.. 22333.: mooh own—woma— mooh own—021— mhovflmmzm Dam anon—an— thou-wan “Ea >2“t EB b.33— uu. 33:25 Su'bidey Togan
mourn
3:35
«Ea
533m
can
nn
fim
“mt—3.5
:c
Sun
225
is
«ENE
Productivity of Labor
Kawai (1994) maintains that trade and capital liberalization can bring about productivity growth that allowing enterprises to achieve economies of scale by taking advantage of market expansion, enabling them to absorb tech-nologies and knowledge through their participation in foreign markets, through importation of products incorporating advanced foreign technologies, and/or through foreign investment ventures. This, in turn, pressures them to reduce X-inefflciency in order to cope with competition from foreign enter-prises, and forces them to refrain from rent seeking behavior. At the market level, trade and capital liberalization spreads higher productivity through interindustry transaction and the spillover helps achieve efficient resource allo-cation as prices come closer to international levels, and this enables a country to import advanced capital goods as its exports expand, removing foreign exchange constraints. Furthermore, over the long term, learning effects will be brought about. Finally, licensing provides another mechanism for the transfer oftechnology. Table 12.8, which shows the licensing and loyalty payments of OECD, East Asian and MENA countries, reveals that the transfer of technolo-gy achieved through licensing in MENA countries has been rather limited. Licensing and royalty payments in Egypt amount to only 16.5 percent of those in Korea.
Asides acquiring knowledge and competitive pressure, the factors deter-mining TFP include macroeconomic policies. This is illustrated by Burnside and Dollar (2000) in their work on the effects of foreign aid on growth. They find that openness, sustainable fiscal policy, and low inflation are all con-ducive to higher growth. They develop a policy index that summarises the growth impact of openness and a country’s macroeconomic policies by regressing per capita real GDP growth on the budget surplus, the inflation rate, the openness dummy variable developed by Sachs and Warner (1995), and a set of institutional and policy variables. The authors estimate the model using a panel of 56 countries and six four-year time periods ranging from 1970—73 until 1990—93. The policy index is given by:
Policy = 1.28 + 6.85 x budget surplus — 1.40 x inflation + 2.16 x openness where the budget surplus is measured relative to GDP. The policy index mea-sures the per capita growth rate that a country’s economic policies would pro-duce if all other country characteristics were equal to their averages in the cross country database. A close consideration of the equation reveals that the openness dummy has a large impact on the policy index. Furthermore, the index can be negative if inflation is high, or ifthe budget deficit is very large. The authors emphasise that the mean value ofthe index is 1.2.
In the following, a basic model is introduced to elaborate statistically the relationship between the TFP and trade policies. We consider the case of
Silbidey Togcm
Turkey and use in the model a variable representing the stability of macro policies:
TFP = 00, + 0L. INFLATION + Otz OPEN + 0L3 BUDGET SURPLUS
where INFLATION refers to the rate of inflation measured by GDP deflator, OPEN indicate the trade indicator, and BUDGET SURPLUS denotes the budget surplus to GDP ratio. The second term in the equation indicates the effect of instability in macro economic policies. We hypothesize that instability in macro-economic policies may negatively influence productivity change, and therefore its coefficient should be negative. The third term refers to trade policies mea-sured by the ratio of exports and imports to GDP. The coefficient would be pos-itive if trade liberalization contributes to productivity enhancement. Finally, we hypothesise that budget surplus may positively influence productivity change. We consider data for the period 195—1999. The estimation yields the result:
TFP = 0.593 — 0.0713 INFLATION + 0.2454 OPEN + 0.6832 BUDGET SURPLUS
(0.477) (-2.741)
(2.693)
(1.996)
1951—1999; n = 49; R2 = 0.311; DW = 2.2686
The estimation results show that the variables have the expected signs. As hypothesized, instability in macroeconomic policies proxied by the inflation rate negatively influences productivity change. On the other hand, trade liber-alization and budget surplus positively effect productivity change, as in the Burnside and Dollar (2000) study.
Using the Burnside-Dollar index we note that Turkey would have very poor rates in the early 19803 for three reasons. First, according to Sachs and Warner (1995), Turkey was a closed economy until 1989. Second, the central government deficit averaged about five percent of GDP during the 19805. Third, the inflation rate hovered near 40 percent. Together, these facts imply a policy index of 0.4 in the 19805, well below the sample average of 1.2 across the 56 developing economies in the Burnside-Dollar data set. However, with the liberalization of trade and capital movements, Turkey had become an open economy by the 19905. To take full advantage of the impact of increased
open-ness on growth, Turkey must embark on a reform aimed at restoring sound
fis-cal policy and reducing inflation. Because of deteriorating fisfis-cal policy and inflation, Turkey’s policy index towards the end of the 19903 was barely above that of the average developing country.
4. Effects of Infrastructure
Infrastructural services such as transport, power, and telecommunications are intermediate inputs in production, and any reduction in these input costs
Productivity of Labor
raises the profitability of production, thus permitting higher levels of output and employment. These services also raise the productivity of other factors of production by reducing workers’ commuting time, and improving information flows through electronic data exchange. The contributions of infrastructure to economic growth derive not from the mere existence or creation of physical facilities but from their operation and the value of the services generated.
The World Bank (1994) emphasizes that increased globalization and intensified competition in world trade has resulted not only from the liberal-ization of trade policies in many countries, but also from major advances in communication, transport and storage technologies. These developments have transformed the traditional organization of production and marketing to focus on the management of logistics (the combination of purchasing, production and marketing functions) in order to achieve cost savings in inventory and working capital and permit rapid response to changing consumer demands. “Just in time” delivery to customers is projected to increase over time. Virtually all the improved practices that reduces logistical costs have been based in some way on information technologies using telecommunications infrastructure. The exigencies of modern logistical management in industrial countries impose similar requirements on other countries wishing to compete in world markets. Inadequate and unreliable infrastructure in developing countries cripples the ability of countries to engage in international trade. Thus, the adequate quantity and reliability of infrastructure are key factors in countries’ ability to compete in international trade.
Recently, global sourcing has created interwoven networks of intemation-al trade and industriintemation-al relations, in which businesses in severintemation-al countries
pro-duce different goods and services components of the same final product. The
information revolution and new technologies have made it possible to divide the industry’s value chain into smaller functions that can be contracted out to independent suppliers. This fragmentation of production offers developing countries an opportunity to move from servicing small local markets to
sup-plying large firms abroad and, indirectly, customers all over the world. Under
these circumstances, integration into the production and marketing arrange-ments of the multinational corporations has become the most efficient way to take advantage of the growth opportunities offered by the global economy. But this, too requires adequate and reliable infrastructure. Hence, the ability of countries to provide the transportation and communications services essen-tial for modern logistical management will increasingly determine their abil-ity to compete for export markets and foreign direct investment.
Empirical research on this topic has examined the infrastructural variable in terms of public gross capital expenditure, as a proxy for net increments to the stock of infrastructure facilities. By contrast Canning and Fay (1993) use physical measures of infrastructural networks (kilometers of paved roads and
Sfibidey Togan
railways, and number of telephones) to explain growth in a panel of 104 coun-tries at five-year intervals between 1960 and 1980. This study finds that both transportation and telephone systems have significant effects on growth rates. In a later paper, Canning (2000) uses panel data on a cross section of coun-tries to estimate aggregate production function, including infrastructure capi-tal. Other variables include physical capital, excluding infrastructural capital and human capital. Canning finds that the elasticity of output with respect to physical capital is around 0.37. For human capital in the form of education the
author finds an elasticity of around 0.1. For infrastructure he finds that
elec-tricity generating capacity and transportation networks have roughly the same marginal productivity as capital as a whole. However, telephone networks appear to have higher marginal productivity than other types of capital. The elasticity of output with respect to telephone stock is estimated as 0.14.
Table 12.9 shows measures of infrastructure provision in East Asian and MENA countries. From the table, it follows that the East Asian countries of Singapore, Hong Kong and Korea have better infrastructural capital than the MENA countries. In the case of paved roads, we note that during 1990, paved roads per square kilometer of the country’s surface area covered 4,446.8 meters in Singapore, 345 meters in Korea, 107 meters in Tunisia and 58.8 meters in Turkey. In terms of electricity production per capital production was is 5,774 kilowatt-hours in Singapore, 2,770 kilowatt-hours in Korea, 1,025 kilowatt-hours in Turkey and 754 kilowatt-hours in Egypt. Similarly, the number of telephone connections per 1000 people was 433.9 in Hong-Kong, 309.7 in Korea, 122.8 in Turkey and 16.7 in Morocco.
Table 12.10 provides recent and detailed information on international telecommunication comparators. From the table it follows that Korea had 20.5 million telephone lines in 1999 and that the telephone lines over the peri-od 1995—99 grew at the compound annual growth rate (CAGR) of 2.5 percent. On the other hand, during the same period Turkey had 18 million telephone lines and telephone lines over the period 1995—99 grew at the annual rate of 8.1 percent. While telephone lines per hundred inhabitants amounted to 57.6 in Hong Kong, 43.8 in Korea, 27.8 in Turkey, and 5.3 in Morocco, waiting time for telephone lines was zero in Hong Kong and Korea, 0.4 years in Turkey and 0.7 years in Morocco. Since competition is made more difficult with lower degrees of digitalization, we note that in Hong-Kong and Malaysia, 100 percent of the main telephone lines were digital. The ratio was 86 percent in Egypt and 84 percent in Turkey. Regarding tariffs we note that while connection costs amounted $147 in Egypt they were $13 in Malaysia. While monthly subscription costs amounted to $11.6 in Hong Kong the costs were $2.2 in Tunisia. Finally, charges per call in Malaysia and Singapore amounted to $0.02, and were $0.08 in Morocco.
Productivity of Labor .33: £53m 3.5: 6.320% N. 2 Sq w.mm_ mdm name; N.mmm 5N6 m _ fio w.wm o6». >823. ad. m.N_ Nfim Q: m.w$ <m 5—6 mid QR: own «633. mé Qm 52 9w v.03 fivmm wmod mwod N60 wdm 8352 _.m Ev w.Nm 2: <a 5m? vmmd wmod 0.3 0.9 “gm <75: 5.» mg. w.mm ms 5.0mm Wmmm mtd owed ”E. 0.3. cam—mash m. 5 m. G m.vwm vdmm méhfim m._vo.m 3N; mmwd ”03}. fie _ Hm Bonmwcmm 56 m6 fibw mdm N.wmm._ flown Pmd >56 Saw fimw 29332 :m o._ m Foom NHw wdofim 530; End momd owvm 062 83M .. Qow Qmmw w.mmm wdhofi N.o_m.m New; ovod méwm; odwo; wcoM 98$ 33 3mm 33 33 93— 33 :93 .53 33 33 £3. “mam Ea— .vmuhouofi v 9:32— .53 .89 A533 3m Enos-H3325: A333 .39 83.52%: €5— $333.5 3—3.: each—3m 3232.39 3 3:555 350335 332305 bfiaQaU 33% Exam 8:: 5.2: 03:92»; w fiuahgow 33.53% mood mm g.m $N.m¢wd wmm. Sm.— hvmfim www.mm o _ md— 3 fin www.mv Nmofim >813. EQN m_o.m w _ m.mom ooo.m: \lmmfi mafim vmm; wma oofit wag: EmEE. 832 Emma. 35 83 mmod «NS. 8m.” 33 92.3 Mann” 8832 $92 50.3 m.m mm 2 wmn. md— _ o mvmfim 08d h; _ ma: 59¢ 1m _ o “Em 42m: ovafi mmnfi mmqmm; ooodom ow flow 2 _.m_ mmnd o _ 06 o _ odm m $.mm cam—fin... 533; mm mm comma 892 8% 81m 83 Sum 83
Banana EEK omhfim oflxm >86 2: cm NN>€N ooodmm $3.3m.— gore. NNN.N
«Emmi—2 Sea mmfim . 9365.2 ooodmflm ov fiw: 03.9” omoém t.o_ mvmém 5%:
«Box wag Soda; 33.5% mm ..
30.2 $3 Rum 3:: $3 waox 95m £m< sun can 33 33 28“ 33 33 A53 33 can 33 $335355 $233339 .3 H2355 $.52— Amtaiczx .3 3.3325 9.835255 8.295 cue—3m 8:: :EE oncsnfl oh $3.325— .3 23525 53.230 2.3% 698m 33933.5 bmutuoflm grabs—ow 332.535—
:o_m_>c._m
Baasbmahnm
.3
8.5232
”3.2
23,—.
405Siibidey Togan .QQQQ 5:5 unobuomnzfiEou flmk 3223525 6.830% 03 3 gm 0.; to MEN 5 o.%o.w_ >35. 86 .3 OS 0.2: 3 od 92 $3 229; 86 3 3m 32 3 mm S 98} 8852 8d 2 9:: cow 3 2 3: v.33 “Em <32 86 3 cam 32 S 3 S: 0.2% Egafi 3o 3 a: 92: -a? E 353 ouoamwsm 86 mm of 92: 3 mom E 39% 2.3222 :3 § 3% a? -w? 2 S 38 $5M -0.: So 32 -3m 3 £32 waom meow Em< “mam— aa .32 a2 3; 8.: 3.5525 3.32 32 awe awe git: awe 8:: 22.33 A285 2: an ex; 3 =5 .26 55.82 5:825 5a: 5 2.5 ~55 Ea Enou— EunoEmoM 8:336 :3m $535 8:: essay—oh in: Maw—«H gonna—oh. .3 “Each
flea—“395:0
maouaum::EEouo_oH
"afiufi
Bank
406Productivity of Labor
The above considerations reveal that the MENA countries are lagging behind the East Asian countries in terms of infrastructure . Since adequate quantity and reliability of infrastructure are key factors in the ability of coun-tries to compete in international trade, it seems that MENA councoun-tries have to increase the quantity and reliability of infrastructure in order to increase the productivity of labor over time and to compete better for export markets and foreign direct investment.
5. Total Factor Productivity in Turkish Manufacturing Sub-sectors
Among the MENA countries the only country that has relatively reliable data on manufacturing sub-sectors is Turkey. We therefore consider in the follow-ing the case of Turkey. Our data come from “Annual Manufacturfollow-ing Industry Statistics,” “Small Manufacturing Industry Statistics” and the 1996 input-output table, all published by State Institute of Statistics. The first survey
covers all firms in the public sector, and private firms employing ten or more
employees while the second survey covers all private firms employing less than ten employees. Table 12.11, using the survey results for 1998, reveals that the sectors with the highest shares in total value added of the manufacturing sector were “petroleum and coal” with a share of 14.49 percent, “textiles” with a share of 12.67 percent, “food processing” with a share of 11.09 percent, and “basic metals” with a share of eight percent. In terms of employment, the sec-tors with the highest shares in total manufacturing employment were “tex-tiles,” with a share of 18.7 percent, “food processing” with a share of 14.69 percent, “apparel and footwear” with a share of 10.2 percent, and “metal prod-ucts” with a share of 8.14 percent. The sixth column gives the share of 1998 public sector value added in total value added of the corresponding manufac-turing sub-sector. From the table it follows that the average share of public sector in manufacturing industry was 22.55 percent. “Petroleum and coal” had the highest share with 93.98 percent, followed by “beverages” industry with a share of 45.52 percent, and the “tobacco” industry with a share of 44.67 per-cent
Columns 7 and 8 of Table 12.11 indicate exposure to international trade. Column seven provides a measure of competitiveness on the domestic market, measured by the rate of import penetration. If Q, X and M stand, for the sec-toral output, exports and imports respectively, the domestic demand D will be equal to D = Q — X + M, and the rate of import penetration will equal [M * 100 / D]. A low level of penetration does not necessarily mean that there are barriers to entry. The table reveals that the “professional and scientific mea-suring equipment” sector had the highest import penetration with 80.34 per-cent, followed by the “machinery” sector with a share of 55.57 perper-cent, and “chemicals” with a share of 47.29 percent.
Subidey Togarz .EQ.=G~EU\UU mk0£~3v~ .dUkaom. a...” 2.2 2.2 2.2 3.2 0.23. 8. :33. 8. 3.2.2. 2:22.252 m 2.8 8.2 8.2 2... 2 2.... an... 3.... $2 822... 2.5.8252 sec 2 o2... 8.: 2.2. 3.... $2. on. 3 S... E. : 5.. :2. .3 2:33... .8 2... 38.3%... 2; o2... 2 .2. 2.2 8.2 2... 2... m2. 8... 80.2. 8... 3.2.” .5553 :32“; 2: O2... 23 3.8 $2 32. 8.. 02. 2 ... “2.2 8.“ 32% .5252. .8532 2m 02... 5.5 a...“ n; 2.2 2... 3.. am $32 2.... :2.” Sign: 2m 02... 8.2 8.2 NS 2.... 25 9mm 2... 20.2.. 8... 38.” 8.62...302 .mm 2.2 .2” 2:... 3.5 22... 2.3 2:... 2... «5.2 8... 385 2%... 0.3m 2 2.2 8.2 2.2 2.... 2... Mn. «.2. .3 02.8. N3 223 25... 2:92.782 2“ N8... 58 2.2 3.2 8.2 8.0 0... m2 23.2 .2 ”.82 82.9.. 2.3... 2... 52.3. 332 2.3 Now 2.2 NS 3.2 3.8 3.2.0 2... :92 2.... ~23 .80 2.... 53.2.... $32 5... a...“ 8.2 2.... 2.2. 2.... .68 3% 23.. 2: 235 28.5.6 2?.mm 23 8.2 2.: was a: a... £2 02 05... SN 32.. 3.62.. a... .2... E 2.3. 6.: 38 a... 2.... 8... 3 a... 2...: 8.. S2. 3.2.... 2... 2.2.5. N: Mam... 2.3 2.... 3.” 2.... 2... w..N .3 2.3.. 3.. n. 2. 32.2.. 28 2a .303 .mm .2... 2.2 mm..v 2.2 on: 8... o... 2.... 5.... a... 22 3.62...053. 2... 5.. 2m 02.... 2.2 2.... 2.8 2.2 2.. on 8.2 23: a... .22 .3282 .2... 33... 2.503 £32 2 .... 2.2 .92 8.2 2.: EN 2... 2.2 252 5.2 3E 3.23 .2 .8... 8.2 3.... 2.2 2.... $3. 92; 2.. ME...“ 2.. 2.8 88...: 2 m 2.3 a... 2.: “EN 2.... 2.2. 9.2. .2. E2 2.~ .23 32.2.8 2m 22: 3.3 2.2 2.2 2.2 on... 3% 2.... 2...m 8... 32% 2.389.. .3... 2m: .m as. .32.... 2.3» 2.2 2.2 2.2 Q... 22... m2: 3... .32 G... 22... ”we 32.2....
0.2 :3 2:...» 333 fim Eufiao—n EofihoE—nm 93— 2.3» uocvc. 5.5.52»..— 23m 5:52.590 ho .893 E 5.223.509
9:25 23 3:32:85 3 tong”.— tonnz 3.33m Eon. 32$ .52 :33 .52 .53 335. PEmOn—HH E 5335 035’ E bosom E bosom o:_u> we 83— “:3...— ._o 2:25 .833 9:2:— uo 9:25 be 9:25 waQH aQH—m—uU—um w—Shn—Hufiwn—E flz Emu—MPH. MO moummhuao flhfl n—U ”HH.NH o—Dflh. 408
Productivity of Labor
On the other hand Column 8 of Table 12.11 gives the export ratio defined as [X * 100 / Q]. It follows that the sector “apparel and footwear” had the highest export ratio with a share of 56.58 percent, followed by “beverages” with 26.32 percent, and “basic metals” with a share of 21.34 percent. Finally column nine gives the rate of exposure to international competition defined as [(Export Ratio) + [1 — (Export Ratio/ 100)] * Import Penetration]. The con-struction of this indicator rests on the idea that the exported share of produc-tion is 100 percent exposed and that the share sold on the domestic market is exposed in the same proportion as the penetration of the market. The table reveals that the sector “professional and scientific measuring equipment” had the highest exposure to international competition with an index value of 83.23 percent, followed by the “apparel” sector, with an index value of 61.89 per-cent, and the “machinery” sector, with an index value of,59.91 percent.
In the calculation of TFP we consider the “Annual Manufacturing Industry Statistics” for the period 1970—98 and abstract from consideration of the “Small Manufacturing Industry Statistics,” as the latter data are available from 1992 onwards. We deflate the value added series, measured in current price, by the manufacturing sector value added defiator derived from the national accounts statistics. We deflate the investment series measured in cur-rent prices by the price deflator of investment goods obtained from national income statistics. To derive the capital stock series, we use the real investment series together with equations (3) and (4).
To obtain the depreciation rates of capital in the various sub—sectors of manufacturing used in equation (3) we note that, according to the State Planning Organization (1977), the economic life of buildings in Turkey is 33 years, while that for machinery and equipment is 15 years. It is shown that about two-thirds of total investment is in machinery and equipment, and about one third in buildings and other construction, and that the economic life of buildings does not vary significantly between industries, but may for machin-ery and equipment. Following Krueger and Tuncer (1980), we scale the esti-mates of the economic life of machinery and equipment so that the weighted average is 15 years. We then multiply those estimates by two-thirds and add one-third times the length of life of buildings to form the estimates of each sector’s depreciation rates. The resulting depreciation rates are shown in Column eleven of Table 12.11.
To derive the TFP by sub-sectors of manufacturing we need estimates of the labor share in sectoral value addeds. Column 10 of Table 12.11 shows the 1998 value of the share of labor in sectoral value added obtained from “Annual Manufacturing Industry Statistics.” The table reveals that the average labor share in the manufacturing sector was 24.21 percent. The “Professional and scientific measuring equipment” sector had the highest share, with a share of 34.4 percent followed by the “transport equipment”
Sfibidey Togan
sector with a share of 30.14 percent and “textiles” sector with a share, of 29.16 percent.
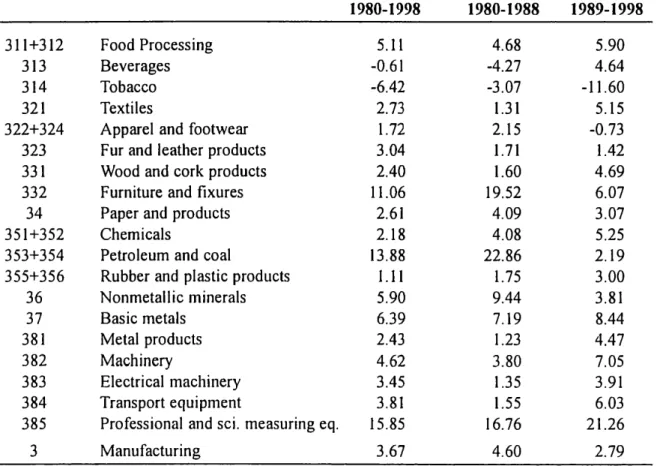
Table 12.12 shows the estimates of TF P in manufacturing sub-sectors over the period 1980—98. From the table it follows that highest TFP occurred in the sectors of “professional and scientific measuring equipment,” “petroleum and coal,” “furniture and fixtures” and “basic metals.” Of these sectors the “petro-leum and coal” seetor had the highest public sector share. The other sectors had a relatively high rate of exposure to international competition, as revealed by the data in Table 12.11.
Table 12.12: Total Factor Productivity in Turkish
Manufacturing Sector
1980-1998 1980-1988 1989-1998 311+3l2 Food Processing 5.11 4.68 5.90 313 Beverages -O.6l -4.27 4.64 314 Tobacco -6.42 -3.07 -11.60 321 Textiles 2.73 1.31 5.15322+324 Apparel and footwear 1.72 2.15 -0.73
323 Fur and leather products 3.04 1.71 1.42
331 Wood and cork products 2.40 1.60 4.69
332 Furniture andfixures 11.06 19.52 6.07
34 Paper and products 2.61 4.09 3.07
351+352 Chemicals 2.18 4.08 5.25
353+354 Petroleum and coal 13.88 22.86 2.19
355+356 Rubber and plastic products 1.11 1.75 3.00
36 Nonmetallic minerals 5.90 9.44 3.81 37 Basic metals 6.39 7.19 8.44 381 Metal products 2.43 1.23 4.47 382 Machinery 4.62 3.80 7.05 383 Electrical machinery 3.45 1.35 3.91 384 Transport equipment 3.81 1.55 6.03
385 Professional and sci. measuring eq. 15.85 16.76 21.26
3 Manufacturing 3.67 4.60 2.79
Source: Author It calculations.
Chapter 3 on “Trade and the Foreign Exchange Regime in Turkey” showed that the import regime in Turkey was very restrictive until the 19805. Until 1981 annual import programs that itemized commodities under the lib— eralization list, the quota list, and a list enumerating the commodities to be imported under bilateral trade arrangements, regulated all imports into Turkey. Importation of goods not enumerated in any of the lists was prohib-ited. In 1981, the quota list was partially phased out. A major reform was introduced in January 1984, when the country adopted the negative list
Productivity of Labor
approach. Liberalization of foreign trade intensified during the period of 1988—89 when nominal protection rates (NPR) were reduced substantially. Thus the import regime was liberalized mainly after 1988. Furthermore, in .1989, foreign exchange operations and international capital movements were liberalized entirely. In line with the full convertibility of the Turkish lira, in 1990 banks were left completely free to determine exchange rates in their operations begining in 1990.
Since liberalization of trade and capital movements was achieved largely after 1988 we divide the period 1980—88 into two sub-periods: 1980—88 and 1989—98. Table 12.12 shows the estimates of TFP in manufacturing sub-sec-tors over these two periods 1980—88 and 1989—98. From the table it follows that during the post 1989 period the highest TFP occurred in the sectors of “professional and scientific measuring equipment,” “basic metals,” “machin-ery” and “transport equipment.” These are the sectors with relatively high exposure to international competition, as revealed from Table 12.11.
6. Macroeconomic Stability
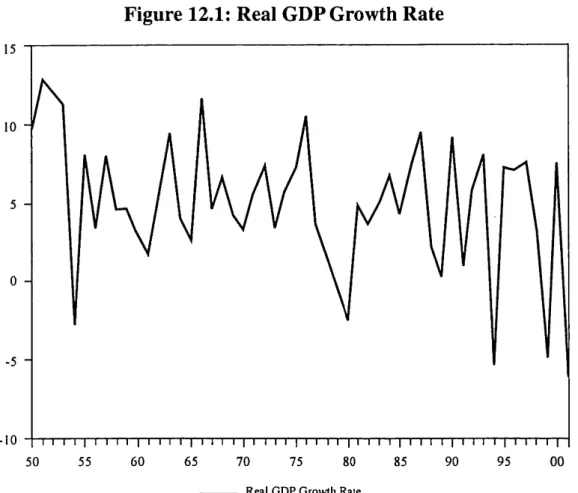
While the previous sections have concentrated on long run issues concerning the determination of TFP and TFP growth, we now turn to the analyses of macroeconomic stability and its effect on competitiveness. We consider the case of Turkey and analyze how periods of high GDP growth are interrupted by periods of balance of payments crisis, high inflation, and political unrest. We make an argument for 'the importance of macroeconomic stability for attaining sustainable increases in productivity and competitiveness.
Figure 12.1 shows the growth rate of GDP over the period 1950—2001. From the figure it follows that GDP growth in Turkey has been characterized by booms and busts. Although the average rate of growth has been 4.86 per-cent we note that Turkish GDP fluctuated considerably due to natural disasters in 1954 and 1999 and due to balance of payments crises in 1958, 1970, 1978—80, 1994 and 2001, with considerable effects on productivity. During 1954, the country faced a massive crop failure due to bad weather, and agri-cultural value added decreased by 13.5 percent. Since agriculture formed a high percentage ofGDP during the 19503, GDP during 1954 decreased by 2.87 percent. On the other hand, during 1999, Turkey was hit twice by severe earth-quakes. The earthquake disasters lead to a drop in GDP by 5.02 percent. By contrast, we note that the balance of payments crises of 1958, 1970, 1978—80, 1994 and 2001 were due to policy mistakes. The main policy mistakes com-mon to all the crises were the deterioration of public finances and appreciation of the real exchange rate for a period of several years before the crises. The crises led to the introduction of stabilization measures such as the depreciation
of the currency and stabilization of public finances.
Su'bidey Togan
Figure 12.1: Real GDP Growth Rate
10 “m
-lO IlillllllllllijfiillllIIIIIIIlllllilllllllllllfiilfil
50 55 60 65 70 75 80 85 90 95 00
Real GDP Growth Rate
In the following, we concentrate on the crisis, of2001. Among all the crises faced by the country during the last 50 years this was the severest. By 2001 Turkey had a high level of‘liability dollarization,’ with high public and private foreign debt, denominated in foreign currencies. Turkey also had a high share of foreign currency-denominated bank deposits in total bank deposits. With the sharp depreciation of the exchange rate, the gross and net indebtedness of the economy increased leading to bankruptcies in the banking and real sectors, and this detrimental effect of the depreciation of the currency more than offset the positive effect of depreciation on the demand for exports.
During 2001, GNP contracted by 9.4 percent and the loss of employment has been put at more than 1.4 million. The reasons for the crisis of 2001 are various. They can be summarized under the headings of deterioration of fiscal balances, banking problems, and mismanagement of the real exchange rates. Since the real exchange rate policy employed during the 19905 has been explained in Chapter 1, and the banking problems in Chapter 3 we turn now to
consideration of public finances during the 19903.
The public sector in Turkey consists of central government, revolving funds, social security institutions, extra-budgetary funds, local governments, non-financial state economic enterprises (SEES), and SEES under privatization. We
note that public finance management had peculiar features in Turkey. As late as
1999, a substantial part of the activities of the public sector were carried out by
Productivity of Labor semi-autonomous entities called budgetary funds and extra-budgetary funds. The activitities of the funds could be divided into four categories: (i) public consump-tion and investment, (ii) price regulaconsump-tion and control, (iii) transfers, such as sub-sidies and social security, and (iv) insurance and miscellaneous activities. In 1999, there were 83 different funds or fund-like institutions. The funds received their financing from the goverment budget, taxes, and user charges. They were also used to raise tax revenue for the central government budget. The degrees of auton-omy of the funds varied, but they were free from central govemment control to some extent, especially on the expenditure side.
As emphasized by Sak (2000) the fund system goes back to the 19303, but the system begun to be exploited in earnest in the 19803. It seems to have been a response to increasing needs for public services and to elfect structural change.
The regular public finance system was not used for this, because of the legal,
bureaucratic and political difficulties in raising taxes and redirecting public expenditures to new areas. The system got out of hand in the 19903, in response to the parliamentary situation.1 In addition to the funds, there were other entitites that could override central government control, such as SEE'S, local administra-tions, and social security institutions.
Since the financial problems of social security institutions have been analyzed
in Chapter 6 we concentrate in the following discussion on problems encountered by SEES and local administrations. In Turkey, the SEES have played a significant role since the early 19303. They have been and still are active in almost all sec-tors of the economy, playing a role in the provision of services, commodity trad-ing, banktrad-ing, mintrad-ing, the production of basic metals and chemicals, and defense. Initially, the SEES had performed well. But after some time they begun to Show poor economic performance. The reasons are related to the fact that SEES are not subject to Commercial Code, and therefore to the bankruptcy law, that standard reporting and auditing rules are not applicable for SEES, that management auton-omy in areas such as pricing, employment and investment decisions is restricted by formal or sometimes informal arrangements, that the law on SEES limits effec-tive performance monitoring and management autonomy, and that SEES receive substantial subsidies from the government in the form of direct transfers, equity injections, and debt consolidation. On the other hand the local governments com-prises provinces, large metropolitan municipalities such as those of Istanbul and Ankara and smaller municipalities. The municipalities have autonomy in setting their expenditure priorities. The expenditures of local governments are largely financed from their revenue Sharing arrangements with the central government. While local governments can in principle issue their own domestic bonds only the largest municipalities are able to issue their own domestic debt. In addition, municipalities borrowed from abroad with a central government guarantee, while the metropolitan municipalities borrowed for large projects from abroad without a central government guarantee.
Siibidey Togan .~ $3.55 5Emmo~m>mh «unoammu m5 M50: «$2.330 mug SSS 83a 23 muzu fiuu Bum my: sax 38-32 Erma 2: 3:23 $83 2: Exams Maggi 3.3 2: Ex ”Bazmzukmwm 2: 632 8.3 2H 8.». omega no.0w 0.Nm mwm méfl :0 0N o0.: ovd-Som wa.w0 m.0_ N00 w.m0 000 0+. 8.9 2.0 ooom $.05 5.2 QwS 060 040 :0-0.023 3.0. 32 om. S 0.: 0.2: a._0 06w A: 00.0. 0w.m wag 3.3 ms ado 5.00 m.0w v.7 2.9 mm.w 3m— >0.va od— .32 0.50 :5 0.7 2.2 NS. 002 50.3 m.» 062 :0 9% v.7 3.0 03. 0o2 0209 En :00— 550 0.03 ON 00 d 00.0-Va? aqmn w.0 0.5 0.: _.00 0.0-3.2 :.w 82 00.5 5.0 n.0w fiwv flow 06. 50.3 3.0 moo. 8.x» m0 Wow N.0v o.00 Nd 0:: 00.0 32 0.3 0.m m.¢0 mdv m.o0 WT 35 two 0mm: 8mm #20 3:3— 0.30 mZUbaon 3am mZU #752m 33— $5235. Ham EEEEE 08.3»:— :o End 3:15 Esau:— bcso3< 5330 533% 33.5 3.23:— .Soh 0:250 AHZU 9:89:00
0.313.
E
$5Em£96fl
flficncooeunz
”2.2
Saab
414
Productivity of Labor
During the 19905 a succession of coalition and minority goverments exploited the fund system, municipalities, state banks and other state econom-ic enterprises in order to please their voters and enhance their own power.
Thus, the problems of public finances in Turkey culminating in the crisis in
1999—2001 were due to a combination of political competition and the avail-ability of insufficiently regulated public funds.
The best indicator of a generous government is the ratio of public sector borrowing requirements (PSBR) to GNP. Table 12.13 reveals that the public sector ran a deficit measured by a PSBR/GNP ratio equal to 13.1 percent in 1997, 15.6 percent in 1998, 24.2 per cent in 1999, 19.6 percent in 2000 and 17.6 percent in 2001. The high deficit was financed by borrowing from the pri-vate sector at very high real interest rates.2 As a result of these developments gross public debt at the end of 2001 increased to 124.9 percent of GNP and
interest payments during 2001 formed 22.6 percent of GNP. The situation
was was clearly unsustainable.
To study problems of the sustainability of fiscal policy consider the
gov-ernment budget constraint:
G1 ' Tl + i[(1314 : Dl ' Dl-l + Ml ' Ml-l
where G refers to government expenditures excluding the interest payments, T indicates government revenues, D denotes total debt of the public sector, and i refers to the nominal interest rate on government debt. Suppose that govern-ment expenditures and governgovern-ment revenues are both constant fractions of nominal GNP such that G.= y Yl and Tl = 13 Y.. Assume that the quantity the-ory of money holds so that M V = p y where y is real GNP and p is the GNP price deflator. Letting Tl: be the rate of inflation, g denotes the growth rate of real GNP and r refers to the real rate of interest we have:
pi=pm(1 +71)
yl=ym (1 +g)
Y.=p.y. _ (1+i) (1+r) — _(1+7r)
Hence the equation determining the time path of d, the debt/GNP ratio, can be written as:
(1+r) _L g+7r+7tg
(1+ g) "' V (1+7r)(1+ g)
Considering the data for the year 2001, we have for the parameter values of y and 1; the values of y = 0.243 and 'r = 0.308, and for primary surplus as a per-cent of GNP, we get the value of 6.5 perper-cent, as indicated in the letter of intent
d =y—r+I
Su‘bidey Togan
that the government of Turkey sent to the IMF. We assume, following the pro-jections of the IMF, that the growth rate of real GNP will be 3 percent and that inflation will run at the rate of 35 percent. The initial value of GNP for the year 2001 is taken as Y2001= 184.7 quadrillion TL, the initial value of price level pm. = 1 and the initial value of real GNP yzm. = 184.7. The initial value of net
pub-hc debt determined as 92.2 percent of initial GNP equals D200, = 170.29.3
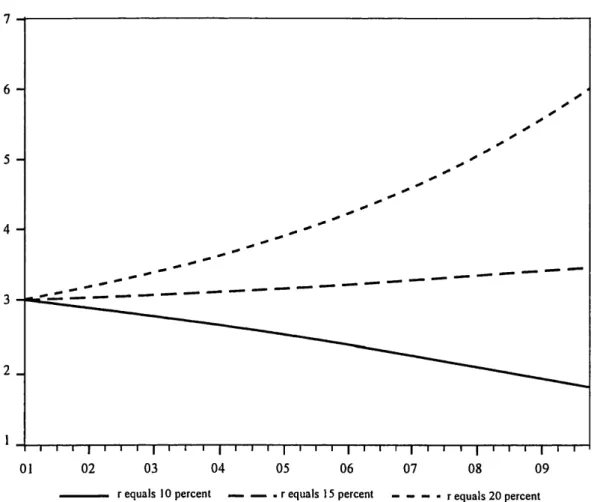
Concentrating on quarterly data we take the velocity of base money as V = 6.568. Figure 12.2 shows the time path of debt to GNP ratio under alternative assumptions about the real interest rates. Consideration of the figure reveals that a real rate of interest of about 14 percent is critical. As long as the real rate of interest exceeds 14 percent, the debt/GNP ratio starts to increase over time.
Figure 12.2: Time Path of Debt/a Ratio
6'1 ‘ ‘ —— .‘ ———‘_ ’———————-l I F I l l I I l I l I l l l r l l l I l l l—[ l l l I I l fiT l—F Ol 02 03 04 05 06 07 08 09
1' equals 10 percent _ _ . r equals l5 percent _ _ .. . r equals 20 percent
To further study the sustainability of fiscal deficits we abstract from mon-etary considerations and write the government budget constraint as:
GI " Tl + it Dl-l = Dl ' Dl-l
Denoting T1 - Gl by primary surplus shown as SURPl we obtain the relation
D.= (1 + i) D... - SURP.
which can be iterated forward N period to yield:
Productivity of Labor
N SURP .
Dl-l : 2 (+1] DN+I
M (1+ i)’+
(1 + i)”+l
A no-Ponzi game restriction is imposed by the requirement that the last term 'in the above equation goes to zero in the limit:
' DN+I
1.193 (How
The condition requiring that debt must grow more slowly than the interest rate
implies that the government debt at any point in time must equal the
pre-sent value of expected future primary surpluses:
N
Dr-l = 2 %
F0 (1+ 1)’+1
To illustrate the importance of this relation we consider again the data given above, namely y = 0.243, T = 0.308, V = 6.568, yzom = 184.7 quadrillion TL, p200. = 1 and D200] = 170.29 quadrillion TL. Assume again that the annual growth rate of real GNP equals three percent and that the annual inflation rate is 35 percent. Concentrating on quarterly analysis we determine the value of the real rate of interest for which the present value of future primary surplus-es just equals the initial value of public debt. This value of the real rate of inter-est equals 11.91 percent. Thus for real rates of interinter-est above 11.91 percent the fiscal sustainability condition is not satisfied, i.e. the initial value of public debt exceeds the present value of future primary surpluses. Next we alter the value of the tax rate I and obtain for each value of ’L' the corresponding value
of primary surplus as a percent of GNP. We obtain then the critical value of real
interest rate for which the present value of future primary surpluses just equals the initial value of public debt. Table 12.14 shows these relations. The table reveals that with decreases in primary surplus below 6.5 percent, the corre-sponding critical value of real interest rate decreases. Hence the system becomes unsustainable, even for smaller values of the real interest rate.
Table 12.14: Relation between Primary
Surplus and Real Interest Rate
Primary Surplus as percent of GNP Critical Valueof Real Interest Rate
9.5 16.43 8.5 14.93 7.5 13.43 6.5 11.91 5.5 10.36 4.5 8.76 3.5 7.05 417