S O F T W A R E
Open Access
Integrating biological pathways and genomic
profiles with ChiBE 2
Özgün Babur
1*, Ugur Dogrusoz
2, Merve Çakır
2, Bülent Arman Aksoy
1,3, Nikolaus Schultz
1, Chris Sander
1and Emek Demir
1Abstract
Background: Dynamic visual exploration of detailed pathway information can help researchers digest and interpret
complex mechanisms and genomic datasets.
Results: ChiBE is a free, open-source software tool for visualizing, querying, and analyzing human biological
pathways in BioPAX format. The recently released version 2 can search for neighborhoods, paths between molecules, and common regulators/targets of molecules, on large integrated cellular networks in the Pathway Commons database as well as in local BioPAX models. Resulting networks can be automatically laid out for visualization using a graphically rich, process-centric notation. Profiling data from the cBioPortal for Cancer Genomics and expression data from the Gene Expression Omnibus can be overlaid on these networks.
Conclusions: ChiBE’s new capabilities are organized around a genomics-oriented workflow and offer a unique
comprehensive pathway analysis solution for genomics researchers. The software is freely available at http://code. google.com/p/chibe.
Keywords: Pathway informatics, Genomic data analysis
Background
A key challenge in genomics is to predict the pheno-typic effects of genomic alterations and their combina-tions. Genomic alterations affect phenotypic changes via a complex interplay between multiple genes and their products [1,2]. Decades of molecular biology research have elucidated a substantial portion of this network, which is currently being reconstructed at a high level of detail that captures cellular processes such as tran-scriptional regulation, post-translational modification, transport, and complex formation in the formal and computable BioPAX format [3]. The corpus of publicly available biological pathway data in the BioPAX for-mat is continuously expanding, both in terms of cellular processes coverage and the level of curation detail [4]. These computable models of cellular processes can sub-stantially improve high-throughput data analysis by
link-*Correspondence: [email protected]
1Computational Biology Center, Memorial Sloan-Kettering Cancer Center, 1275 York Avenue, Box 460, New York, NY 10065, USA
Full list of author information is available at the end of the article
ing correlation to causation. The current landscape of high-throughput profile analysis, however, is dominated by correlation-based methods that are either ab initio or that use gross simplifications of biological processes [5-9], which can only capture relatively straightforward associations. There are three equally important techni-cal challenges in making rich pathway information more accessible to researchers: (i) finding a subset of the aggre-gate corpus that is relevant to the biological problem at hand; (ii) presenting this network of interest in an intuitive manner, properly reducing complexity, and still allowing exploration at multiple levels of detail; and (iii) mapping high-throughput data on top of networks of interest for analysis.
Chisio BioPAX Editor (ChiBE) [10] visualizes BioPAX
models as detailed process diagrams, displaying
molecules, complexes, reactions, and cellular compart-ments. We developed version 2 of ChiBE with the above goals in mind to help scientists formulate and answer bio-logical questions by combining rich pathway information with genomic and expression profiles. Users can use local models or obtain them from the Pathway Commons [11] database using advanced graph searches (neighborhoods,
© 2014 Babur et al.; licensee BioMed Central Ltd. This is an Open Access article distributed under the terms of the Creative Commons Attribution License (http://creativecommons.org/licenses/by/4.0), which permits unrestricted use, distribution, and reproduction in any medium, provided the original work is properly credited. The Creative Commons Public Domain Dedication waiver (http://creativecommons.org/publicdomain/zero/1.0/) applies to the data made available in this article, unless otherwise stated.
Babur et al. BMC Genomics 2014, 15:642 Page 2 of 9 http://www.biomedcentral.com/1471-2164/15/642
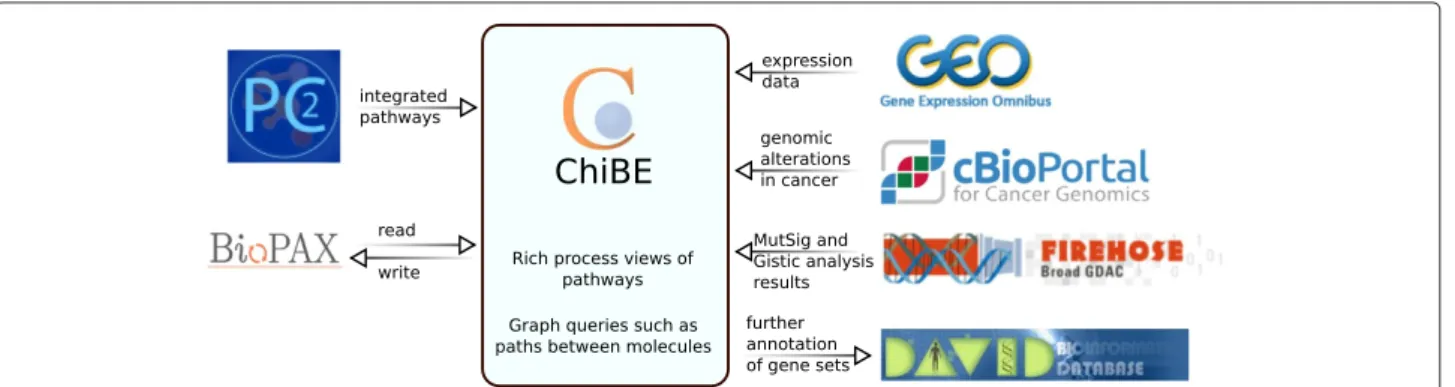
paths between molecules, or common targets/regulators) and overlay genomic alteration data from the cBioPortal for Cancer Genomics [12] or expression data from the Gene Expression Omnibus (GEO) [13] (Figure 1). These facilities are provided within the software tool, with no need for manual download or data handling.
In the following sections, as a general demonstration of ChiBE, we explore two example biological questions and generate hypotheses using ChiBE. We then summa-rize the capabilities of ChiBE version 2 and discuss how it compares to other pathway visualization tools. For more detailed instructions on how to use each of the available features, please refer to the ChiBE User’s Guide (http:// www.cs.bilkent.edu.tr/~ivis/chibe/ChiBE-2.2.UG.pdf). Implementation
ChiBE is implemented in Java and built on top of ChiEd 2.0, a generic graph visualization tool based on the Eclipse Graph Editing Framework 3.1.1. ChiBE uses Paxtools [14] for handling BioPAX data, and uses PATIKAmad [15] for handling and mapping profiling data. ChiBE was designed to be easily extensible programmatically to create custom toolbars, tooltips, and context menus to enable domain-specific customization.
Results and discussion
Exploring biological pathways with ChiBE
ChiBE complements and improves existing pathway analysis in endometrial carcinoma
A recently published The Cancer Genome Atlas (TCGA) article [16] reports genomic, transcriptomic and pro-teomic profiling of 240 endometrial tumors. In the pathway analysissection, the authors present a network, discovered by searching for mutually exclusive alteration patterns (Figure 2A). This network of binary signal trans-duction is a useful but simplified model of the true biol-ogy; signaling between two proteins is generally much more complex. To explore the details of the signaling events in this figure, we start by searching for paths of length 1 from ERBB2 to KRAS in Pathway Commons,
using ChiBE. This search returns one reaction that cap-tures the transfer of GTP to the RAS family of proteins by a complex containing ERBB2. We then overlay muta-tion and copy number alteramuta-tion data from the TCGA endometrial cancer dataset from the cBioPortal using the portal data import dialog (Figure 2B). Upon loading the data, gene alteration frequencies are color coded on the related molecules in the graph. The resulting diagram (Figure 2C) reveals that not only ERBB2, but all mem-bers of the complex have substantial alterations. ERBB3, for instance, has the same frequency of alterations (10%) as ERBB2. None of the members of this complex other than ERBB2 is mentioned in the TCGA article; however, at least one member of this complex is altered in 35% of patient samples (Figure 2D). Adding KRAS to this set increases the fraction of altered samples to 49%. This example clearly demonstrates that we can reproduce and improve existing literature findings with ChiBE.
ChiBE identifies an altered complex in breast cancer
In this example, we start with a list of frequently mutated genes in breast cancer. Such a list can be obtained using the MutSig tool [17] provided by the cBioPortal. With ChiBE, we run a “paths-between” query on the Path-way Commons database using the top 15 mutated genes (PIK3CA, TP53, MAP3K1, KMT2C, GATA3, CDH1, MAP2K4, TBX3, RUNX1, PTEN, PIK3R1, AKT1, CTCF, NCOR1, and RPGR) as the query seed with a default path length limit of 1. This query will find the linkage between these entities and will return them in BioPAX format. The result is then automatically laid out using the CoSE com-pound spring embedder algorithm [18] and displayed as a detailed process diagram.
Because the seed proteins of interest in the query are central in the cell, the query returns a large network, which is hard to understand visually. To reduce the com-plexity, ChiBE automatically hides subcellular compart-ments for large networks in the view. This view highlights all the seed genes and shows the connections between them.
Figure 2 Steps in sample use case 1. A) A reconstruction of the pathway published in the manuscript by the TCGA network [16]. In the original
figure, alteration frequencies are shown for three subgroups of cases, but we merge these into one in this version. B) Dialog to retrieve alteration data from the cBioPortal. C) Paths from ERBB2 to KRAS in Pathway Commons, overlayed with alteration data of endometrial cancer from the cBioPortal. This diagram is part of the result that was automatically generated by ChiBE using the menu item “Query| Pathway Commons (Level 3) | Paths From To”. D) Oncoprint of the related genes, generated by the cBioPortal. Genes from C are shown above the black line, and altered genes from A are shown under the black line.
We then overlay mutation and copy number variation data from the cBioPortal of the study “Breast Invasive Car-cinoma (TCGA, Nature 2012)”, and generate the graph shown in Figure 3. We notice that some of the com-plexes contain frequently mutated (seed) genes, as well as other genes with some significant alteration. One of these genes is a complex containing JAK2. To focus on this particular complex, we run a local neighborhood query from the pop-up menu. The resulting view shows that the PIK3CA/PIK3R1 complex in the cytoplasm binds to a large complex of active JAK2 on the cytoplasmic mem-brane. We can obtain details of the alterations using the pop-up menu for each molecule (Figure 4A). We observe that GAB2, SHC1, and GRB2 are mostly copy number amplified in breast cancer patients. Alterations concen-trating around a common function suggests that altering this function can be a driver event for the cancer.
We further investigate this hypothesis by looking for differential expression of members of this complex in datasets submitted to GEO. Searching GEO datasets with the keywords “tumorigenic and normal breast” returns a dataset by Liu et al. [19]. Within ChiBE, the user can automatically download this dataset by providing its GEO series ID of GSE6883. After tagging normal and disease samples using the data management dialog, node colors are updated to code the fold changes between average
values of normal and disease samples (Figure 4C), and fold-change values are displayed with tooltips. We observe that SHC1 and CSF2RB are over-expressed in tumorigenic samples more than twofold (2.21 and 2.56, respectively), and that GAB2 is under-expressed 1.65-fold relative to normal samples. Thus, the expression dataset also sup-ports the idea that this complex can have some significant function in tumorigenic behavior of breast cancer cells. We can continue this study by performing new queries, for instance, to retrieve the downstream paths from this complex or its members.
The above scenario shows the benefit of integrating rich pathway data with profiling data for exploring the biology of a disease. ChiBE automatically downloaded, formatted, and parsed the data. By removing these so-called “micro barriers”, ChiBE offers efficient access to rich pathway information for high-throughput data analysis.
Getting and working on a model
ChiBE was designed to work with pathways represented in the BioPAX format [3] - a community developed stan-dard - including the latest version, Level 3. We call the entire set of biological information loaded from a BioPAX file (an OWL file) or obtained through a query into the Pathway Commons database, a pathway model, or simply a model. Each model is potentially composed of one or
Babur et al. BMC Genomics 2014, 15:642 Page 4 of 9 http://www.biomedcentral.com/1471-2164/15/642
Figure 3 Paths between frequently mutated genes. The paths-between query result, with alteration data overlaid.
more pathways and their subpathways. Pathway bound-aries and hierarchical organization are defined in the BioPAX model by the original curator.
ChiBE draws each pathway as a separate view (Figure 5). Users can close existing views or open new views from the underlying model. Views can also be manipulated graphically and saved with layout information. A model may also be expanded by merging with another BioPAX model (another OWL file or a Pathway Commons query), provided both models are at the same level of BioPAX. This option allows users to incrementally expand their pathway model by including other BioPAX models or queries.
The default ChiBE view uses a notation very similar to that of the SBGN Process Description (SBGN-PD) language [20]. Reaction nodes map to biochemical pro-cesses, while other nodes map to pools of molecules. Different states of the same “entity” (e.g., different phos-phorylated forms of the same protein) are represented separately. Node labels and colors are used to indicate molecule pools that belong to the same entity. When pro-filing data is overlaid on pathways, however, node colors represent experimental values (as described later in the paper). ChiBE provides an array of interactive tools for the user to explore both types of views.
Retrieving a model from Pathway Commons
Pathway Commons [11] is a collection of publicly available pathway data from multiple organisms that enables biol-ogists to browse and search a comprehensive collection of pathways from multiple sources represented in a com-mon language. Using keywords of pathways or molecules, ChiBE can automatically query and obtain pathways from Pathway Commons through its web service. More impor-tantly, ChiBE can also run “graph-queries” to find con-nections between entities, even when these concon-nections span multiple pathways. Available graph-based queries that allow users to answer questions such as “Is there a known multi-step signaling path between Protein A and Protein B?” and “What is the network that connects these sets of altered genes?” are discussed in detail in the follow-ing section. One can also perform queries with keywords and identifiers.
After obtaining a network of interest, users also have the option to send the selected genes to DAVID bioinformat-ics service [21] for further gene-set related analysis. Querying for enriched reactions
Identification of altered parts of an interaction network based on experimental data has been previously studied [22-24]. ChiBE adapts this approach to detailed networks
Figure 4 Steps of sample use case 2. A) The reaction of interest in a separate view displaying compartments and detailed properties of GAB2. B)
Oncoprint of altered genes, provided by the cBioPortal. C) The same reaction but this time expression data is overlaid on involved molecules.
by detecting reactions, whose list of participants are sig-nificantly enriched with altered genes, or other genes that are of interest to the user. The set of altered genes can be selected among recurrently mutated and/or copy num-ber altered genes in a TCGA study, by providing the code of the study and significance thresholds for recurrence. ChiBE retrieves these genes from Broad Firehose.
Graph queries
ChiBE provides several graph queries for retrieving spe-cific portions of the cellular process network. ChiBE can query the Pathway Commons database using its web
service interface. Alternatively, a query can be executed locally on the currently loaded model.
Remote graph queries to Pathway Commons include: neighborhood, paths-between, paths-from-to, and common-stream. These queries are based on the algorithms given in [25], with modifications to accommodate additional BioPAX semantics such as generic molecules. In each case, the user provides the query seed using HGNC gene symbols [26], a path length limit, and other query param-eters. The result of the query is merged with the current model, allowing users to iteratively build a model using queries.
Figure 5 ChiBE overview. ChiBE views are organized in canvasses, each displaying one or more BioPAX pathways in a graphically rich, interactive
Babur et al. BMC Genomics 2014, 15:642 Page 6 of 9 http://www.biomedcentral.com/1471-2164/15/642
Neighborhood:This query retrieves the pathway neigh-borhood of the seed genes. Users can search upstream, downstream, or in both directions. By calling this query consecutively, users can easily explore pathways.
Paths-between:This query computes a connecting net-work between the seed genes. The connecting paths may include linker molecules up to a user-defined threshold. This query is especially useful for putting the results of high-throughput screens into the pathway context.
Paths-from-to: This query is similar to the paths-between query; the key difference is that this one takes two sets of seeds (source and target) and brings the merged network of all paths from a source to a target gene.
Common-stream: This query retrieves the network composed of all genes that are at the upstream and/or downstream of all seed genes. This query can be used to find master regulators (upstream) or common targets (downstream) that are signal integrators.
The queries discussed above can also be performed on the local model. However, instead of HGNC gene sym-bols, entities of the local model are used as the query seeds and the search is limited to the currently loaded model in memory.
Loading profiling data
ChiBE can use three different resources for profiling data: the cBioPortal cancer genomic profiles, NCBI GEO expression profiles, or tab-delimited files. With the first two options, ChiBE automatically downloads and maps the data on the network. The last option allows one to use private or preliminary datasets. In that case, ChiBE asks for a mapping between references in the tab-delimited file and references on the network through a wizard, and converts the data into an internal format for later use. Loading data from the cBioPortal
The cBioPortal for Cancer Genomics [12] is a repository of cancer genomics datasets with about 69 cancer studies and more than 17,000 tumor samples. ChiBE accesses the cBioPortal through its web service interface. Users choose a cancer study, a case list, and the available genomic pro-files to load (Figure 2B). Case lists are subsets of cases with some common properties (predefined in the cBio-Portal) such as all sequenced tumors. ChiBE discretizes this data into alterations, and color codes gene alteration ratios on the network (see Figure 2C for an example). For continuous valued experiments, users can set thresholds for discretization.
Loading data from the Gene Expression Omnibus
The NCBI GEO is a large repository of gene expres-sion and other profiling data, allowing public access to thousands of experiments. Given a GEO series ID, ChiBE
retrieves the dataset and maps on the network, automati-cally. ChiBE displays the comparison (fold change) of the first two experiments in the dataset by default. Users can set the method that generates the displayed values from the loaded experiments. They can visualize a single exper-iment, or the average of a set of experiments, or compare two sets of experiments. Mapped values are color coded on the related molecules on the network, and values are displayed with tooltips.
Managing biological complexity
Biological pathways are inherently complex and this reflects on the pathway models. One of our key design goals for ChiBE was to help users manage this complexity. ChiBE has a rich selection of tools for highlighting, view-ing and editview-ing (includview-ing zoomview-ing and scrollview-ing), context sensitive property inspection, and interactive object move and resize.
Users can create new pathway views by selecting or highlighting a set of molecules or processes and cropping to that particular subnetwork in a new view to reduce complexity. Similarly, users may select or highlight parts of the network that they are not currently interested in and hide them. At any time during analysis, a view can be saved as a static image (in SVG, JPEG, BMP, or PNG file format) or in GraphML format for importing into another graph analysis tool.
The dynamic and interactive nature of ChiBE views requires pathways to be automatically drawn. A critical and unique component of ChiBE is the automatic lay-out algorithm supporting compound structures [27] used for visualizing molecular complexes and subcellular com-partments. This algorithm was further customized for biological pathways to for example recognize and de-emphasize ubiquitously present small molecules such as ATP, nest subcellular compartments to represent biolog-ical containment relationships, and tile members of a molecular complex for more compact drawings.
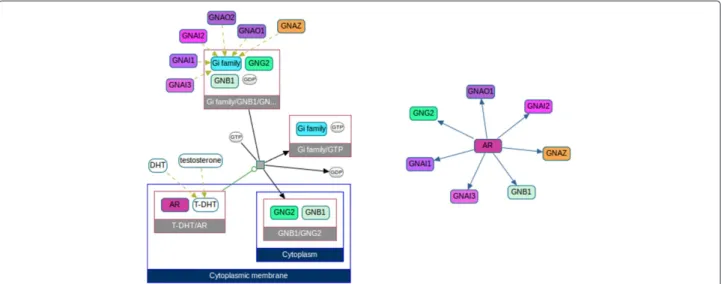
To further reduce the complexity of large networks and complex pathways, it can be useful to visualize them as a simpler network. ChiBE can reduce a rich BioPAX pathway representation to a binary network between entities using a carefully selected set of rules [28] and display the network as a newly created view (Figure 6). Supported interaction types for Level 3 models include “controls-state-change-of ”, “controls-transport-of ”, “controls-expression-“controls-transport-of ”, “controls-degradation-“controls-transport-of ”, “catalysis-precedes”, “in-complex-with”, and “neighbor-of ”. These networks can be saved on disk in the Simple Interaction Format (SIF) for later use. A paths-between query can be performed on a SIF file, providing a set of genes of interest, through which one can obtain a connected subnetwork including these genes.
Figure 6 SIF views with ChiBE. A process diagram view (left) and its SIF view (right), showing controls-state-change relations.
ChiBE pathway representation
ChiBE pathway representation mostly complies with SBGN Process Description notation [20]. There are, how-ever, a few differences, mostly due to the specific BioPAX semantics that have not been yet addressed in SBGN-PD or conflicts with other requirements. In several other instances, we simply chose to optimize user experience at the cost of relatively minor conflicts with the stan-dard (Figure 7). We are working with the SBGN com-munity to resolve these issues and expect to be fully compliant in the future. The differences are itemized below.
Control on controls:In SBGN-PD, the target of an effector arc can only be a process node, but BioPAX allows defining controls on other controls. To address this difference, ChiBE uses a special node type for showing the controlled control, and directs the effector edge to the control node.
Input and output ports:SBGN-PD uses two ports for collecting a process node’s input and output arcs.
This feature allows unambigious drawing of reversible reactions, but as the graph gets more complex and node degrees increase, ports bring additional challenges to the already difficult problem of layout. Another side effect of the aforementioned mismatch in representing controls is that it is hard to draw reversible reactions for some cases. We opt to always draw reversible reactions as two reactions in opposite directions. As this choice also removes the need for ports, ChiBE does not use ports, drawing input and output arcs directly to the process node.
Generic relations:SBGN-PD does not support abstractions such as homology relations and generic entities. However, these are defined in BioPAX, and they are frequently used in Pathway Commons. ChiBE draws a distinct arc from the generic molecule to its members.
Small molecule shape:SBGN-PD uses a circle glyph for small molecules. The constant aspect ratio of the circle, however, causes problems in placing labels, especially for long small molecule names. ChiBE uses
Babur et al. BMC Genomics 2014, 15:642 Page 8 of 9 http://www.biomedcentral.com/1471-2164/15/642
a single rounded rectangle glyph for all entities and differentiates small molecules by a white background.
Comparison of ChiBE version 2 to related tools
The first version of ChiBE [10] supports BioPAX mod-els of Level 2, experiment data overlay of tab delimited data, and basic querying of an older version of the Path-way Commons database. In version 2, we added support for BioPAX models of Level 3 and modified the graph-ical notation for better compliance with SBGN-PD. We also developed advanced graph-based querying for both the new version of the Pathway Commons database and for local models. In addition, integration to the cBio-Portal and the GEO for easy access to genomic pro-files have been made. Without this streamlining, finding and retrieving pathways, downloading and re-formatting data as well as often having to perform ID mapping take considerable effort and time for a user. Further-more, ChiBE provides key technologies including BioPAX input and output, full support for visualizing compound structures such as molecular complexes and cellular locations in SBGN, and customized pathway layout to present this information to the user in an intuitive man-ner. Thus, ChiBE removes technical barriers to accessing popular network and profiling databases, making it a unique software tool for molecular biology and genomic researchers.
CellDesigner [29] is an excellent visual pathway editor, comparable to ChiBE in its capacity to display rich path-way information. It is, however, designed primarily for pathway curation and simulation of SBML models. It cur-rently cannot import BioPAX models, nor can it dynam-ically perform graph-based searches and visually present the results. PathCase [30] has similar searching capabili-ties to ChiBE but is focused on metabolic pathways, and cannot overlay genomic or other types of profiling data. OmicsAnalyzer [31], a Cytoscape plugin, supports visual-ization of omics data in a network context but because its developers did not assume a standard network structure or a standard omics data structure, mapping between the data and the associated network is left to the user, which is prohibitively complicated in most cases. The tool is also limited to a simple interaction view, and is not capable of representing the rich process views that ChiBE can. Inge-nuity Systems makes a commercial software system called IPA, which has similar dynamic searching, data overlay, and analysis workflow capabilities to ChiBE’s but it uses a proprietary simple interaction network representation as opposed to the rich public pathway information that ChiBE is based on. IPA also does not give users as much control over how queries are performed as ChiBE does. We believe that using a public, standard, and feature-rich pathway representation will be increasingly important as the public pathway corpus [4] and our capacity to use it
to answer biological questions [32] grows. There are sev-eral other tools and Cytoscape plugins [33-36] that have portions of ChiBE’s functionality, but none provides a completely integrated workflow comparable to ChiBE. Conclusions
ChiBE allows users to tap into the detailed pathway infor-mation corpus for genomic data analysis. This would not be possible without its three key features: process views, specialized graph queries, and integration with genomic data repositories. Process views show the mechanism of events, bringing causality and context to the gene inter-actions. Graph queries enable users to define context specific boundaries for pathways. Automated mapping from genomic data repositories onto pathways stream-lines the analysis, eliminating manual formatting steps. As demonstrated by the use cases, ChiBE’s uniquely pow-erful visualization and analysis workflow opens up new opportunities for scientific discovery.
Availability and requirements • Project name: ChiBE
• Project home page: http://code.google.com/p/chibe • Operating system(s): Platform independent • Programming language: Java
• Other requirements: JRE 1.6 or higher • License: Eclipse Public License 1.0
• Any restrictions to use by non-academics: None
Abbreviations
BioPAX: Biological Pathways Exchange; ChiBE: Chisio BioPAX Editor; NCBI GEO: National Center for Biotechnology Information Gene Expression Omnibus; OWL: Web Ontology Language; SBGNPD: Systems Biology Markup Language -Process Description; TCGA: The Cancer Genome Atlas.
Competing interests
The authors declare that they have no competing interests.
Authors’ contributions
ChiBE’s initial requirements were determined by OB, UD, ED, and CS. The software design and development were mainly performed by OB, with help from MC, BAA, and UD. OB, ED, and NS prepared the case studies. All authors contributed to the manuscript. All authors read and approved the final manuscript.
Acknowledgements
This research was funded by the US National Institutes of Health (grant #U41HG006623 and #GM103504) and Scientific and Technological Research Council of Turkey (grant #111E036).
Author details
1Computational Biology Center, Memorial Sloan-Kettering Cancer Center, 1275 York Avenue, Box 460, New York, NY 10065, USA.2Department of Computer Engineering, Bilkent University, Ankara 06800, Turkey. 3Tri-Institutional Training Program in Computational Biology and Medicine, 1275 York Avenue, New York, NY 10065, USA.
Received: 26 June 2014 Accepted: 24 July 2014 Published: 3 August 2014
References
1. Chen Y, Zhu J, Lum PY, Yang X, Pinto S, MacNeil DJ, Zhang C, Lamb J, Edwards S, Sieberts SK, Leonardson A, Castellini LW, Wang S, Champy M-F, Zhang B, Emilsson V, Doss S, Ghazalpour A, Horvath S, Drake TA, Lusis AJ, Schadt EE: Variations in DNA elucidate molecular networks that cause
disease. Nature 2008, 452(7186):429–435. doi:10.1038/nature06757.
2. Emilsson V, Thorleifsson G, Zhang B, Leonardson AS, Zink F, Zhu J, Carlson S, Helgason A, Walters GB, Gunnarsdottir S, Mouy M, Steinthorsdottir V, Eiriksdottir GH, Bjornsdottir G, Reynisdottir I, Gudbjartsson D, Helgadottir A, Jonasdottir A, Jonasdottir A, Styrkarsdottir U, Gretarsdottir S, Magnusson KP, Stefansson H, Fossdal R, Kristjansson K, Gislason HG, Stefansson T, Leifsson BG, Thorsteinsdottir U, Lamb JR, et al.: Genetics of
gene expression and its effect on disease. Nature 2008, 452(7186):423–428. doi:10.1038/nature06758.
3. Demir E, Cary MP, Paley S, Fukuda K, Lemer C, Vastrik I, Wu G, D’Eustachio P, Schaefer C, Luciano J, Schacherer F, Martinez-Flores I, Hu Z,
Jimenez-Jacinto V, Joshi-Tope G, Kandasamy K, Lopez-Fuentes AC, Mi H, Pichler E, Rodchenkov I, Splendiani A, Tkachev S, Zucker J, Gopinath G, Rajasimha H, Ramakrishnan R, Shah I, Syed M, Anwar N, Babur O, et al.:
The biopax community standard for pathway data sharing. Nat
Biotechnol 2010, 28(9):935–942. doi:10.1038/nbt.1666.
4. Bader GD, Cary MP, Sander C: Pathguide: a pathway resource list.
Nucleic Acids Res 2006, 34(suppl 1):504–506.
5. Diez D, Wheelock AM, Goto S, Haeggström JZ, Paulsson-Berne G, Hansson GK, Hedin U, Gabrielsen A, Wheelock CE: The use of network analyses
for elucidating mechanisms in cardiovascular disease. Mol Biosyst
2010, 6(2):289–304. doi:10.1039/b912078e.
6. Torkamani A, Topol EJ, Schork NJ: Pathway analysis of seven common
diseases assessed by genome-wide association. Genomics 2008, 92(5):265–272. doi:10.1016/j.ygeno.2008.07.011.
7. Ciriello G, Cerami E, Sander C, Schultz N: Mutual exclusivity analysis
identifies oncogenic network modules. Genome Res 2012, 22(2):398–406. doi:10.1101/gr.125567.111.
8. Califano A, Butte AJ, Friend S, Ideker T, Schadt E: Leveraging models of
cell regulation and GWAS data in integrative network-based association studies. Nat Genet 2012, 44(8):841–847. doi:10.1038/ng.2355.
9. Tarca AL, Draghici S, Khatri P, Hassan SS, Mittal P, Kim J-S, Kim CJ, Kusanovic JP, Romero R: A novel signaling pathway impact analysis.
Bioinformatics 2009, 25(1):75–182. doi:10.1093/bioinformatics/btn577.
10. Babur O, Dogrusoz U, Demir E, Sander C: Chibe: interactive
visualization and manipulation of biopax pathway models.
Bioinformatics 2010, 26(3):429–431.
11. Cerami EG, Gross BE, Demir E, Rodchenkov I, Babur Ö, Anwar N, Schultz N, Bader GD, Sander C: Pathway commons, a web resource for biological
pathway data. Nucleic Acids Res 2011, 39(suppl 1):685–690.
12. Gao J, Aksoy BA, Dogrusoz U, Dresdner G, Gross B, Sumer SO, Sun Y, Jacobsen A, Sinha R, Larsson E, Cerami E, Sander C, Schultz N: Integrative
analysis of complex cancer genomics and clinical profiles using the cbioportal. Sci Signal 2013, 6(269):1.
13. Barrett T, Troup DB, Wilhite SE, Ledoux P, Evangelista C, Kim IF, Tomashevsky M, Marshall KA, Phillippy KH, Sherman PM, Muertter RN, Holko M, Ayanbule O, Yefanov A, Soboleva A: Ncbi geo: archive for
functional genomics data sets-10 years on. Nucleic Acids Res 2011, 39(suppl 1):1005–1010.
14. Demir E, Babur Ö, Rodchenkov I, Aksoy BA, Fukuda KI, Gross B, Sümer OS, Bader GD, Sander C: Using biological pathway data with paxtools.
PLoS Comput Biol 2013, 9(9):1003194.
15. Babur O, Colak R, Demir E, Dogrusoz U: Patikamad: putting microarray
data into pathway context. Proteomics 2008, 8(11):2196–2198.
16. The Cancer Genome Atlas Research Network: Integrated genomic
characterization of endometrial carcinoma. Nature 2013, 497(7447):67–73.
17. Berger MF, Lawrence MS, Demichelis F, Drier Y, Cibulskis K, Sivachenko AY, Sboner A, Esgueva R, Pflueger D, Sougnez C, Onofrio R, Carter SL, Park K, Habegger L, Ambrogio L, Fennell T, Parkin M, Saksena G, Voet D, Ramos AH, Pugh TJ, Wilkinson J, Fisher S, Winckler W, Mahan S, Ardlie K, Baldwin J, Simons JW, Kitabayashi N, MacDonald TY, et al.: The genomic complexity
of primary human prostate cancer. Nature 2011, 470(7333):214–220.
18. Dogrusoz U, Giral E, Cetintas A, Civril A, Demir E: A compound graph
layout algorithm for biological pathways. In Graph Drawing. Berlin
Heidelberg: Springer; 2005:442–447.
19. Liu R, Wang X, Chen GY, Dalerba P, Gurney A, Hoey T, Sherlock G, Lewicki J, Shedden K, Clarke MF: The prognostic role of a gene signature from
tumorigenic breast-cancer cells. N Engl J Med 2007, 356(3):217–226.
20. Novère NL, Hucka M, Mi H, Moodie S, Schreiber F, Sorokin A, Demir E, Wegner K, Aladjem MI, Wimalaratne SM, Bergman FT, Gauges R, Ghaza P, Kawaji H, Li L, Matsuoka Y, Villèger A, Boyd SE, Calzone L, Courtot M, Dogrusoz U, Freeman T, Funahashi A, Ghosh S, Jouraku A, Kim S, Kolpakov F, Luna A, Sahle S, Schmidt E, et al.: The systems biology graphical
notation. Nat Biotechnol 2009, 27(8):735–741.
21. Da Wei Huang BTS, Lempicki RA: Systematic and integrative analysis
of large gene lists using david bioinformatics resources. Nat Protoc
2008, 4(1):44–57.
22. Ideker T, Ozier O, Schwikowski B, Siegel AF: Discovering regulatory and
signalling circuits in molecular interaction networks. Bioinformatics
2002, 18(suppl 1):233–240.
23. Ulitsky I, Shamir R: Identification of functional modules using network
topology and high-throughput data. BMC Syst Biol 2007, 1(1):8.
24. Qiu Y-Q, Zhang S, Zhang X-S, Chen L: Detecting disease associated
modules and prioritizing active genes based on high throughput data. BMC Bioinformatics 2010, 11(1):26.
25. Dogrusoz U, Cetintas A, Demir E, Babur O: Algorithms for effective
querying of compound graph-based pathway databases. BMC
Bioinformatics 2009, 10(1):376.
26. Gray KA, Daugherty LC, Gordon SM, Seal RL, Wright MW, Bruford EA:
Genenames. org: the hgnc resources in 2013. Nucleic Acids Res 2013, 41(D1):545–552.
27. Dogrusoz U, Giral E, Cetintas A, Civril A, Demir E: A layout algorithm for
undirected compound graphs. Inform Sci 2009, 179:980–994.
28. Babur Ö, Aksoy BA, Rodchenkov I, Sümer SO, Sander C, Demir E: Pattern
search in biopax models. Bioinformatics 2014, 30(1):139–140.
29. Funahashi A, Morohashi M, Kitano H, Tanimura N: Celldesigner: a
process diagram editor for gene-regulatory and biochemical networks. Biosilico 2003, 1(5):159–162.
30. Elliott B, Kirac M, Cakmak A, Yavas G, Mayes S, Cheng E, Wang Y, Gupta C, Ozsoyoglu G, Meral Ozsoyoglu Z: Pathcase: pathways database
system. Bioinformatics 2008, 24(21):2526–2533.
31. Xia T, Hemert JV, Dickerson JA: Omicsanalyzer: a cytoscape plug-in
suite for modeling omics data. Bioinformatics 2010, 26(23):2995–2996.
32. Vaske CJ, Benz SC, Sanborn JZ, Earl D, Szeto C, Zhu J, Haussler D, Stuart JM:
Inference of patient-specific pathway activities from multi-dimensional cancer genomics data using paradigm.
Bioinformatics 2010, 26(12):237–245.
33. Saito R, Smoot ME, Ono K, Ruscheinski J, Wang P-L, Lotia S, Pico AR, Bader GD, Ideker T: A travel guide to cytoscape plugins. Nat Methods 2012,
9(11):1069–1076.
34. Gonçalves EJV, v Iersel M, Saez-Rodriguez J: Cysbgn: a cytoscape
plug-in to integrate sbgn maps. BMC Bioinformatics 2013, 14(17).
35. Klukas C, Schreiber F: Integration of-omics data and networks for
biomedical research with vanted. J Integr Bioinform 2010, 7(2):112.
36. Czauderna T, Klukas C, Schreiber F: Editing, validating and translating
of sbgn maps. Bioinformatics 2010, 26(18):2340–2341.
doi:10.1186/1471-2164-15-642
Cite this article as: Babur et al.: Integrating biological pathways and genomic profiles with ChiBE 2. BMC Genomics 2014 15:642.
![Figure 2 Steps in sample use case 1. A) A reconstruction of the pathway published in the manuscript by the TCGA network [16]](https://thumb-eu.123doks.com/thumbv2/9libnet/5833321.119479/3.892.89.805.130.493/figure-steps-sample-reconstruction-pathway-published-manuscript-network.webp)