doi:10.1093/cje/bey046
Advance Access publication 25 November 2018
© The Author(s) 2018. Published by Oxford University Press on behalf of the Cambridge Political Economy Society. All rights reserved.
The role of intangible assets in explaining
the investment–profit puzzle
Özgür Orhangazi*
Starting around the early 2000s, and especially after the 2008 crisis, the rate of capital accumulation for US nonfinancial corporations has slowed down despite relatively high profitability; indicating a weakening of the link between profitability and investment. While the literature mostly focuses on financialisation and global-isation as the reasons behind this slowdown, I suggest adding another layer to these explanations and argue that, in conjunction with financialisation and globalisation, we need to pay attention to the increased use of intangible assets by nonfinancial corporations in the last two decades. Intangibles such as brand names, trademarks, patents and copyrights play a role in the widening of the profit–investment gap as the use of these assets enables firms to increase market power and profitabil-ity without necessarily generating a corresponding increase in fixed capital invest-ment. After discussing the ways nonfinancial corporations use intangible assets, I look at large corporations in the USA and find the following: (i) The ratio of intangible assets to the capital stock increased in general. This increase is highest for firms in high-technology, healthcare, nondurables and telecommunications. (ii) Industries with higher intangible asset ratios have lower investment to profit ratios. (iii) Industries with higher intangible asset ratios have higher markups and profit-ability. (iv) The composition of the nonfinancial corporate sector has changed and the weight of high-technology and healthcare firms has increased; but this increase did not correspond to an equal increase in their investment share. The decline in the investment share of durables, nondurables and machinery is matched by an increase in the investment share of location-specific industries with low intangible asset use, most notably firms in energy extraction. In general, these firms have steadier markups and higher investment to profit ratios. (v) Yet, intangible-intensive industries’ profitability has increased faster than their share of investment or total assets. All in all, these findings are in line with the suggestion that the increased use of intangible assets enables firms to have high profitability without a corresponding increase in investment.
Key words: Profits, Investment, Capital accumulation, Financialisation, Globalisation, Monopolisation, Intangible assets, Intellectual property products
JEL classifications: E22, F62, L12, L13, O34
Manuscript received 23 November 2017; final version received 21 May 2018.
Address for correspondence: Özgür Orhangazi, Department of Economics, Kadir Has University, Cibali 34083, Istanbul, Turkey; email: [email protected]
* Department of Economics, Kadir Has University. I would like to thank James Crotty, David Kotz, Armağan Gezici, J. W. Mason and two anonymous referees for insightful comments on earlier drafts of this article.
1. Introduction
Since the early 2000s, and especially after the 2008 crisis, the link between profitability and investment has weakened for US nonfinancial corporations (NFCs) as their rate of capital accumulation has slowed down despite relatively high profitability (Cordonnier
and Van de Velde, 2014; Stanford, 2017; Durand and Gueuder 2016). Two hypotheses
have been put forward in the literature to explain the divergence of NFCs’ investment and profit rates: financialisation (e.g. Crotty, 2003; Stockhammer, 2004; Orhangazi, 2008) and globalisation (e.g. Milberg and Winkler, 2010, 2013). I suggest adding another layer to these explanations and draw attention to the increased weight of intan-gible assets on NFC balance sheets, especially in the last two decades. I argue that we need to consider, in conjunction with these hypotheses, the role of the increased use of intangible assets by NFCs. The increasing significance of intangible assets, such as brand names, trademarks, patents, copyrights and so on, plays a role in the widening of the profit–investment gap as the use of these assets enables firms to increase market power and profitability without making a corresponding increase in investment in fixed capital.
Industry- and firm-level analysis I present below shows that, first, the ratio of intan-gible assets to fixed capital stock started increasing in the 1990s and by the 2010s had reached record levels. Specifically, firms in four industries became highly intangible intensive: high-technology, healthcare, telecommunications and nondurables manu-facturing. Second, the gap between profits and investment observed at the aggregate level is larger in these industries. Third, these industries also have higher markups and profitability. Fourth, there has been a change in the composition of NFCs in the USA in the last two decades, reflected by a declining share of traditional manufacturing firms and a concomitant rise in the share of high-technology and healthcare firms, both in terms of numbers and in terms of asset size. As these firms rely more heavily on intangible assets to generate high profits without a similarly high level of investment, the increase in their number and size did not correspond to an increase in their share of total investment although their share in total profits increased. Fifth, investment shares of industries that are location specific and more fixed capital intensive, such as energy extraction and utilities, have increased. For these firms, investment in fixed assets has been generally higher, the use of intangible assets lower and investment to profit ratios higher.
The significance of investment spending and profitability is well recognised in the literature. Stanford (2017) emphasises that ‘capitalism is supposed to be an invest-ment-led economic and social system’ (p. 74) and the decreasing investment–profit ratio undermines the legitimacy of neoliberal policies, since, even though these policies restore profitability, we do not observe an investment expansion but only an upward distribution of income. Chirinko (1993) notes that the pace of investment is ‘central to our understanding of economic activity’ (p. 1875) and Jorgenson (2005) argues that investment is ‘the most important source of economic growth in the G7 nations’ (p. 806). DeLong and Summers (1991) find that investment in machinery and equip-ment is highly correlated with overall economic performance and Waller and Logan
(2008) contend that strong investment is correlated with productivity growth,
innov-ation, structural change, enhanced international competitiveness and rising wages. The Cambridge Journal of Economics often publishes leading and groundbreaking work on the issues of investment and profitability, including but not limited to the recent works
of Glyn (1997), Wolff (2013), Stockhammer (2004), Orhangazi (2008), Milberg and
Winkler (2010), Basu and Vasudevan (2013) and Cordonnier and Van de Velde (2014).
The significance of the rise of certain types of intangible assets in this context was highlighted by Pagano and Rossi (2009) and Pagano (2014). This paper also contrib-utes to these ongoing conversations.
The rest of the paper is organised in the following way. In Section 2, I briefly discuss the literature on the link between investment and profitability and provide empirical evidence for the weakening link at the aggregate level. In Section 3, I discuss what intangible assets are, how they are measured and how they are related to market struc-tures, investment and profitability. I present the empirical analysis in Section 4, where the focus is on industry- and firm-level data. This is important as most of the debate on the weakening link between investment and profitability relies on aggregate data. Aggregate data may conceal as much as they reveal and different dynamics may be at work in different industries. Given the problems of measurement when it comes to intangible assets, the empirical approach taken in this section is rather descriptive and the analyses presented neither imply direct and straightforward causal relationships nor attempt to measure the exact impact of the rise of intangible assets on invest-ment and profitability. Still, given the gap in the literature on the impact of the rise of intangible assets, this section makes a contribution to our understanding of the invest-ment–profit puzzle, and even though I do not provide clean causal relationships, the trends documented raise a number of important questions. In the last part of Section 4, I summarise the findings of the paper and discuss their implications before conclud-ing in the last section by discussconclud-ing the areas where we need further research.
2. Profit–investment gap
Classical economists viewed profitability as a fundamental determinant of capital accumulation, and hence of the rate of economic growth and the dynamics of the sys-tem. According to Marx, the profit motive and capital accumulation lie at the centre of the functioning of a capitalist economy: Investing in productive capital accumulation is the maxim of capitalists and through accumulation they make their profits, which they then use for further accumulation. Modern heterodox macroeconomic theories postulate a positive and double-sided relationship between profits and accumulation. In broad terms, they pose three channels through which investment and profits are linked. First, the purpose of investment is to earn profits, and hence profit expectations will be among the most significant determinants of investment. Second, higher profits allow firms to finance investments with their own funds. Glyn (1997) notes that [p]rofitability may affect investment via its effects on the expected returns from investment and thus the extent to which, under conditions of uncertainty, firms will incur sunk costs to expand or modernize capacity. Alternatively, or additionally, profitability influences the level of retained earnings which may be the preferred form of investment financing (p. 598).
Third, while investment is positively correlated with profits as an indicator of future/ expected profitability and as a source of finance, at the macroeconomic level profits are generated from capitalists’ expenditure on investment (and consumption) (van
Treeck, 2008).
Robinson (1962) formalised the idea that profits are central to the determination
of accumulation rates, and following Marglin and Bhaduri (1990) and Bhaduri and
Marglin (1990), a distinction between wage-led and profit-led growth models became one of the major beginning points of heterodox growth theories.1Bhaduri and Marglin
(1990) argue that investment and savings are functions of the profit share and capacity
utilisation, which is an indicator of expected demand. In their model, the system is called ‘exhilarationist’ (profit-led), if investment responds strongly to profitability. In this case, a higher profit share leads to higher capacity utilisation. The system is called ‘stagnationist’ (wage-led), if a higher profit share leads to lower capacity utilisation. In a wage-led regime, an increase in the wage share leads to increased economic activity and growth due to workers’ higher marginal propensity to consume. In a profit-led regime, it has the opposite effect and demand is led by profits.2 The profit squeeze approach also sees a strong link between profitability and investment. Boddy and
Crotty (1975) note that increasing wages can lead to decreasing profits, which then
leads to reductions in investment and can trigger recessions. Arestis and Karakitsos
(2004) draw attention to the double-sided relationship between profits and investment
and argue that ‘just as profits determine investment so investment determines profits’ (p. 74). Higher profit expectations lead to higher investment, actual profits finance future investment, and investment, by augmenting the capital stock, creates more prof-its in the future. Another line of research starting with Fazzari et al. (1998) suggests that firms’ cash flow is a good predictor of investment as it may proxy for investment opportunities, or may be important for investment financing, especially when firms cannot raise external funds.
When we turn our attention to macroeconomic trends, we observe that private fixed investment in the USA and other advanced economies collapsed during the global financial crisis and the recovery since then has been limited. Even though economic growth resumed after the Great Recession, the capital stock remained well below the trend according to the calculations of the International Monetary Fund (IMF, 2015)
and Hall (2014). While Kotz and Basu (2017) argue that the responsiveness of
invest-ment to profitability decreased in the post-2007 era, Alexander and Eberly (2016) find that the decline in investment began before the crisis, sometime around the early 2000s.
Stanford (2017) argues that investment has been, on average, lower in the post-1980
era compared with the golden age of capitalism. Wolff (2013) finds that profitability of the NFCs largely recovered, reaching levels close to the peak of the 1960s by the late 1990s. Basu and Vasudevan (2013) find evidence for the recovery of profitability after the 1980s, although profitability never returns to the 1960s’ levels according to their findings. The slow pace of capital accumulation together with high profits creates an ‘investment–profit puzzle’, in the sense that the historically strong correlation between profits and investment is weakened and NFCs are using less of their profits for invest-ment purposes. Perraton (2013) points out that this puzzle appears in an environment of falling interest rates, too. Van Treeck (2008) and Durand and Gueuder (2016) note that this has been a common trend in high-income countries, where investment rates have in general been declining together with a tendency of increasing profit shares and rates. Stanford (2017) notes that this contrast between high profits and falling investment shows an important economic problem as NFCs capture a larger share of
1 There is a voluminous literature on the issue. See Orhangazi (2018) for an overview.
2 Bhaduri and Marglin (1990) and Marglin and Bhaduri (1990) also present an intermediate case—
‘conflictual stagnationist’. In this case, aggregate demand can be weakly wage-led, while at the same time growth is profit-led.
the output in profits but reinvest significantly less back into the economy, creating a significant drain on aggregate demand and using excess profits to make distributions to shareholders or invest in financial assets. Recently, the gap between profits and in-vestment attracted attention in the press as well. For example, Elliott (2017), in The Guardian, writes that
[t]he multinational companies that bankroll the WEF’s [World Economic Forum] annual meet-ing in Davos are awash with cash. Profits are strong. The return on capital is the best it has been for the best part of two decades. Yet investment is weak. Companies would rather save their cash or hand it back to shareholders than put it to work.
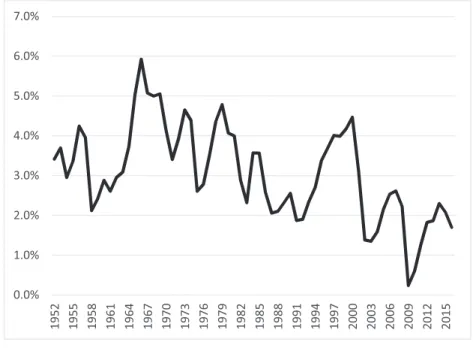
We can observe this puzzle at the aggregate level through three figures. Figure 1 shows the rate of capital accumulation—defined as NFCs’ net investment in private nonresi-dential fixed assets as a ratio of the beginning-of-year stock of their private nonresiden-tial fixed assets—for the period between 1952 and 2016. The downward trend in the rate of capital accumulation begins in the 1980s but this is reversed in the mid-1990s with a significant expansion in investment. After 2000 though, the rate of capital accu-mulation displays a sharp decline and collapses after the 2008 crisis. It then barely returns back to the pre-crisis levels and in fact declines again after 2014. We observe that, on average, the last decade is characterised by the lowest rates of capital accumu-lation in the US economy since the 1950s.
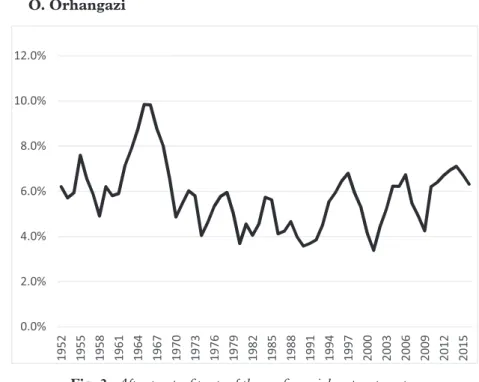
Figure 2 displays the after-tax profit rate for NFCs—defined as profits after tax
with inventory valuation and capital consumption adjustments divided by the
Fig. 1. NFCs’ rate of capital accumulation.
Source: US Bureau of Economic Analysis, 2017, Fixed Asset tables 4.1, 4.4 and 4.7.
Note: Net investment in private nonresidential assets [gross investment (table 4.7 line 37) minus depreciation (table 4.4 line 37)] divided by beginning-of-year stock of private nonresidential assets (table 4.1 line 37).
beginning-of-period capital stock for the same period. Following a decline in the 1970s and the 1980s, the profitability of NFCs recovers, although, at least with this measure, it never reaches the 1960s’ peak levels. However, despite a short-lived decline after the financial crisis, by 2014, the rate of profit reaches record levels, highest during the en-tire neoliberal period.
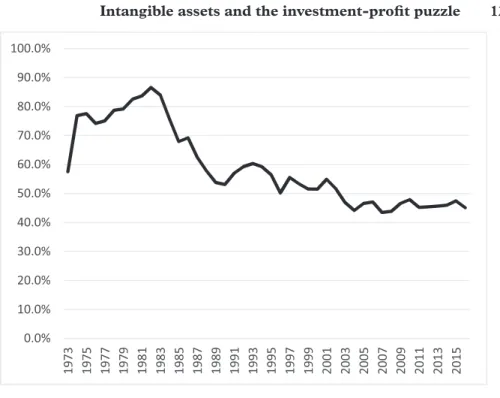
Finally, Figure 3 presents NFCs’ capital expenditures as a percentage of their cash flow. Here, we clearly see the results of the recovery of profitability and the lack of a correspond-ing increase in investment levels after the early 2000s. Note that the spikes in 2000 and 2008 are due to collapses of profits rather than increases in investment. While this ratio hovers above 80% until the late 1990s, it decreases all the way to 62% after the 2008 finan-cial crisis. While the investment to cash flow ratio began to recover after 2010, on average we observe the lowest investment–profit ratio since the 1950s in the post-2000 period.
Recent literature emphasises financialisation and globalisation through increased offshoring as the reasons behind the slow pace of capital accumulation despite high profits. A large number of works focus on the role of financialisation as a con-straint on investment growth, starting with Crotty (2003), Stockhammer (2004)
and Orhangazi (2008). These works focus especially on the short-termist corporate
strategies stemming from shareholder value pressures and on the increased involve-ment of NFCs in financial investinvolve-ments. Milberg and Winkler (2010, 2013) argue that the financialisation process and its impacts on capital accumulation should be
Fig. 2. After-tax profit rate of the nonfinancial corporate sector.
Source: US Bureau of Economic Analysis, 2017, National Income and Product Accounts table 1.14 and Fixed Asset table 4.1.
Note: Profits after tax with Inventory Valuation Adjustment and Capital Consumption Adjustment (National Income and Product Accounts table 1.14) divided by beginning-of-year stock of private nonresidential assets (table 4.1 line 37).
understood together with the increased outsourcing and offshoring of production, which enables firms to cut their investment needs while keeping profitability high and meeting shareholder’s demand for high payments through dividends and stock buybacks.
More recently, Gutierrez and Philippon (2017) drew attention to the divergence between Tobin’s Q-values and investment and found that NFCs have been underin-vesting relative to their Tobin’s Q since the early 2000s and even more so after the 2008 crisis. They argue that increasing market concentration is the reason behind this diver-gence. In fact, a number of studies point out that concentration in US industries has been increasing. The Council of Economic Advisers (2016) notes that market power has increased in key sectors and the decline in competition is a possible explanation for the increased profitability with sluggish output. Grullon et al. (2017) find that more than 75% of industries experienced an increase in concentration levels in the last two decades and the Herfindahl index of concentration increased, on average, by more than 50%. They also point out that the average size of a publicly listed corporation in terms of market capitalisation tripled in this period, from $1.2 billion to $3.7 billion in 2016 dollars. Barkai (2016) finds that the industries that saw a higher increase in con-centration from 1997 to 2012 experienced a higher decline in labour shares of output and a higher increase in profit shares.
Fig. 3. Nonfinancial corporate sector’s capital expenditures as a percentage of its cash flow.
Source: Financial Accounts of the USA, 2017, tables F.2 and F.103.
Note: Capital expenditures (table F.2) divided by cash flow defined as profits before tax (table F.103 line 1) minus taxes (table F.103 line 2) plus capital con-sumption allowance (table F.103 line 4) plus inventory valuation adjustment (table F.103 line 7). Cash flow defined as such does not include foreign earn-ings retained abroad (table F.103 line 6).
3. The political economy of intangible assets
Intangible assets are defined as ‘identifiable non-monetary asset[s] without phys-ical substance’ [International Accounting Standards Board (IASB), 2014] that have ‘probable future economic benefits to an entity’ (Upton, 2001, p. 68). These assets include brand names, trademarks, patents, copyrights, design and licenses, computer-ised information, customer relationships and other abstract forms of assets. The rise of intangible assets led some to suggest that they should also be classified as part of the capital stock of the firms (e.g. Corrado et al., 2006). An OECD (2011) study on intangible assets classify them into three groups: (i) computerised information such as software and databases; (ii) innovative property such as R&D, copyrights, designs and trademarks; and (iii) economic competencies such as brand equity, firm-specific human capital, networks, organisational know-how and aspects of advertising and marketing. The US National Income and Product Accounts (NIPA) was revised in 1993 to classify software expenditures and artworks as investment and again in 2008 to classify some of R&D expenditures as investment.
There are significant issues when it comes to measuring intangible assets, due to their immaterial nature. In fact, they can also be defined by ‘their impossibility to be measured according to traditional accounting standards’ (Arvidsson, 2016, p. 19). The main accounting problem is whether to value them using the cost of production (historical cost) or using the discounted value of expected future revenue generated by those assets (market value). While it is very difficult, if not impossible, to reduce intangible assets to historical cost in terms of labour time and capital expendi-tures (Arvidsson, 2016), the use of current value treats them as simple containers of future income streams without a link to prior expenditure or work, which goes against accounting’s temporality principle in the sense that capital as a factor of production and as a quantity is supposed to exist before income and profit (Bryan
et al., 2017, p. 62). Most of the time market prices do not exist, since these assets do not always go through the market (Penman, 2009). Furthermore, some intangible assets cannot be valued separately from tangible assets (Penman, 2009) or from the firm (Kaplan and Norton, 2004). These measurement and valuation issues gener-ate problems for economic and financial analyses as the growth of intangible assets leads to the divergence of firm values and share prices from historical accounting measures (Bryan et al., 2017). Most analyses, especially regarding the ‘knowledge economy’, then come to depend on whatever data are convenient and available
(Oxley et al., 2008).
Nonetheless, a number of attempts have been made to measure the growth of intan-gible assets. For example, Nakamura (2008) estimates that by 2006, the market value of intangible assets exceeded the value of tangible assets in the USA. Corrado et al.
(2006), Corrado (2009) and Corrado et al. (2012) estimate that the proportion of
cor-porate market value accounted for by intangible assets dominates the value of many leading global corporations and intangible assets represent over 90% of corporate value for many high-technology and pharmaceutical firms. Zeller (2008) notes that there has been a significant increase in the number of patents in the USA since the late 1980s. While 76,748 patents were granted in 1985, this number increased to 107,124 in 1991 and to 221,437 in 2002 (p. 93). One often finds references to the growth of intangible assets in the business press as well. The Economist (2014) reports, for example, that brands have become the most valuable asset for many firms but
(…) no one agrees on how much they are worth or why. (…) in 2005 Procter & Gamble, a consumer-goods company, paid $57 billion for the Gillette razor company. The brand alone, P&G reckoned, was worth $24 billion.
The question, for the purposes of this paper, is how this growth of intangible assets is related to firm profitability and investment behaviour. In this context, it is import-ant to recognise that intangible assets are essentially rights to certain privileges. They determine who is allowed to use certain ideas and produce certain products by ‘locking out’ others (Baranes, 2016, p. 2). As such, patents, copyrights, trademarks etc. gener-ate monopoly rents for their owners as they increase income coming from production without directly contributing to the production process itself (Serfati, 2008; Zeller,
2008; Foley, 2013; Bhattacharya and Seda-Irizarry, 2017). Bryan et al. (2017) argue
that the largest corporations in the world derive a large proportion of their profits from intangible assets (p. 60).
We can identify four distinct (though sometimes overlapping) functions of intan-gible assets. First, intanintan-gible assets such as patents generate absolute monopolies for certain products. Second, industries such as high-technology and telecommunications are inherently intangible asset intensive and these assets act as barriers to entry. Third, intangible assets such as brand names and trademarks give firms pricing power in markets where the degree of competition would otherwise be high. Finally, intangible assets such as copyrights for software generate artificial scarcity for products whose cost of reproduction tends to zero and give their owners the power to set the price well above the cost of reproduction. In all these cases, firms may be able to increase their profits without necessarily needing a commensurate increase in tangible assets. Let me briefly discuss some examples for each case.
The first and most straightforward case is when intangible assets such as patents generate absolute monopolies. This is well recognised, especially in the case of phar-maceuticals, where patents give pharmaceutical firms monopoly rights in the produc-tion of the patented products. While it is clear that these monopoly rights give firms the ability to charge high prices3 and hence contribute to higher profits, there is an ongoing debate on their impact on investment, especially investment in research and development. Recently, The Economist (2017) argued that ‘the promise of monopolies can encourage investment’ as, for example, ‘the lure of temporary exclusivity makes it worthwhile for the pharmaceutical industry to research new drugs, which can sell for next to nothing once patents expire’. Yet, it noted, ‘once a firm wins a power strug-gle, it can, like a medieval king, sit back and get fat on the proceeds’. The defenders of patents argue that pharmaceutical research has high costs and without this kind of protection, firms will not undertake research. Opponents argue that patents do not necessarily incentivise innovation, but rather lead to rent-seeking behaviour and prevent innovation by creating obstacles in front of spillovers and by increasing the cost of innovation through licensing fees. Appelbaum (2017) and Baker (2016) argue that in the last decades, the extension of the periods of monopoly and the expansion of the scope of patent and copyright protections have led to the creation and ap-propriation of monopoly rents much larger than needed as incentives for innovation and creativity. Furthermore, Baker et al. (2017) point out that many firms entered
3 Recent research points out that market monopolies created by patents is the primary factor behind the high prices in pharmaceuticals (Kessekheim et al., 2016).
into a process known as ‘evergreening’ in which they invent new follow-on patents to increase the length of patent protections just when the patent production is about to expire. Baranes (2016) argues that dominant pharmaceutical firms rely on drugs obtained through acquisitions rather than internal development. The most extreme cases of questionable patenting practices are seen in new fields when such things as DNA sequences, specific upstream knowledge portions in the field of monoclonal anti-bodies or genetic databases of certain populations are patented (Zeller, 2008). Since the 1980s, laws and court rulings have changed in ways that allow the patenting of life forms, business methods and software and increased patent protections (Appelbaum, 2017). For example, the firm deCode Genetics entered into an agreement with the Icelandic government which awarded it exclusive rights to investigate the genetic com-position of the Icelandic population (Zeller, 2008, p. 103). In this case, a non-com-modity is commodified and ‘enclosed’ and researchers or firms who want to use these have to pay royalties to the owner of the patent.4 In short, monopolisation of certain product markets through the use of intangible assets allows firms to collect monopoly rents which are reflected in higher profits, while not necessarily generating a matching increase in investment.
Second, especially for high-technology and telecommunications firms, the inher-ent intensity of intangible assets also serves as a high barrier to inher-entry. For example, software platforms and online services, in addition to having high fixed costs and low marginal costs, also have strong network effects where the usefulness of the product to each user is enhanced by the increase in the total number of users (e.g. Google, Facebook, Airbnb, Uber, Microsoft etc.). These markets have ‘winner-take-all’ fea-tures (Autor et al., 2017) and a single firm or a small number of firms dominates very large shares of the markets. The accumulation of intangible assets, on the one hand, facilitates ‘mutual recognition’ and ‘tacit collusion’ among lead firms and, on the other hand, empowers lead firms against the smaller firms (Serfati, 2008, p. 52). Intellectual property rights generate entrenched monopolies and prevent the entrance of new-comers, therefore forestalling the creative destruction process from a Schumpeterian standpoint (Baranes, 2016, p. 11). Furthermore, for firms that have large volumes of intellectual property products, the unit cost of defending the exclusive ownership rights become smaller:
The skills necessary to deal with courts and lawyers involve a high initial set-up cost. If legal fighting skills are costly, deterrence requires even more time and more resources to become effective: a tough reputation (to be endowed with the skills and the financial resources necessary to challenge competitors’ IPR claims) entails an even higher set-up cost. Thus, the so-called knowledge economy produces an evident paradox: the non-rival nature of knowledge, which could in principle favor small (even worker-managed) firms, is used to create artificial econo-mies of size that make the cheap acquisition and the defence of property rights possible only for big business (Pagano, 2014, p. 1421).
While some rising industries need relatively less capital and tangible assets, the lead firms are usually able to acquire the small startups. For example, Frey (2015) reports that the average cost of developing an app was around $6,453 and the
4 The infamous Apple versus Samsung lawsuit shows that ‘even geometric shapes such as rectangles with rounded corners’ are subject to these ‘enclosure’ attempts (Pagano, 2014, p. 1415). Belloc and Pagano
(2012) and Foley (2013) view intellectual property rights in general as parallel to the enclosure of commons
during the transition from feudalism to capitalism in Europe.
instant-messaging software firm WhatsApp started with only $250,000 and had 55 workers when Facebook bought it for $19 billion. Taplin (2017) reports that Google has an 87% market share in the USA and 91% in Europe; Amazon controls 65% of all print and digital online book sales; and Facebook, together with its subsidiaries such as Instagram, WhatsApp and Messenger, controls 75% of the US market. Google and Facebook together control 97% of the US digital ad market. This market domin-ation results in rapid growth of earnings. For example, Google’s revenues grew from $1.5 billion to $90 billion from 2003 to 2016 (O’Reily, 2017; Taplin, 2017). Clearly, it is not only intangible assets but also the regulatory framework and implementations that enable lead firms to dominate the markets. For example, the antitrust case of the Federal Trade Commission against Google was dropped in the USA while not in Europe (Zingales, 2017, p. 123). Schwartz (2017) notes that
[u]nlike in the past, where struggles for control over the factory floor largely determined the distribution of profits between capital and labor in oligopolistic markets, today firms struggle among themselves to create and defend monopoly positions. They do so primarily in the political and juridical arenas, via litigation over IPRs, lobbying to expand IPRs, and U.S. state efforts to export its preferred version of IPRs to the rest of the world via trade agreements (p. 192). In short, large intangible assets and network effects lead to the emergence of monopo-lies or oligopomonopo-lies in these industries and make these firms highly profitable while they need relatively less investment in tangible assets. Moreover, they may prefer to keep cash instead of physical capital either to takeover other firms or as a precaution against a potential takeover bid.
Third, the emergence of global value chains and the widening of outsourcing and offshoring practices made intangible assets such as brand names, trademarks, design and licenses, trade secrets as well as patents and copyrights very important for manufacturing firms. Today, a large number of manufacturing firms do not actu-ally manufacture but provide only ‘brand design, marketing, supply chain logistics and financial management services’ (Milberg, 2008, p. 425). As Bryan et al. (2017) note, the result is the emergence of ‘manufacturers without factories’ (e.g. Nike, Apple), or ‘retailers with “contract” factories’ (e.g. Ikea, Walmart). In these cases, outsourcing and offshoring of production enable firms to cut costs, while intan-gible assets enable them to have large market shares and charge high prices, lead-ing to profits without investment. The function of intangible assets in such cases is to ensure a market price well above the cost of production and as such to gen-erate economic rents. In this regard, brand names and trademarks, for example, serve to generate ‘claims to uniqueness, authenticity, particularity, and specialty’, which ‘underlie the ability to capture monopoly rents’ (Harvey, 2012, p. 103). Klein
(2002) traces the beginning of the rise of the significance of brand names and such
intangibles to the 1980s when product market competition was intense since nearly identical products were flooding the market, the economic growth was low, and traditional commercials did not have the intended effect. In such an environment, a number of firms began focusing on building brand names and in time firms such as Nike, Apple, Tommy Hilfiger, Starbucks etc. would start seeing themselves not as producers of physical products but as manufacturers of brands. For example, John Ermatinger, president of Levi Strauss’ Americas division, was explaining the closing of 22 plants in North America and the laying off of 13,000 workers at the end of the 1990s with the following words:
Our strategic plan in North America is to focus intensely on brand management, marketing and product design as a means to meet the casual clothing wants and needs of consumers. Shifting a significant portion of our manufacturing from the US and Canadian markets to contractors throughout the world will give the company greater flexibility to allocate resources and capital to its brands. These steps are crucial if we are to remain competitive (quoted in Klein, 2002, p. 196). In such cases, offshoring significantly decreases the domestic investment needs of the firms, while intangibles enable them to have some degree of market control and pricing power, leading to high profits without investment.
Finally, intangible assets serve to generate artificial scarcity for products that have reproduction costs tending to zero. In the case of products usually referred to as ‘infor-mation commodities’, or ‘cognitive commodities’, such as software, the production of the first unit involves high costs of production, but the costs of reproduction tend to zero and identical products can be easily produced by others without having to spend the original costs for the production of the first unit. Intellectual property rights in the form of copyrights and patents generate artificial scarcity for these products and prevent their reproduction, usually together with technical barriers such as non-accessible source codes or copy protection of computer programs. Under these protections, the price of these commodities will reflect monopoly rents (Zeller, 2008; Teixeira and Rotta, 2012;
Rigi, 2014; Rigi and Prey, 2015). Teixeira and Rotta (2012), for example, argue that
these products, in Marxian value theory terms, are ‘valueless’ and all the revenue should be considered to be not surplus value from direct production but rent earned through monopolisation.5 As Pagano (2014) notes ‘monopoly is not based on the market power due to the concentration of skills in machines and management; it becomes also a legal monopoly over some items of knowledge’ (p. 1413). It should also be added that in the last couple of decades, the scope of copyright protections has been widened while the length of protections has also increased (Katari and Baker, 2015; Appelbaum, 2017).6
In short, there are four channels through which investment in intangible assets may lead to increased profits. All these cases show that the increased significance of intan-gible assets may be one of the reasons behind the divergence of profits and investment for US NFCs. Furthermore, Pagano (2014) notes that, in the case of intellectual prop-erty products, the restrictions on access to knowledge may also squeeze investment opportunities for others (p. 1416).7 It should be emphasised that, while for presentation
5 In a recent working paper, Rotta (2017) writes
[b]esides trade, finance, insurance, real estate, non-profit organizations, and government administration, I also classify as unproductive the production of software, data, pharmaceuticals, movies, recorded video and music, and published materials such as books and journals. The re-production of knowledge and infor-mation requires no labor time and therefore produces neither value nor surplus value, implying that these activities must be classified as unproductive (p. 2).
6 An example of this is the music industry where revenues have been falling steadily in the last two dec-ades according to the Recording Industry Association of America, and, consequently, the music industry lobbied intensely to extend the Digital Millennium Copyright Act and the Copyright Term Extension Act
(Schwartz, 2017, p. 196).
7 Pagano and Rossi (2009) also note that
[t]he effects of the strengthening of IPRs on the profitability of the American model of capitalism have self-reinforcing properties. The increased profitability of US businesses, fostered by the ability to enforce their own IPRs at home and abroad, attracted foreign savings that, in turn, contributed to consolidate the strength of the model, leading to further accumulation of intellectual monopolies. As new spaces opened up for the American companies super-endowed with IP ‘resources’, numerous opportunities for investment were closed to Japan and the former Asian tigers, which had neither America’s monopolistic endowment nor China’s lower costs (pp. 673–74).
purposes it may be useful to distinguish four different uses of intangible assets, these four functions usually overlap. For example, it is quite easy to think of ways in which Apple uses different types of intangible assets to prevent competitors from producing similar products, to establish barriers to entry, generate brand recognition and prices above reproduction costs for its software. Intangible assets are almost by definition aimed at blocking competition. While some recent works emphasise increased con-centration in US industries, they mostly utilise the Herfindahl index or concon-centration ratios. However, these measures may understate actual market concentration as intan-gible assets also influence and generate market power (Baranes, 2016, p. 113). In some industries like pharmaceuticals, many products are not substitutable (Waldman and
Jensen, 2013). In other industries like nondurables, intangibles serve to differentiate
products. On the other hand, in some industries, a high degree of market concentra-tion can be observed without a significant increase in the use of intangible assets. It is possible to have markets where concentration ratios are high but there is still intense price competition or markets where concentration ratios seem low but since the prod-ucts are sufficiently differentiated, firms have higher pricing power. Implications for profitability and investment differ as the first case can still lead to high investment and lower profitability and the latter case may lead to lower investment and higher prof-itability. In the following section, I look at the empirical trends in terms of intangible assets and investment and profit dynamics at firm and industry levels.
4. Empirical trends
4.1 Aggregate data
Before moving onto the detailed firm-level analysis, I first look at the increasing sig-nificance of intangible assets with the Bureau of Economic Analysis’s (BEA) aggre-gate and industry-level data. BEA provides investment and capital stock data that is disaggregated into equipment, structures and intellectual property products. I present two figures based on this data. The first one, Figure 4, shows the stock of intellectual property products as a percentage of total private fixed assets for the whole econ-omy. BEA’s definition of intangible assets includes patents, trademarks and franchise agreements but not copyrights. According to this data, the stock of intellectual prop-erty products starts increasing around the 1980s and this increase continues until the early 2000s. Following the slowdown in the early 2000s, the ratio starts increasing again around the mid-2000s. However, the ratio itself is quite low with 6.3% at its peak. When we look at the shares of equipment, structures and intellectual property products in total investment, in Figure 5, we observe that the share of investment in intellectual property products reaches 25% while the share of investment in struc-tures continually declines.
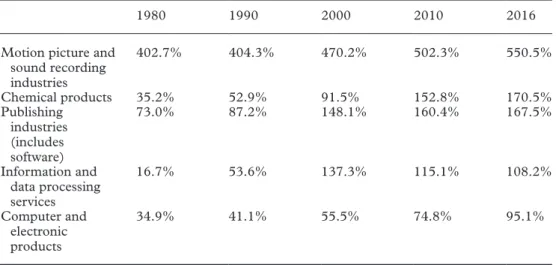
BEA also reports the same data by major industries. I look at the intangible intensity of these industries by looking at the stock of intellectual property products as a per-centage of net stock of equipment and structures and report in Table 1 the five most intangible-intensive industries according to this data. These industries are ‘motion picture and sound recording industries’, ‘chemical products’, ‘publishing industries’,” ‘information and data processing services’ and ‘computer and electronic products’. While the first of these historically has quite a high ratio of intellectual property prod-ucts, the intangible intensity of the following four has steadily increased since 1980.
Fig. 5. Investment in equipment, structures and intellectual property products as a percentage of total
investment.
Source: US Bureau of Economic Analysis, 2017, Fixed Asset table 2.7.
Fig. 4. Intellectual property products as a percentage of capital stock.
Source: US Bureau of Economic Analysis, 2017, Fixed Asset table 3.1.
While BEA data confirm the literature’s emphasis on the rise of intangible assets to a certain extent, in the next section, I move to analysing firm-level data to get a more detailed understanding of the rise of intangible assets and its impact on investment and profitability.
4.2 Compustat sample
I use a comprehensive sample of NFCs from the Standard and Poors’ Compustat data-base, which includes the vast majority of the large NFCs for the period of 1973–2016. The ratio of total Compustat capital expenditures to the BEA investment is around 60% and the ratio of total assets of firms listed in Compustat to total assets reported by BEA is around 50% throughout this period. Given the heterogeneity of the firms and the significant degree of concentration in terms of investment, a simple analysis of the average firm is likely to fail in explaining variations at the aggregate level. Therefore, while I look at trends for all the firms, I pay specific attention to the sample of largest US-incorporated NFCs constructed in the following way: In the first step, firms are ranked by their total assets each year. In the second step, I keep firms that have been among the top 1,000 largest firms for at least one year and drop the firms that never make it to the top 1,000 list. This sample selection process generates a representative sample for the purposes of investigating the dynamics of investment and profits. On average, a firm remains in this sample for 18 years. Figure 6 shows that the firms in this sample undertake close to 95% of all the investment made by the US-incorporated nonfinancial firms in Compustat. Furthermore, if we focus only on the top 1,000 firms each year, we observe that their total investment each year constitutes more than 90% of all the investment made by the US-incorporated nonfinancial firms in Compustat. There is a decline in both ratios during the 1990s’ investment boom, but by the 2000s, the ratios return to the pre-1990 heights.
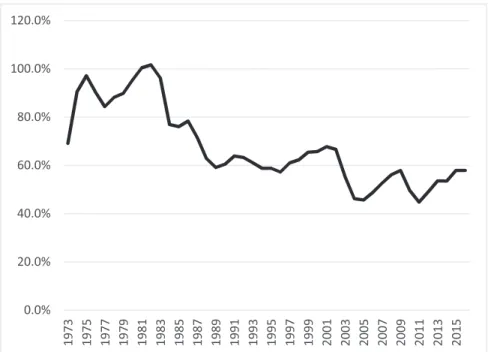
Figure 7 presents capital expenditures as a percentage of cash flow for the sample
from 1973 to 2016. We observe that the trend at the macro level is reflected in our Table 1. Top five intangible-intensive industries
1980 1990 2000 2010 2016
Motion picture and sound recording industries 402.7% 404.3% 470.2% 502.3% 550.5% Chemical products 35.2% 52.9% 91.5% 152.8% 170.5% Publishing industries (includes software) 73.0% 87.2% 148.1% 160.4% 167.5% Information and data processing services 16.7% 53.6% 137.3% 115.1% 108.2% Computer and electronic products 34.9% 41.1% 55.5% 74.8% 95.1%
Note: Stock of intellectual property products divided by stock of equipment and structures. Source: US Bureau of Economic Analysis, 2017, Fixed Asset Accounts Table 3.1.
Fig. 6. Top 1,000 firms’ total investment as a percentage of all firms’ total investment.
Source: Author’s calculations from Compustat database. See Appendix A1 for variable definitions and calculations.
Fig. 7. Investment to cash flow ratio for the ‘top firms sample’.
Source: Author’s calculations from Compustat database. See Appendix A1 for variable definitions and calculations.
sample too. In the late 1970s and the early 1980s, this ratio is around 100% and by the 1990s goes down to 60%. While there is an increase again in the late 1990s, there is a clear decline after 2000 and the ratio falls to as low as 45%. Then in Figure 8, I add ‘new debt’ to cash flow and look at the ratio of capital expenditures to available funds. While there is a similar trend in this ratio, too, the downward trend since the beginning of the 1980s is more pronounced.
4.3 Industrial composition
Before moving onto an examination of the rise of intangible assets, I classify the firms into 10-industry categories based on the reclassification of the SIC codes according to the Fama–French Industrial Classification System in order to be able to look at trends at the industry level. Originally, the Fama–French Industrial Classification System was developed by Fama and French (1997) with the aim of reaching industry aggregations based on similar risk characteristics (Fama and French, 1997; Hrazdil
et al., 2013; Phillips and Ormsby, 2016). The use of this classification allows us to observe the changes in the structural and technological composition of the US indus-tries. As Alexander and Eberly (2016) note, this reclassification makes some important changes. An example is the classification of Facebook and Microsoft. In SIC, these firms are classified as service firms (SIC 73), while in the Fama–French classification, they are included under high-technology. Similarly, Fama–French reclassification puts Apple [classified under manufacturing in SIC (code 35)] under high-technology as well. On the other hand, Amazon is classified as retail in standard SIC (code 59) and is
Fig. 8. Investment to available funds ratio for the ‘top firms sample’.
Source: Author’s calculations from Compustat database. See Appendix A1 for variable definitions and calculations.
included under ‘shops’ in the reclassification (Alexander and Eberly, 2016, pp. 11–12).
Appendix A2 presents the details of the reclassification.
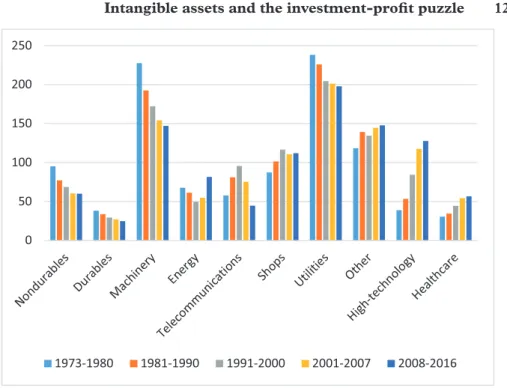
Figure 9 presents the average number of firms from each industry for five periods
since 1973. The number of firms in nondurables, durables, machinery and utilities steadily declines. In other industries, there is an increase in the number of firms in the 1990s but this increase is reversed in the 2000s, except in healthcare. Then Figure 10 shows the average number of firms from each industry within the top 1,000 for each year, for the same periods. In this sample, too, the number of firms in nondurables, durables, machinery and utilities steadily declines and firms in high-technology and healthcare enter into the ranks of the top 1,000 firms.
A similar trend is observed when one looks at the size of the total assets of each industry as a percentage of the total assets of all the firms in the top 1,000 sample.
Figure 11 shows that a decline is observed in the size of firms in nondurables, durables
and machinery; however, the decline in size seems smaller compared to the decline in the number of firms in these industries, indicating that the remaining firms in these industries became larger on average. The decline is more noticeable in durables and machinery. The increase in the weight of firms in high-technology and healthcare though is clear. I will come back to the significance of the change in the industrial composition of large NFCs in terms of the investment–profit puzzle in Section 4.6. 4.4 Intangibles by industry
Intangible assets reported by Compustat include goodwill, which is reported separately from 1988. Since goodwill is likely to include items other than intangible assets such as
Fig. 9. Number of firms, period averages.
Source: Author’s calculations from Compustat database. See Appendix A1 for variable definitions and calculations.
a market premium for physical assets, I start reporting intangibles starting from 1988 and I present three series, one including goodwill, another one excluding goodwill and a third one estimating the off-balance-sheet intangibles, which comes from Peters and
Taylor’s (2017) estimations. Peters and Taylor (2017) note that internally created
in-tangible assets are significantly underreported in the Compustat database and suggest that estimation of intangible assets be done by measuring two types of intangible assets, knowledge capital and organisation capital. Knowledge capital is estimated by using the R&D spending and applying the perpetual-inventory method to firms’ past R&D spend-ing. Organisation capital is estimated as a fraction of past selling, general and admin-istrative spending (p. 2). Figure 12 shows that there is a steady increase in these ratios starting in the early 1990s. However, while the trends are similar, the ratio that includes goodwill is much higher, potentially indicating the significant increase in M&A activities. The intangibles ratio excluding goodwill starts increasing at the beginning of the 2000s.
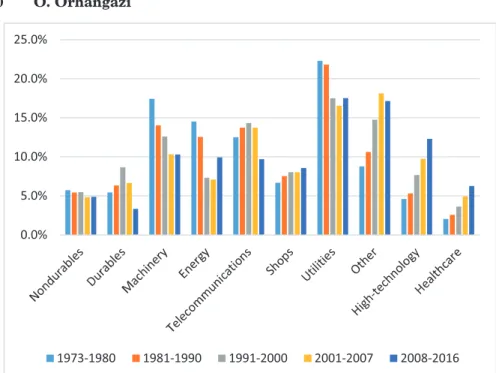
Figure 13 shows the intangible assets of each industry as a percentage of the capital
stock. I focus on the intangibles ratio excluding goodwill as it is a better indicator for the purposes of this paper. The ratio has increased rapidly in the 2000s and is high-est for firms in nondurables, telecommunications, high-technology and healthcare. In nondurables, telecommunications and healthcare, this ratio exceeds 100% in the last period and exceeds 60% for firms in high-technology. While there is a significant increase in this ratio for firms in durables and machinery, for firms in energy and utili-ties, the increase seems negligibly small. Figure 14 includes the estimated off-balance-sheet intangibles according to Peters and Taylor (2017). A similar picture appears with these estimations too, although the ratios are significantly higher.
Fig. 10. Number of firms among ‘top 1,000 firms only’ each year, period averages
Source: Author’s calculations from Compustat database. See Appendix A1 for variable definitions and calculations.
Fig. 11. Total assets of each industry as a percentage of total assets of the ‘top firms sample’ period
averages.
Source: Author’s calculations from Compustat database. See Appendix A1 for variable definitions and calculations.
Fig. 12. Intangible assets as a percentage of capital stock, ‘top firms sample’.
Source: Author’s calculations from Compustat database and Peters and Taylor’s (2017) estimates of off-balance sheet intangibles. See Appendix A1 for variable definitions and calculations.
Fig. 13. Intangible assets (excluding goodwill) as a percentage of capital stock, by industry and
period averages, ‘top firms sample’.
Source: Author’s calculations from Compustat database. See Appendix A1 for variable definitions and calculations.
Fig. 14. Intangible assets (excluding goodwill, including P&T off-balance-sheet intangibles) as a
percentage of capital stock, by industry and period averages, ‘top firms sample’. Source: Author’s calculations from Compustat database and Peters and Taylor’s (2017) estimates of off-balance sheet intangibles. See Appendix A1 for variable definitions and calculations.
4.5 Investment and profit trends
I suggested above that the use of intangible assets could lead to higher profits for firms without a corresponding increase in their investment levels. This would imply that firms with higher intangible assets would have higher pricing power and lower invest-ment to cash flow ratios. I start by looking at a simple markup indicator defined as: (Sales-Cost of Sales)/Cost of Sales). In Figure 15, we observe that while markups have been increasing on average, the increase in the 1990s and especially in the 2000s is quite visible in three industries: nondurables, high-technology and healthcare—indus-tries with high intangible assets to capital stock ratios. Firms in telecommunications, another industry with a large volume of intangible assets, also increased their markups, while the markups in industries with low volumes of intangible assets—energy, shops and utilities—do not show large increases.
The question that immediately comes to mind is whether these firms have high fixed costs, which would then cut into the high markups. In order to control for that, I add the depreciation of capital to the markup definition in Figure 16: (Sales-Cost of Sales − Depreciation)/(Cost of Sales + Depreciation). Clearly, this new markup rate is lower for all industries. However, the increase in the markups of three industries— nondurables, high-technology and healthcare—is still clearly visible. Similarly, when we look at the profit rates for each industry in Figure 17, we see that firms in these industries display the highest profit rates with large increases in the last decade.
Next, I look at the investment–profit puzzle through these industry groupings.
Figure 18 displays period averages for capital expenditures as a percentage of cash
Fig. 15. Simple markup by industry, period averages, ‘top firms sample’.
Source: Author’s calculations from Compustat database. See Appendix A1 for variable definitions and calculations.
Fig. 16. Total cost markup by industry, period averages, ‘top firms sample’.
Source: Author’s calculations from Compustat database. See Appendix A1 for variable definitions and calculations.
Fig. 17. Industry profit rates, period averages, ‘top firms sample’.
Source: Author’s calculations from Compustat database. See Appendix A1 for variable definitions and calculations.
flow. When we look at the intangible-intensive industries, we observe a clear decline in this ratio. For firms in nondurables and high-technology, the investment to cash flow ratio in the last period is as low as 25% in the last period and for firms in healthcare, it is even below 20%. The highest investment to cash flow ratios are in energy and utilities, industries that are location specific and have very low intangible asset ratios. Especially for energy, the increase after 2008 is not surprising given that fossil fuel companies began making very large investments, including investments in the new fracking method, to take advantage of expensive fuel sources when oil prices hit $100 a barrel.8
4.6 Industry shares
Finally, I look at the implications of the change in the composition of the nonfinan-cial corporate sector, highlighted in Section 4.2. In Table 2, we see each indus-try’s shares in total investment and total profits for the top 1,000 sample. The last column shows the percentage change in each variable from the first period to the last period. First, investment share of nondurables, durables and machinery in gen-eral has declined. This decline is in line with the decline in the number of firms in these groups and the general decline in their weight within the nonfinancial cor-porate sector. While this decline in number and weight was made up mostly by high-technology and healthcare firms, the decline in investment is not made up by firms in these industries. In fact, even though the share of high-technology and
Fig. 18. Investment to cash flow ratio by industry, period averages, ‘top firms sample’.
Source: Author’s calculations from Compustat database. See Appendix A1 for variable definitions and calculations.
8 For utilities firms, high investment costs may have been imposed on them by regulations.
T
ab
le 2.
In
vestment and profit shares of industr
ies as a percentag
e of total sample in
vestment and total sample profits
, per iod a ver ag es , ‘top fir ms sample’ 1973–80 1981–90 1991–2000 2001–07 2008–16 Ra te of change from the fir st per iod to
the last per
iod Nondurables In vestment 3.9% 4.1% 3.8% 2.9% 2.5% −35.1% Profits 5.9% 6.1% 6.9% 6.2% 5.5% −7.4% Durables In vestment 5.1% 5.7% 8.2% 5.8% 3.0% −40.7% Profits 5.9% 5.9% 7.3% 4.5% 2.9% −51.5% Machiner y In vestment 14.7% 12.6% 10.7% 7.1% 6.9% −53.2% Profits 17.5% 13.2% 13.0% 11.3% 11.0% −37.4% Energy In vestment 16.9% 15.5% 10.8% 14.5% 22.9% 35.3% Profits 16.0% 13.2% 7.7% 9.7% 9.2% −42.7% T elecommunica tions In vestment 15.5% 16.9% 19.4% 14.9% 9.9% −36.0% Profits 13.6% 17.6% 16.6% 14.6% 12.1% −11.3% Shops In vestment 4.8% 5.5% 7.7% 9.6% 7.5% 54.5% Profits 6.1% 6.5% 7.2% 8.9% 9.4% 54.8% Utilities In vestment 23.3% 18.8% 13.2% 18.5% 23.0% −1.4% Profits 17.9% 18.7% 15.2% 13.8% 13.0% −27.5% Other In vestment 8.6% 12.2% 15.3% 15.4% 14.1% 63.8% Profits 7.9% 9.2% 12.2% 14.1% 13.2% 66.0% High-technology In vestment 5.4% 6.2% 7.4% 6.8% 7.2% 33.6% Profits 6.6% 6.4% 8.8% 9.9% 15.5% 133.7% Healthcare In vestment 1.5% 2.3% 3.2% 4.0% 2.7% 76.4% Profits 2.4% 3.2% 5.2% 7.2% 8.3% 240.9% Source: Author’ s calcula
tions from Compusta
t da tabase. See Appendix A1 for v ar
iable definitions and calcula
tions
.
healthcare firms in terms of their total assets has tripled from the 1990s to the 2010s (Figure 11), their share of investment increased much less. The decline in the investment shares of nondurables, durables and machinery is mostly made up by an increase in the investment share of firms in energy and utilities. Second, while for durables and machinery, there is a concomitant decline in the share of total profits, it appears that nondurables protected their profit share by and large. Table 3. Financialisation indicators by industry, period averages, ‘top firms sample’
1991–2000 2001–07 2008–16
Nondurables Shareholder payments to cash
flow ratio 44.5% 51.6% 63.2%
Financial assets to capital stock
ratio 25.0% 44.4% 77.7%
Durables Shareholder payments to cash
flow ratio 15.1% 17.7% 20.5%
Financial assets to capital stock
ratio 25.3% 64.5% 83.5%
Machinery Shareholder payments to cash
flow ratio 30.4% 39.1% 46.6%
Financial assets to capital stock
ratio 25.1% 37.5% 47.7%
Energy Shareholder payments to cash
flow ratio 32.5% 33.4% 52.3%
Financial assets to capital stock
ratio 14.9% 22.4% 17.6%
Telecommunications Shareholder payments to cash
flow ratio 22.3% 28.9% 33.5%
Financial assets to capital stock
ratio 21.1% 33.5% 24.3%
Shops Shareholder payments to cash
flow ratio 22.9% 43.9% 51.9%
Financial assets to capital stock
ratio 18.0% 22.2% 23.8%
Utilities Shareholder payments to cash
flow ratio 33.9% 31.2% 25.6%
Financial assets to capital stock
ratio 5.9% 10.0% 8.6%
Other Shareholder payments to cash
flow ratio 21.1% 25.3% 27.3%
Financial assets to capital stock
ratio 50.2% 52.3% 54.3%
High-technology Shareholder payments to cash
flow ratio 29.3% 67.9% 54.4%
Financial assets to capital stock
ratio 71.6% 153.6% 220.7%
Healthcare Shareholder payments to cash
flow ratio 42.6% 57.5% 50.5%
Financial assets to capital stock
ratio 29.6% 60.6% 63.7%
Source: Author’s calculations from Compustat database. See Appendix A1 for variable definitions and calculations.
Moreover, the profit shares of firms in high-technology and healthcare increase much faster than their share in total investment. All in all, nondurables, the profit share of high-technology and healthcare firms (firms with high intangible to capital stock ratios) increase faster than their share of investment.
4.7 Financialisation trends
Before concluding this part, I look at two indicators of financialisation for each industry since the 1990s. Table 3 presents shareholder payments (dividends plus share buybacks) as a percentage of cash flow and financial asset holdings as a percentage of capital stock. Shareholder payments as a ratio of cash flow increase steadily for all industries except utilities. In the last period, this ratio is above 50% for nondurables, energy, shops, high-technology and healthcare. On the other hand, the financial assets to capital stock ratio also increases for most industries but the high-technology firms diverge from the rest of the sample with record amounts of financial assets, followed by firms in nondurables, machinery and healthcare. In fact, the high-technology firms have recently been in the spotlight as it was claimed that they were holding most of their foreign earnings over-seas [Kocieniewski, 2016; Wong, 2016; United Nations Conference on Trade and
Development (UNCTAD), 2017, p. 173]. Location-specific industries, energy,
utilities and shops that require high levels of investment demonstrate lower finan-cial assets to capital stock ratios. Although it is beyond the scope of this paper, this simple overview suggests potential links and overlaps between the financiali-sation processes and the increased use of intangible assets that need to be further explored. Pagano (2014), for example, argues that the financialisation processes and investment in intangible assets (especially knowledge assets) complement and re-inforce each other (p. 1422).
4.8 Summary and discussion
I suggested that the increased use of intangible assets by NFCs should be consid-ered as another layer in explaining the investment–profit puzzle, in conjunction with financialisation and globalisation hypotheses. Intangibles can be used in four ways by NFCs: First, the use of intangibles such as patents creates absolute monopolies for certain sectors. Second, intangibles such as brand names and trademarks enable firms to gain pricing power in markets that could otherwise have higher degrees of competi-tion. Third, intangibles can also serve as barriers to entry, especially in industries that can be considered intangible intensive. Finally, intangibles such as copyrights serve to generate artificial scarcity for products that have reproduction costs tending to zero. In all these cases, firms would be able to increase their profits without necessarily making a corresponding increase in investment in fixed capital. When we look at a sample of large NFCs, we observe the following: (i) The intangible assets to capital stock ratio increased in general but this increase is highest for firms in high-technology, health-care, nondurables and telecommunications. (ii) Industries with higher intangible asset ratios have lower investment to profit ratios. (iii) Industries with higher intangible asset ratios have higher markups and profitability. (iv) The composition of the nonfinancial corporate sector has changed and the weight of high-technology and healthcare firms have increased. However, this increase does not correspond to an equal increase in
their investment share. The decline in the investment share of durables, nondurables and machinery is made up mostly by firms in location-specific industries, most notably in energy and utilities. Location-specific industries in general have steady markups and higher levels of investment to profit ratios. (v) Yet, intangible-intensive industries’ prof-itability has increased faster than their share of investment or total assets. For example, while high-tech represents around 10% of total investment, it receives around 20% of total profits. All in all, these findings are in line with the suggestion that the increased reliance of firms on intangible assets enables them to have higher profitability without a corresponding increase in investment. A group of NFCs in manufacturing increasingly offshored their production while relying on intangible assets such as brand names and trademarks to increase their market power and profitability. NFCs in high-technology and healthcare, on the other hand, also relied on intangible assets such as intellectual property rights, patents etc. to increase their profitability. For both types of firms, investment to profit ratios remained quite low. Investment to profit ratios have been high for location-dependent NFCs operating in industries such as energy and shops.
The industry- and firm-level analyses then reveal something we do not readily observe in the aggregate data. A group of firms increased their spending on intan-gible asset creation, some of which is not captured in standard investment definitions, although, as noted above, spending on software and R&D is now included in invest-ment after revisions to the BEA’s national accounts. Spending on the creation of intan-gible assets is returned to the firms through an increase in the markups, leading to an overall increase in the amount of profits in the economy.
In addition to the measurement problems discussed above, we are also faced with a stock–flow consistency problem. Investment is usually understood as spending that is not required for current output but that will allow higher output over some extended period. At the same time, investment is also conceptualised as the creation of new capital and new means of production. This implies that there should be some kind of mapping between the flow of investment spending and an identifiable asset. However, in some cases such as R&D spending, we have identifiable flows without necessarily identifiable assets and in the case of goodwill, we have identifiable assets but no iden-tifiable flows. Capitalising of certain parts of R&D spending entirely depends on the legal framework and the same type of knowledge is not always capitalised the same way. On the other hand, when a firm pays an above-market price for another one during a merger, there is no asset associated other than the accounting construct of goodwill and there is no associated flow of real spending. Or, when marketing expenses are considered, the intangibles produced (such as brand names) generate brand loy-alty, which then leads to an increase in future prices and/or production. For example,
Corrado and Hao (2014) argue that brands should be considered as productive assets
as ‘… investments in brands generally create information for consumers and a stream of revenue for the firm…’ (p. 23). However, the meaningfulness of a ‘stock of brand loyalty’ from a macroeconomic perspective is questionable.
In short, there is a large range of investment-like activities that may function like investment at the level of the firm but that are difficult or impossible to capture as investment in the national accounts. Because a national-accounts measure of invest-ment needs to sum individual firms’ spending decisions into an aggregate flow and needs that flow to correspond to the change in an identifiable capital stock, things like marketing are inherently unsuitable to be treated as investment in the national