ONUR BİLGE PUSAT 113689011
ISTANBUL BILGI UNIVERSITY FACULTY OF SOCIAL SCIENCES
DEPARTMENT OF MARKETING
In Partial Fulfillment of the Requirements for the Degree Master of Arts
Marketing
Academic Advisor: Prof.Dr. Selime Sezgin Submitted: 05/01/2016
ACKNOWLEDGEMENTS
I would like to thank my thesis supervisor Prof.Dr. Selime SEZGİN for her endless encouragement and support. Throughout the thesis, her positive attitude has been the most encouraging force for me to pursue my thesis with an ambition. I am so grateful for her contribution to my thesis and my marketing knowledge.
I would like to express my thanks to Prof.Dr. Nimet URAY for her careful and constructive review of the final manuscript and attending my defense jury.
I wish to extend my thanks to Assist.Prof.Dr. Esra ARIKAN for her careful and constructive review of the final manuscript and attending my defense jury.
I also would like to thank Can ÇOBAN, Nesim TÜĞEN and their lovely wives for their friendship, support and the best memories.
I cannot forget to express my very profound gratitude to my family, my dear father Şemseddin PUSAT, my lovely mother Ayşe PUSAT and my precious brother Siraç PUSAT for their love and support.
Finally, my deepest gratitude belongs to my love Kübra AVRUPALI PUSAT. I have always felt her unfailing love, endless support and continuous encouragement through the process of researching and writing this thesis.
ABSTRACT
FACTORS AFFECTING SMEs’
POWER PROCUREMENT SATISFACTION
The primary objective of this thesis is to examine factors affecting the power procurement satisfaction of small and medium-sized enterprises in Marmara region of Turkey. The study also investigates the relationship between SMEs’ satisfaction level and SMEs’ loyalty with the independent variables of annual sales, the number of employees, risk aversion and type of industry.
Until recent years, Turkey’s power sector was dominated by a state-owned utility, TEK (Turkish Electricity Institution). However, there has been a proliferation of power supplier companies in Turkey following the gradual deregulation attempts in the Turkish Power Utility Sector. One of the main reasons of the increase in the number of power supplier companies is that eligible customer limit has been decreased from 9GWs/year to 4.000 kWh/year during the period between 2001 and 2015 by EMRA. EPK (Turkish Electricity Market Law) has enabled private sector investors to participate market operations such as power generation, distribution and wholesale/retail under the condition that they acquire the required licence. As a result, the level of competition, which never existed before, has started to rise enormously in all areas of Turkish Power Sector.
This study aims to contribute to the understanding of the developments in Turkish Power Industry, to understand the significance of service quality, to explore the critical dimensions of service quality, to test the relationship between service quality and customer satisfaction, to measure the relationship between customer satisfaction and customer loyalty. The empirical study is comprised of 45 questionnaires, which were derived from six different measurement scales.
ÖZET
KOBİLERİN ELEKTRİK TEDARİK MEMNUNİYETİNİ
ETKİLEYEN FAKTÖRLER
Bu tezin temel amacı Marmara bölgesinde yer alan küçük orta boy işletmelerin elektrik tedarik memnuniyetini etkileyen faktörleri incelemektir. Bu çalışma ayrıca yıllık ciro, çalışan sayısı, riskten kaçınma ve sektör tipi değişkenleriyle birlikte kobilerin memnuniyet düzeyiyle bağlılık dereceleri aralarındaki ilişkiyi araştırır.
Son yıllara kadar Türkiye elektrik sektörüne devlet mülkiyetinde olan Türkiye Elektrik Kurumu tarafından yön verilmekteydi. Ancak, Türk elektrik sektöründeki kademeli serbestleşme girişimlerinden sonra bu sektördeki tedarikçiler hızlı bir şekilde çoğalmaya başladı. Elektrik tedarik şirketlerinin sayısındaki artışın temel nedenlerinden biri Enerji Piyasası Düzenleme Kurumu’nun serbest tüketici limitini 2001 ile 2015 yılları arasında senelik 9GW’tan 4.000 kWh’a düşürmesidir. Türkiye elektrik piyasası kanunu özel sektör yatırımcılarına ilgili lisansları almaları koşuluyla üretim, dağıtım, toptan/perakende satış gibi piyasa operasyonlarına katılma hakkı tanımıştır. Sonuç olarak Türkiye elektrik sektörünün tüm alanlarında daha önce var olmayan rekabet seviyesi ciddi bir şekilde yükselmeye başladı.
Bu çalışma Türkiye elektrik sektöründeki gelişmeleri ve servis kalitesinin önemini anlamaya, servis kalitesinin önemli boyutlarını araştırmaya, servis kalitesi ve müşteri memnuniyeti arasındaki ilişkiyi test etmeye, müşteri memnuniyeti ve müşteri sadakati arasındaki ilişkiyi ölçmeye katkı sağlamayı amaçlamaktadır. Ampirik çalışma 6 farklı ölçüm skalasından elde edilen 45 sorudan oluşmaktadır.
TABLE OF CONTENTS
ACKNOWLEDGEMENTS……….….iv ABSTRACT……….…..v LIST OF FIGURES………..….…...xi LIST OF TABLES………...…...xiii 1. INTRODUCTION………...1 1.1. Research Background... 1 1.2. Research Problem... 3 1.3. Research Purpose ... 4 1.4. Study Outline ... 6 2. LITERATURE REVIEW………...7 2.1. Customer Satisfaction ... 72.1.1. Customer Satisfaction in Turkey’s Power Industry ... 10
2.2. Service……….. 11
2.3. Service Quality ... 12
2.4. Customer Satisfaction and Service Quality... 16
2.5. Customer Loyalty ... 18
2.6. Customer Loyalty and Customer Satisfaction... 19
2.7. Risk Aversion ... 20
2.8. Overview of the Turkish Power Sector ... 21
2.8.1. Turkish Electricity Market Reform ... 21
2.8.2. Market Structure ... 29
2.8.3. Turkish Electricity Wholesale/Retail Market ... 30
2.8.4. Regulatory Structure of Turkish Electricity Market ... 31
3.1. Research Design ... 32
3.2. Population……….35
3.3. Sample Selection ... 35
3.4. Data Collection... 35
3.5. Questionnaire Design ... 35
3.6. The Development of Theoretical Framework for Analysis ... 36
3.7. Main Research Constructs and Dimensions ... 38
3.7.1. Service Quality Construct ... 38
3.7.2. Satisfaction Construct ... 39
3.7.3. Risk Aversion Construct ... 39
3.7.4. Customer Loyalty Construct ... 40
4. DATA ANALYSIS AND DISCUSSION.………...42
4.1. Respondents' Profile ... 42
4.2. Demographic Variables ... 42
4.2.1. Respondents' Demographics – Type of Industry ... 42
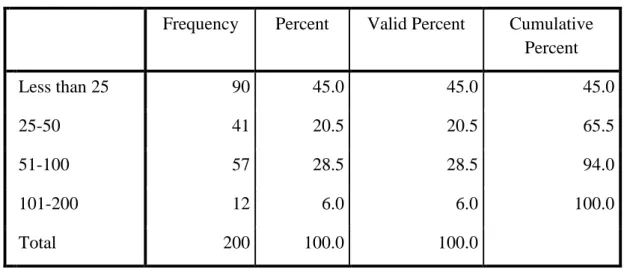
4.2.2. Respondents' Demographics – Annual Sales ... 44
4.2.3. Respondents' Demographics – The Number of Employees ... 45
4.3. Service Quality Analysis ... 46
4.3.1. Factor and Reliability Analysis for Service Quality ... 46
4.4. Customer Satisfaction Analysis ... 49
4.4.1. Factor and Reliability Analysis for Customer Satisfaction ... 49
4.4.2. Customer Satisfaction by Industry Type ... 51
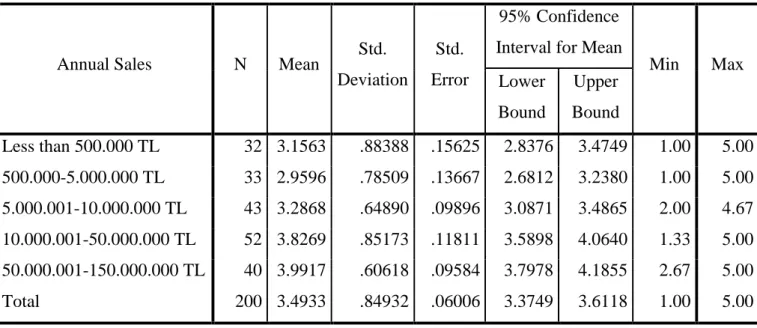
4.4.3. Customer Satisfaction by Annual Sales ... 52
4.4.4. Customer Satisfaction by the Number of Employees ... 54
4.5. Regression Analyses between Service Quality and Customer Satisfaction ... 55
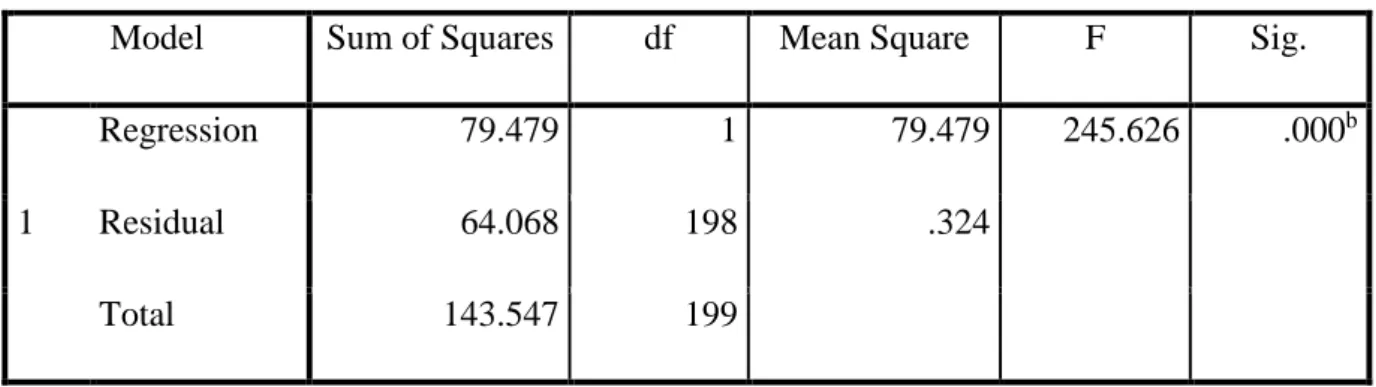
4.5.1. Simple Linear Regression between Empathy and Customer Satisfaction ... 55
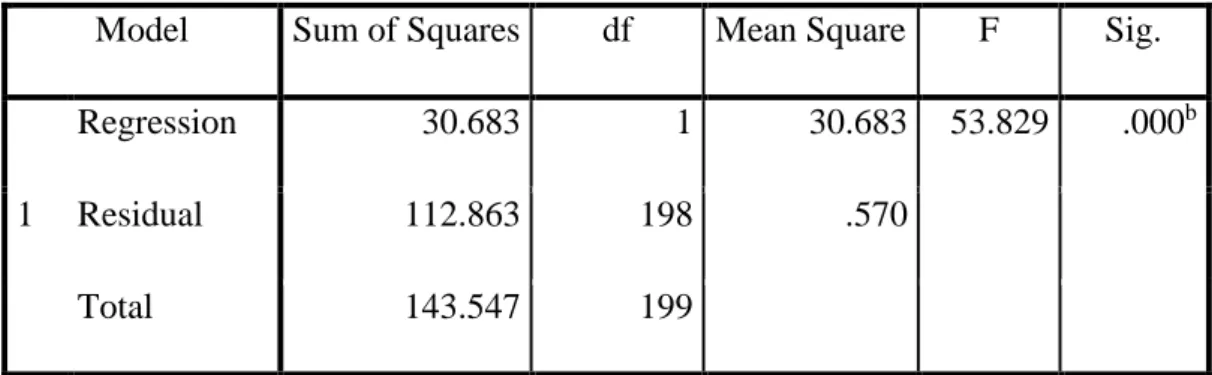
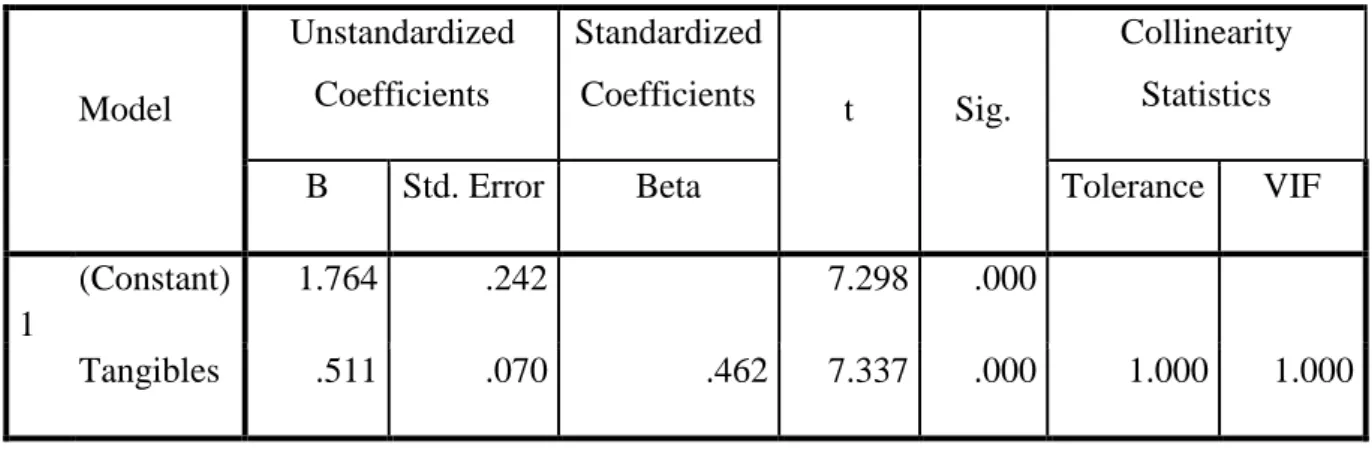
4.5.3. Simple Linear Regression between Tangibles and Customer Satisfaction .... 59
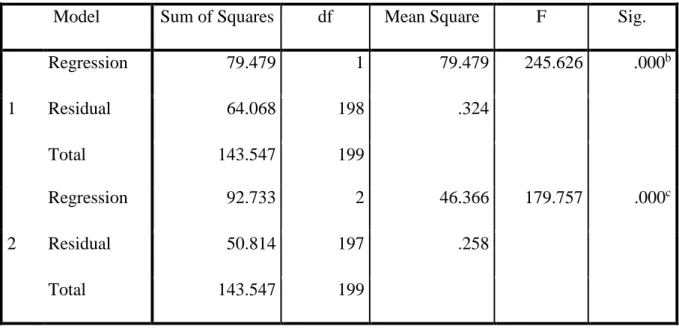
4.5.4. Multiple Linear Regression between Service Quality and Customer Satisfaction ... 61
4.6. Risk Aversion Analysis ... 64
4.6.1. Factor and Reliability Analysis for Risk Aversion ... 64
4.7. Customer Loyalty Analysis ... 66
4.7.1. Factor and Reliability Analysis for Customer Loyalty ... 66
4.8. Regression Analyses between Customer Satisfaction and Customer Loyalty ... 70
4.8.1. Simple Linear Regression between Customer Satisfaction and Behavioral-Intentions Loyalty ... 70
4.8.2. Simple Linear Regression between Customer Satisfaction and Price Loyalty ... 71
4.9. Regression Analysis between Customer Satisfaction, Type of Industry and Customer Loyalty………..73
4.9.1. Multiple Linear Regression between Customer Satisfaction, Type of Industry and Behavioral-Intentions Loyalty ... 73
4.9.2. Multiple Linear Regression between Customer Satisfaction, Type of Industry and Price Loyalty ... 75
4.10. Regression Analysis between Customer Satisfaction, Company Size and Customer Loyalty………..76
4.10.1. Multiple Linear Regression between Customer Satisfaction, Annual Sales and Behavioral-Intentions Loyalty ... 76
4.10.2. Multiple Linear Regression between Customer Satisfaction, Annual Sales and Price Loyalty ... 78
4.10.3. Multiple Linear Regression between Customer Satisfaction, The Number of Employees and Behavioral-Intentions Loyalty ... 80
4.10.4. Multiple Linear Regression between Customer Satisfaction, The Number of Employees and Price Loyalty ... 81
4.11. Regression Analysis between Customer Satisfaction, Risk Aversion and Customer
Loyalty………..84
4.11.1. Regression Analysis between Customer Satisfaction, Risk Aversion and Behavioral-Intentions Loyalty ... 84
4.11.2. Regression Analysis between Customer Satisfaction, Risk Aversion and Price Loyalty ... 85
5. CONCLUSION OF THE RESEARCH………88
6. MANAGERIAL IMPLICATIONS ……….………91
7. FUTURE RESEARCH……….………91
REFERENCES………..………...92
LIST OF FIGURES
Figure 1.1. Structure of thesis.…….………...………..6
Figure 2.1. Kano model…….……….………...9
Figure 2.2. Grönroos model of service quality ... 13
Figure 2.3. GAP model. ... 15
Figure 2.4. Parasuraman’s zone of tolerance ... 16
Figure 2.5. Customer perceptions of service quality and customer satisfaction ... 18
Figure 2.6. Service loyalty classification scheme ... 19
Figure 2.7. Turkey gross electricity demand ... 23
Figure 2.8. GDP growth-electricity demand growth ... 23
Figure 2.9. Demand forecast ... 24
Figure 2.10. Annual electricity consumption per person ... 25
Figure 2.11. Turkish electricity market reform milestones ... 26
Figure 2.12. Eligibility threshold-market openness. ... 28
Figure 2.13. Market structure ... 29
Figure 2.14. Electricity procurement in 2013 ... 30
Figure 3.1. Theoretical framework for this study. ... 36
Figure 4.1. Industry frequency pie chart………..43
Figure 4.2. Annual sales frequency pie chart ... 44
Figure 4.3. The number of employees frequency pie chart. ... 45
Figure 4.4. Regression for empathy and customer satisfaction ... 55
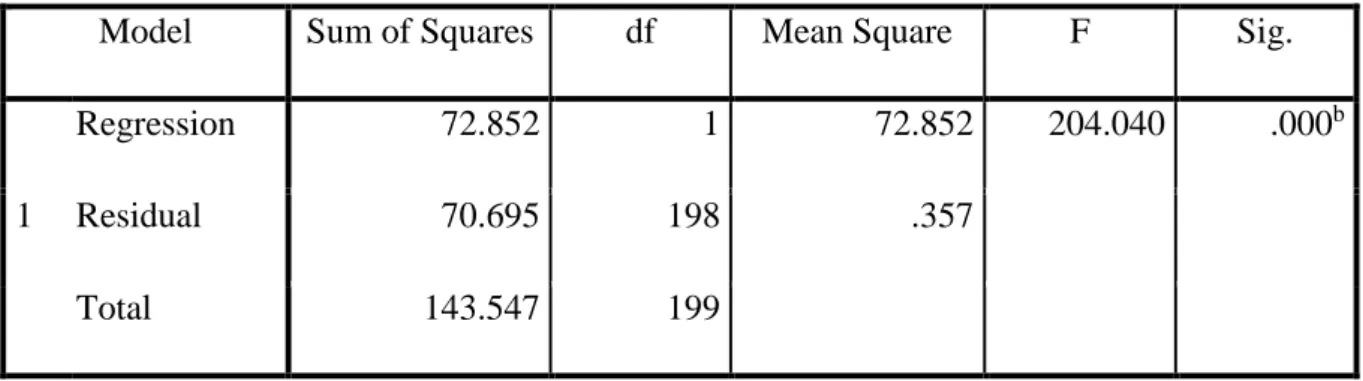
Figure 4.5. Regression for reliability and customer satisfaction ... 57
Figure 4.6. Regression for tangibles and customer satisfaction. ... 59
Figure 4.7. Multiple regression for service quality and customer satisfaction ... 61
Figure 4.8. Regression for customer satisfaction and behavioral-intentions loyalty ... 70
Figure 4.9. Regression for customer satisfaction and price loyalty ... 72
Figure 4.10. Regression for customer satisfaction, type of industry and behavioral-intentions loyalty ... 73
Figure 4.11. Regression for customer satisfaction, type of industry and price loyalty .... 75
Figure 4.12. Regression for customer satisfaction, annual sales and behavioral-intentions loyalty. ... 77
Figure 4.13. Regression for customer satisfaction, annual sales and price
loyalty……….………..79 Figure 4.14. Regression for customer satisfaction, the number of employees
and behavioral-intentions loyalty. ... 80 Figure 4.15. Regression for customer satisfaction, the number of employees and
price loyalty………..82 Figure 4.16. Regression for customer satisfaction, risk aversion and
behavioral-intentions loyalty. ... 84 Figure 4.17. Regression for customer satisfaction, risk aversion and
LIST OF TABLES
Table 2.1. The distinction between customer satisfaction and service quality...17
Table 2.2. Main steps in electricity reform ... 22
Table 2.3. Annual eligible customer limit ... 27
Table 3.1. Research methodology. ... 33
Table 3.2. Parasuraman, Zeithaml and Berry’s Service Quality Construct (1988) ... 38
Table 3.3. Cronin, Brady, and Hult’s Customer Satisfaction Construct (2000). ... 39
Table 3.4. Mandrik and Bao’s Risk Aversion Construct (2005) ... 40
Table 3.5. Zeithaml, Berry, and Parasuraman’s Behavioral Intentions Loyalty Construct (1996) ... 40
Table 3.6. Foster and Cadogan’s Attitudinal Loyalty Construct (2000) ... 41
Table 3.7. Foster and Cadogan’s Price Loyalty Construct (2000) ... 41
Table 4.1. Frequency distribution of industry………..43
Table 4.2. Frequency distribution of annual sale ... 44
Table 4.3. Frequency distribution of number of employees. ... 44
Table 4.4. KMO and Bartlett's test for service quality ... 46
Table 4.5. Rotated component matrix for service quality ... 47
Table 4.6. Factor and reliability test results for service quality ... 48
Table 4.7. KMO and Bartlett's test for customer satisfaction ... 49
Table 4.8. Component matrix for customer satisfaction ... 50
Table 4.9. Factor and reliability test result for customer satisfaction ... 50
Table 4.10. ANOVA test result for customer satisfaction by industry type ... 52
Table 4.11. Levene statistics test result ... 53
Table 4.12. ANOVA table for customer satisfaction by annual sales ... 53
Table 4.13. ANOVA test result for customer satisfaction by annual sales ... 54
Table 4.14. ANOVA test result for customer satisfaction by number of employees ... 55
Table 4.15. ANOVA table for customer satisfaction with the variable of empathy. ... 56
Table 4.16. Coefficients table for customer satisfaction with variable of empathy ... 56
Table 4.17. Model summary table for customer satisfaction with variable of empathy ... 57
Table 4.18. ANOVA table for customer satisfaction with the variable of reliability ... 58
Table 4.20 Model summary table for customer satisfaction with variable of reliability . 59
Table 4.21. ANOVA table for customer satisfaction with the variable of tangibles ... 59
Table 4.22. Coefficients table for customer satisfaction with variable of tangibles ... 60
Table 4.23. Model summary table for customer satisfaction with variable of tangibles .. 60
Table 4.24. ANOVA table for customer satisfaction with at least one variable ... 62
Table 4.25. Coefficients table for customer satisfaction with at least one variable. ... 63
Table 4.26. Model summary table for customer satisfaction with at least one variable ... 63
Table 4.27. KMO and Bartlett's test for risk aversion ... 64
Table 4.28. Component matrix for risk aversion ... 65
Table 4.29. Factor and reliability test result for risk aversion. ... 66
Table 4.30 KMO and Bartlett's test for customer loyalty. ... 67
Table 4.31. Rotated component matrix for customer loyalty ... 68
Table 4.32. Factor and reliability test result for customer loyalty ... 69
Table 4.33. ANOVA table for behavioral-intentions loyalty with the variable of customer satisfaction ... 70
Table 4.34. Coefficients table for behavioral-intentions loyalty with the variable of customer satisfaction ... 71
Table 4.35. Model summary table for behavioral-intentions loyalty with the variable of customer satisfaction. ... 71
Table 4.36. ANOVA table for price loyalty with the variable of customer satisfaction .. 72
Table 4.37. Coefficients table for price loyalty with the variable of customer satisfaction………72
Table 4.38. Model summary table for price loyalty with the variable of customer satisfaction……… ... 73
Table 4.39 ANOVA table for behavioral-intentions loyalty with the variables of customer satisfaction and type of industry. ... 74
Table 4.40 Coefficients table for behavioral-intentions loyalty with the variables of customer satisfaction and type of industry ... 75
Table 4.41. ANOVA table for price loyalty with the variables of customer satisfaction and type of industry ... 76
Table 4.42. Coefficients table for price loyalty with the variables of customer satisfaction and type of industry ... 76
Table 4.43. ANOVA table for behavioral-intentions loyalty with the variables of
customer satisfaction and annual sales. ... 77 Table 4.44. Coefficients table for behavioral-intentions loyalty with the variables of customer satisfaction and annual sales ... 78 Table 4.45. ANOVA table for price loyalty with the variables of customer satisfaction and annual sales ... 79 Table 4.46. Coefficients table for price loyalty with the variables of customer satisfaction and annual sales ... 80 Table 4.47. ANOVA table for behavioral-intentions loyalty with the variables of
customer satisfaction and the number of employees ... 81 Table 4.48. Coefficients table for behavioral-intentions loyalty with the variables of customer satisfaction and the number of employees ... 81 Table 4.49. ANOVA table for price loyalty with the variables of customer satisfaction and the number of employees ... 82 Table 4.50. Coefficients table for price loyalty with the variables of customer satisfaction and the number of employees ... 83 Table 4.51. Model summary table for price loyalty with the variables of customer
satisfaction and the number of employees ... 83 Table 4.52. ANOVA table for behavioral-intentions loyalty with the variables of
customer satisfaction and risk aversion.. ... 84 Table 4.53. Coefficients table for behavioral-intentions loyalty with the variables
of customer satisfaction and risk aversion ... 85 Table 4.54. ANOVA table for price loyalty with the variables of
customer satisfaction and risk aversion ... 86 Table 4.55. Coefficients table for price loyalty with the variables of
1. INTRODUCTION
This chapter introduces the reader to the research background, research problem, research purpose and study outline.
1.1. RESEARCH BACKGROUND
There has been a variety of change in the transition period from the era of mass production to that of alternatives. The focus during the period between 1850s and late 1920s was gearing up manufacturing skills in order to expand production, since it was an era when demand is greater than supply. Consumers felt happy when they could get any kind of product or service regardless of its distinctive features or quality. From the 1930s to the mid 1950s the focus became selling more of what the business was able to produce. Hence, the orientation shifted from producing to selling. Finally, in order to differentiate what they offer companies started to adopt marketing orientation in the mid 1950s. The focus was no longer the products manufactured or service offered, but the needs of consumers who use the product or service. In today’s competitive business world, the ultimate aim of all marketing activities is to acquire and retain customers who contribute to the profitability of a company.
Business organizations are now striving to understand their customers so that they can build a long-term profitable relationship with them [1]. Although keeping customers for a long period requires much effort, it is six times cheaper to retain existing customers than to acquire new customers in today’s business environment [2]. As a result, entrepreneurs who would like to establish a profitable and sustainable business have become more responsive to acquiring and retaining profitable customers via understanding their needs, wants and expectations.
One of the most significant factors that determines the success of any business is the degree to which the quality of its product or service meets and exceeds customer expectation from the use of a particular product or service. Due to the fact that customers were perceived as someone who did not know what they want, quality was determined and interpreted from business owners’ perspective with little consideration of what customers really want and
expect before the era of marketing. Nowadays, customers’ interpretation of product or service quality can be seen as the foremost step before making a decision about launching a product or service. Having a large variety of alternatives and more developed and accessible information tools, customers have gained much power in the buyer-seller relationship. Becoming more rational and powerful, customers have become maximizers of their utility by selecting goods and services that offer high quality with less price.
While the quality of a product is something hard to measure, it has become even harder to evaluate when the topic is service quality. When purchasing goods the consumer can have a lot of tangible cues to judge quality such as package, style, color etc. However, when purchasing a service, tangible cues are usually limited to the service provider’s facilities, personnel and equipment [3]. Furthermore, when a service provider has knowledge about how the service will be evaluated by the consumer, it has become possible to influence these evaluations in the desired direction [4].
Even though there is not a universal consensus on how service quality can be determined and measured, its key role in determining customer satisfaction has been widely accepted not only by marketing academia but also by marketing practitioners. Therefore, developing an understanding on the customers’ evaluation system of service quality is significant. Consumers can evaluate the quality of goods and services with a classification system that includes three categories; search properties, experience properties and credence properties. Search properties are features that consumers give careful consideration before making a purchase. They are tangibles that consumers can see, touch or feel. Experience properties are post-purchase attributes that can be assessed either after purchase or during consumption. Finally, credence properties are characteristics that few consumers have sufficient knowledge and skill to evaluate whether the given service is necessary or is performed properly. When considering this classification, power utility services can be put under the category of the experience types, since customers generally do not have the required expertise, skill and knowledge to make evaluations [3].
Another significant factors that determines the long-term survival and success of any business is the degree to which the company achieves customer loyalty. Due to technological advancements, customers have become more powerful in terms of product, service or brand knowledge. With the aim of maximizing their own utility and profit, they have begun to look not only for alternative products or services but also for brands that offer the similar product
or service with less cost. In an environment where customers consistently evaluate all alternatives, it becomes harder to establish true customer loyalty for any firm. Those who succeed to create a certain level of customer loyalty are more likely to make sufficient amount of profit for survival and further development. According to a research, net present value increase in profit that results from a 5% increase in customer retention varies between 25 and 95% over 14 industries [2-5]. Also, others put forward that the relative cost of customer retention is considerably less than that of acquisition [6]. How customer loyalty can be achieved is a commonly asked question not only by marketing academia but also by business owners who are well aware of the importance and advantages of customer retention. It can be argued that there can be numerous variables contributing to customer loyalty. However, customer satisfaction can be shown as one of the most significant factors paving the way to reach customer loyalty. It can be expected that if a customer is satisfied with a firm, service or product, then a greater level of customer loyalty can be attained. Customer satisfaction is positively related to customer loyalty and organizational profits [7]. Nevertheless, although loyal customers are those who are typically well satisfied, satisfaction may not universally translate into loyalty. In fact, satisfaction is a necessary step in loyalty formation but becomes less important as loyalty begins to set through other mechanisms [8].
1.2. RESEARCH PROBLEM
“A research problem is a statement about an area of concern, a condition to be improved upon, a difficulty to be eliminated, or a troubling question that exists in scholarly literature, in theory, or in practice that points to the need for meaningful understanding and deliberate investigation.” [9].
In general, a problem statement blueprints the basic facts of the problem, explain why the problem matters, and identify a solution as quickly and directly as possible. It can be argued that all researches are formulated with the existence of a problem.
There has been a proliferation of power utility service companies in Turkey following the gradual deregulation attempts in the Turkish Electric Utility Sector. Eligible customer limit has been decreased from 9GWs/year to 4.000 kWh/year during the period between 2001 and 2015 by EMRA. Foreseeing the potential profit with the enlargement of the market, many companies have started to take a role in electricity business such as generation,
distribution and wholesale/retail. Those who hold electricity wholesale-retail sales license generally focused on small and medium sized enterprises due to the two main reasons. First, electricity consumption per person is about 3.200 kWh/year in Turkey (it is lower than eligible customer limit) [10]. Hence, a large proportion of household cannot be evaluated under the category of eligible customers. Second, the majority of electricity generating companies target big industrial firms and it is nearly impossible for electricity wholesale-retail firms to win price competition against them. As the number of companies that offer electric utility service has increased, the concept of “competition” has begun to be spelled in the Turkish Electric Retail Industry. The number of licensed wholesale companies increased from 41 to 172 during the period between 2009 and 2014, which has brought consumer centric strategies to be implemented in the industry [10-12]. As a result, especially customers who have experience of buying electricity from a private electricity supplier begin to evaluate electricity providers based on their perceived service quality. Due to the fact that service quality criteria of service providers might be different from those of customers, it is significant to understand the customer perception and expectation of quality in terms of electric utility service. Hence, it is important to correctly measure and research the service quality factors and their relationship with customer satisfaction. In addition this study will also examine the relationship between customer satisfaction and customer loyalty with some independent variables including type of industry, company size and risk aversion. All in all the research problems are formulated as:
What is the relationship between service quality factors and SMEs’ power procurement satisfaction?
What is the relationship between SMEs’ power procurement satisfaction and SMEs’ loyalty?
What is the influence of company size, type of industry and risk aversion on the relationship between SMEs’ power procurement satisfaction and SMEs’ loyalty?
1.3. RESEARCH PURPOSE
A statement of research purpose basically explains what the aim of the study is, what hypothesis will be tested and what kind of literature will be used. By determining research purpose the stage of the rest of research plan is formulated systematically.
With the existence of a variety of suppliers who offer similar products and services, a majority of companies have abandoned the notion that customers have to rely on them. In contrast to production era of marketing, customer satisfaction has begun to be the core focus of every company in recent years. One of the most significant factors to ensure customer satisfaction is product/service quality. In today’s competitive business world, any firm that aims long-term survival and prosperity must be keen on to improve customers’ perceived product or service quality (the only exception might be some government regulated monopolies). Before deregulation attempts for Turkish electricity business started, the concepts of customer satisfaction and service quality were something beyond imagination of almost every individual in Turkey. An ordinary person, a small business enterprise or a factory owner could not evaluate his/her satisfaction level or perceived service quality, since electricity was seen as a necessity service that is given only by TEAŞ. If you experience long outages, there was no option except waiting for the problem to be fixed by TEAŞ. If you experience any other technical problem, it might last a week or more for TEAŞ to fix the problem. If your electricity bill does not arrive at all, your persistent complaints might not be solved in a short time period by TEAŞ. There are a lot of these kinds of “If” sentences, but customers did not have any available supplier other than TEAŞ. Eventually, as a result of liberalization attempts, Turkish electricity market has started to be competitive during the last fourteen years. More and more companies started to take a role in power market either by generating, distributing or wholesaling electricity. While some started to establish or buy power plants and generate electricity, others prefer to be a wholesaler, retailer or distributor. Hence, service quality, customer satisfaction and customer loyalty have become essential factors for Turkish electricity procurement companies that have a desire to be a strong market player in the long-run.
In this research, factors affecting SMEs’ power procurement satisfaction will be examined. Also, this study will also explore the relationship between customer satisfaction and customer loyalty with some independent variables: type of industry, company size and risk aversion. Being in line with the research purpose, questions of
“What is customer satisfaction?”, “What is a service?”,
“What is a service quality?” “What is customer loyalty?”
“What is risk aversion?”
will be studied with the help of existing marketing literature.
1.4. STUDY OUTLINE
The study is presented in seven chapters (Figure 1.1). Chapter one is the introductory chapter that covers the research background, research problem, research purpose and study outline.
Chapter two is review of relevant literature that includes customer satisfaction, customer satisfaction in Turkey’s Electricity Industry, service, service quality, customer satisfaction and service quality, customer loyalty, customer loyalty and customer satisfaction, risk aversion overview of the Turkish Electricity Sector.
Chapter three presents the methodology of the study. It is comprised of research design, population, sample selection, data collection, questionnaire design, and development of theoretical framework for analysis, main research constructs and dimensions.
Chapter four covers the data analysis and discussion. Chapter five is the conclusion of the research.
Chapter six is the managerial implications of the research.
Finally, chapter seven is about future research opportunities related with this thesis.
IN TRO D UC TION REVIEW OF L IT ERATU RE M ET H O D O LOG Y D ATA AN AL YSIS & D IS CUS SION CON CL US ION O F T H E RESE ARCH M AN AG ERIA L IM P LICA TIO N S FU TURE RESEARCH
2. LITERATURE REVIEW
The aim of this section is to present literatures relevant to this research and to provide a theoretical framework. The chapter consists of a review of definitions and some models of customer satisfaction, service, service quality, customer loyalty and risk aversion. The relationship among service quality, customer satisfaction and customer loyalty, which leads to the conceptual frame work of the study, will also be analyzed. Finally, Turkish electricity market reform, market structure, Turkish electricity wholesale/retail market and regulatory structure of Turkish electricity market will be reviewed.
2.1. CUSTOMER SATISFACTION
In today’s challenging business world, any company that has a dream for establishing a sustainable business should develop a careful understanding of what is expected of the company from customer side and the degree to which the company is above this expectation.
Due to the fact that the expectation of customer is further used as a reference point against which performance is judged, it could be asserted that knowing what the customer expects is the first and probably most significant step in delivering a product or service. Consequently, before analyzing customer satisfaction, it would be convenient to start with the concepts of expectation and satisfaction. Oxford Dictionary defines expectation as ‘‘a strong belief that something will happen or be the case’’. Customer expectation was defined as a customer’s belief about a product before using it [13].
According to Cambridge Dictionary satisfaction is defined as ‘‘the act of fulfilling a need or wish’’. Similarly, Oxford Dictionary’s definition of satisfaction is ‘‘fulfilment of one’s wishes, expectations, or needs’’. In addition, satisfaction as a person’s feelings of pleasure, excitement, delight or disappointment which results from comparing a product’s perceived performance to his or her expectations [14]. Similarly, customer satisfaction is expressed as an evaluation process that compares consumption experience with what it was supposed to be [15].
When interpreting these short but meaningful explanations of satisfaction and expectation in the scope of marketing, it can be asserted that those who provide a product or a service that perfectly and persistently satisfies the needs, wants and expectations of a customer can be more likely to have a competitive advantage of having life-time, loyal customers.
Another customer satisfaction definition is ‘‘the buyer’s cognitive state of being adequately or inadequately rewarded for the sacrifices he has undergone’’ [16]. Thus, it can be asserted that it is unlikely for those, who value their sacrifices more than their reward, to show repurchase behavior in future.
Customers buy a product or service with pre-purchase expectations about anticipated performance and once the product or service is used, outcomes are compared against expectations. When there is a difference between expectation and outcome, disconfirmation occurs. When product or service performance exceeds expectation positive disconfirmation occurs. Also, if a firm achieves to provide customer satisfaction, a positive and emotional long-term relationship can be built with its customers. As a result, whenever a person recognizes any need for a particular product, he/she unconsciously and simultaneously search for the brand that is associated with this particular need [17]. Not surprisingly, it costs almost five times more to gain a new customer as it does to keep an existing customer [18]. Moreover, increasing customer satisfaction plays a key role in a company’s market share, which leads to improved profit, corporate image and long-term survival [2]. Furthermore, some studies have viewed the impact of customer satisfaction on repeat purchase, loyalty and retention and they stated that satisfied customers are most likely to share their experiences with other people with regards to about five to six people [19].
Additionally, satisfaction influences repurchase intentions whereas dissatisfaction is seen as a primary reason for customer defection or discontinuation of purchase [20]. Also, dissatisfied customers can choose to discontinue purchasing the goods or services and engage in negative word of mouth [21].
The Kano model of customer satisfaction classifies product attributes based on how they are perceived by customers and their effect on customer satisfaction. According to the model, there are three types of product attributes that fulfill customer satisfaction to a different degree:
1) basic or expected attributes,
2) performance or spoken attributes and 3) surprise and delight attributes [22].
A competitive product meets basic expected attributes, maximizes performance attributes, and includes as many “excitement” attributes as financially feasible. In the model, the customer strives to move away from having unfulfilled requirements and being dissatisfied.
Figure 2.1. Kano model [22].
The performance or spoken attributes (the central line of the model) are those expressed by customers when asked what they want from the product. Depending on the level of their fulfillment by the product, consumers become either satisfied or dissatisfied. The basic or expected attributes (lower curve in the model) are basic attributes, which customers take for granted. While the presence of these attributes is not taken into account, their absence is very dissatisfying. The surprise and delight attributes (upper curve in the model) lay beyond customer’s expectations. If they are available customers are exited, but their absence does not create dissatisfaction, since customers do not expect them.
A successful combination of expected and exciting attributes provides a company with an opportunity to achieve competitive advantage. A successful company does not correctly identify the basic requirements but also performance and delight attributes and use them to raise customer satisfaction.
Since a lot of researches have been carried out on the concept of customer satisfaction, many definitions have been formulated as to what customer satisfaction stands for. However, for the purpose of this paper while defining satisfaction, we refer to the SMEs’ satisfaction with the electricity service provided by utility companies.
2.1.1. Customer Satisfaction in Turkey’s Power Industry
There is nearly no empirical evidence on the state of customer satisfaction in the electricity industry in Turkey. Data on customer satisfaction regarding the service quality in the electricity industry is very crucial issue to look into because the industry regulators need to be empirically informed regarding how consumers generally feel about the service quality of the power procurement companies operating in the electricity industry. However, not many studies so far have been conducted to empirically support the claim that customers are satisfied or not with service delivery of electricity in Turkey. As EMRA has been gradually reducing the eligibility threshold to allow that privately produced power can be sold in the free market, more individuals have received the right of choosing their own electricity supplier. According to the last law, which was enacted at the beginning of 2015, customers with more than 4.000 kWh annual electricity consumption are allowed to have direct access to wholesale/retail market and procure their electricity via bilateral contracts with their suppliers under free market condition. However, 4.000 kWh annual electricity consumption can be rarely seen among households [12]. In order to measure general electricity procurement satisfaction level in Turkey, together with factors affecting it, the research should be done on a group whose members can benefit from the current annual electricity consumption threshold of the new law. Hence, in our study SMEs’ power procurement satisfaction will be analyzed.
2.2. SERVICE
Although there is not a single universal consensus on the definition of service among marketing academia, most common approach in defining services is the comparison of differences between services and physical products.
Services have five unique characteristics when compared to products. These characteristics include: intangibility, inseparability, variability, perishability and ownership [23].
Intangibility of a service means that services do not have tangible properties which can be examined and detected by customers before using the service. Customers cannot see, touch, or feel properties of the service before making a purchase. This intangibility, i.e. the lack of physical evidence makes it difficult for the customers to evaluate competing services in advance [23,24].
Inseparability means that a service cannot be separated from its means of production. A service is typically produced and consumed simultaneously. Producers and consumers must normally interact in the way that the service can be produced and the consumers must be present during the entire production process [25]. A service is described as an activity resulting in an outcome in a partly simultaneous production and consumption process [26]. This definition also gives support to the fact that service production/provision and consumption are simultaneous activities.
Because of the variability, services are difficult to be standardized. The variability depends on the customers as they always are part of the service production and the outcome. For a service delivery there is no possibility for pre-delivery inspection and rejection, i.e. quality control in order to ensure consistent standards for the service. Also the employees of the same company may provide services that are quite different from each others [23,24].
Perishability of a service put forward that services cannot be stored, but are consumed during the production process. The life span of a service is generally very short and if service providers are not able to estimate the demand of a service accurately, they have to face unnecessary costs because of unused service employees and facilities [23,24].
A service has no ownership, which is also related with the intangibility and perishability of a service. When purchasing goods, customers generally acquire the
ownership of the goods. However, when a service is performed, no ownership is transferred from the seller to the buyer. In the service production, the buyer merely acquires a right to a service process, e.g. for the use of a car parking lot [23].
The above discussions have illustrated some of the numerous characteristics of service. It could be deduced from the review that service is intangible, time based, and individualized.
2.3. SERVICE QUALITY
Even though there is not any consensus on the definition of service quality, various scholars and researchers have tried to identify the nature and elements of it. Service quality can be viewed as one of the most frequently studied topics in the service marketing literature especially in terms of the issue of quality measurement.
One of the earliest and most influential service quality models was introduced by Grönroos. In order to develop service marketing models, one needs to have a model of service quality that offers a clear understanding of how the quality of a service is perceived and evaluated by customers. In his service quality model, perceived service quality of a customer is a function of expected service, perceived service and image. Expected service can be interpreted as what a customer expects from a particular kind of service before he/she gets it. Perceived service on the other hand can be seen as something directly related with acquired service itself. Due to the fact that a positive or negative image of a service firm has an influence on a customer’s evaluation of the service he/she get, it is reasonable to suggest that image can be a variable of perceived service quality of a customer. A favorable and well-known image is one of the most valuable assets for any firm, since image of the firm has a severe impact on customer perception in many respects. If a service provider manages to establish a positive image in the minds of customers, it is less likely for customers to exaggerate minor mistakes. On the other hand, if a service provider has a negative image reputation, the result of any minor mistake is likely to be magnified by customers. Therefore, it can be asserted that image of the company has a huge impact on the evaluation of its services by customers. When analyzing the image quality, the technical quality and functional quality are the two fundamental categories. While technical quality dimension is a concept related with ‘‘what a customer receives as a result of his interaction with a service
firm’’, functional quality dimension answers the question of ‘‘how a customer gets functional outcome or quality’’ [27].
Figure 2.2 Grönroos model of service quality [27].
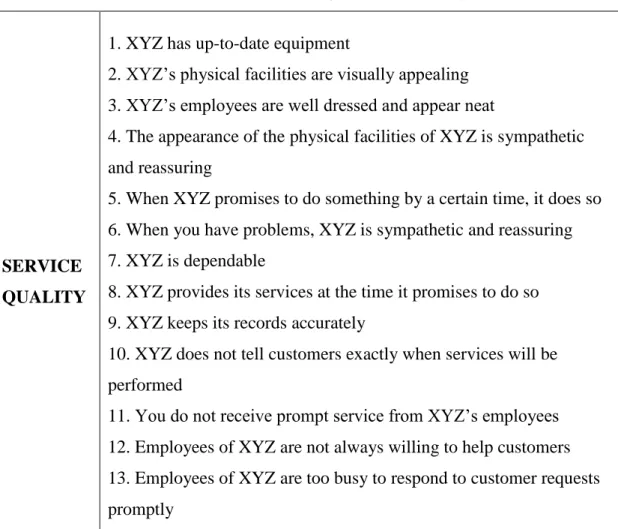
While there have been a lot of efforts to explain service quality, there has not been a general agreement on the measurement of quality in service sector. However, the majority of service quality researches have used SERVQUAL methodology in order to measure service quality [3]. SERVQUAL is founded on the view that the customer assessment of service quality is conceptualized as a gap between what the customer expects and their evaluations of the performance of a service provider [28]. Research of Parasuraman, Zeithaml and Berry revealed that the criteria used by consumers in assessing service quality fit 10 dimensions. These dimensions were tangibles, reliability, responsiveness, competence, courtesy, credibility, security, access, communication and understanding the customer. These ten dimensions and their descriptions served as a basic structure of the SERVQUAL scale:
Traditional marketing activities (advertising, field selling, PR, and pricing) and external influence by traditions, ideology, word of mouth
What? How? Perceived service quality Image Perceived service Technical quality Functional quality Expected service
Tangibles: Appearance of the company`s facilities, equipments, staff and communication tools.
Reliability: The company`s capability to provide the promised service in an exact and reliable manner.
Responsiveness: The company`s propensity to assist the clients and provide immediate services.
Competence: The information, knowledge, expertise required to provide the service. Courtesy: Friendliness, respect, attentiveness, politeness.
Credibility: Honorability, honesty. Security: No risk, no doubt.
Access: Availability, easy access, contact.
Communication: Informing the client in an understandable manner.
Understanding the customer: Efforts made in order to understand clients [3].
After realizing that there is a very strong statistical correlation between several factors, the model is reconstructed by reducing the original ten dimensions to five fundamental ones: tangibles, reliability, responsiveness, assurance/promise and empathy. The definitions of the two newly added dimensions are as follow:
Assurance/Promise: The information, knowledge, politeness of the employee`s of the company and their capability to convey trust and reliability towards clients.
Empathy: Personal, careful attention given to clients [29].
Although there is not a consensus on dimensions that determine service quality, majority of marketing researchers and academia have used SERVQUAL model of Parasuraman either as a means of measuring service quality or building a new service quality model [3]. Buttle states that SERVQUAL ‘‘has undoubtedly had a major impact on the business and academic communities’’ [28].
Similar to Grönroos, Parasuraman put forward that service quality is ‘‘a form of attitude, related but not equivalent to satisfaction, that results from comparison of expectations with perceptions of performance’’ [30]. In his ‘‘expectation-performance’’ gap model, he argued that the customer and organization may differ regarding how they perceive a particular service performance and this leads to ‘‘gaps’’ in providing the service.
GAP I: Consumers’ expectations are not well understood: The difference between customer’s expectation and management’s perceptions of these expectations.
GAP II: The mismatch of service quality standards: The difference between management’s perceptions of customer’s expectations and service quality specifications.
GAP III: Service performance discrepancy :The difference between service quality specifications and the actual service quality delivered.
GAP IV: The gap between actual service delivery and promises : The difference between service delivery and communications to customers about service delivery. GAP V: The mismatch of consumers’ expected service and perceived service : The
difference between the quality that the customer expects and the actual perceived quality [3].
Figure 2.3. GAP model [3].
Service delivery (including pre and
post contacts)
Translations of perceptions into service
quality specifications External communication to the consumer Management perceptions of the consumer expectations Perceived service Expected service Personal needs Past Experience Words of mouth communication GAP 3 GAP 1 GAP 2 GAP 4 GAP 5
Based on the premises of the SERVQUAL, Parasuraman also developed Zone of Tolerance Model. Instead of SERVQUAL’s original two scales (expectation & performance) Zone of Tolerance model applies three scales (desired service, adequate service & performance) [31,32].
Figure 2.4. Parasuraman’s zone of tolerance.
This model assumes that as long as customers’ perceived service quality level is between desired service level (what the customer hopes to receive) and adequate service level (what the customer accepts as sufficient), customer perceives the service as acceptable. The desired service expectation is the level of service that customers hope to receive. The adequate service expectation is the lowest level of performance that consumers can accept. The area between desired service and adequate service is described as zone of tolerance, which represent the range of service performance that customers are likely to tolerate.
Also it is argued that if the service delivered is within the zone, customers will be satisfied and if the service is better than their desired service level, customers consider service to be exceptionally superior. However, if the service falls below the zone of tolerance, customers will not show repurchase behavior due to the dissatisfaction and disappointment [33].
2.4. CUSTOMER SATISFACTION AND SERVICE QUALITY
There is no doubt that customer satisfaction and service quality are one of the most significant concepts for academicians studying consumer behavior and marketing practitioners who would like to create a competitive advantage by establishing a solid long term relationship with consumers.
Although quality and satisfaction have been conceptualized similarly in the literature, there appears to be at least relative consensus among marketing academia that customer satisfaction and service quality are independent constructs [34,35].
Table 2.1. indicates a number of distinction between customer satisfaction and service quality.
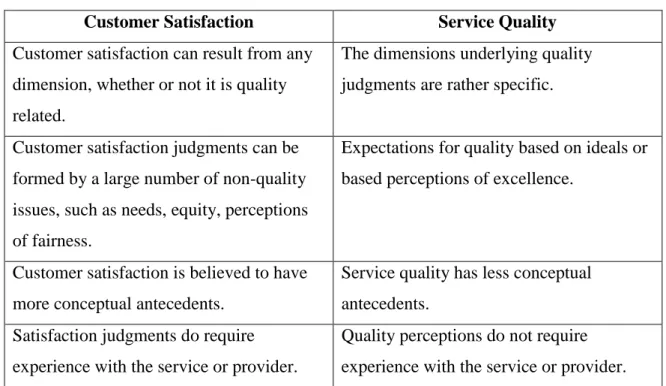
Table 2.1. The distinction between customer satisfaction and service quality [34,35].
Customer Satisfaction Service Quality
Customer satisfaction can result from any dimension, whether or not it is quality related.
The dimensions underlying quality judgments are rather specific.
Customer satisfaction judgments can be formed by a large number of non-quality issues, such as needs, equity, perceptions of fairness.
Expectations for quality based on ideals or based perceptions of excellence.
Customer satisfaction is believed to have more conceptual antecedents.
Service quality has less conceptual antecedents.
Satisfaction judgments do require experience with the service or provider.
Quality perceptions do not require experience with the service or provider.
Service quality is a component of customer satisfaction, since customer satisfaction can be considered to be based on the customer’s experience on a particular service [34]. Also, Parasuraman defended that there might be the mismatch of service quality standards between management’s perceptions of customer’s expectations and service quality specifications, which in turn cause customer dissatisfaction [3].
Service quality is an evaluation that reflect customer’s perception of reliability, responsiveness, assurance, empathy and tangibles. On the other hand, customer satisfaction is more comprehensive and complex construct that includes a variety of perceptions such as service quality, product quality, price, situational factors and personal factors [36].
Figure 2.5. Customer perceptions of service quality and customer satisfaction [36].
2.5. CUSTOMER LOYALTY
It is a well-known fact that as market competition becomes fierce, the value of keeping a customer on your side rises significantly. Generally, consumers with high levels of loyalty have a natural tendency to repurchase a product or service they are already familiar and satisfied with. As a result, those who succeed to build a long-lasting relationship with customers are more likely to take advantage of several factors including repeat business, reduced costs and positive word-of-mouth.
Most analyses have viewed loyalty as behavior, excluding attitudinal dimension [37]. However, it is claimed that a customer may not purchase frequently from a firm, even though he/she may feel something toward that firm [38]. Also, it is argued that loyalty should be considered much more than just repeat purchase; someone who continue to buy may be doing so out of inertia, indifference or exit barriers rather than loyalty [39]. Accordingly, two researchers developed a framework for customer loyalty in which both attitudinal and behavioral components exist. As it can be seen in Figure 2.6, the authors advocate that loyalty is determined by a combination of repeat patronage and relative attitude. The highest form of loyalty is attained when the positive attitude of a customer toward a brand and repeat patronage behavior are high. In contrast, no loyalty exists when the repeat patronage of the
customer is low and the customer does not have much preference or attitude toward a brand over its competitors. Latent loyalty occurs when a customer has a strong preference toward a brand over its competitors, but does not show high repeat patronage due to situational or environmental factor he/she is involved in. For instance, a low-income family might have a strong and positive feeling toward BMW, but cannot purchase one, since their affordable income might not be sufficient for this acquisition. Finally, spurious loyalty exists when a customer exhibits high repeat patronage, but does not have a strong preference toward a brand. This might occur due to two main reasons; there is no alternative or past experience and habit plays a key role in purchase decision [40].
Figure 2.6. Service loyalty classification scheme [40].
2.6. CUSTOMER LOYALTY AND CUSTOMER SATISFACTION
Loyalty should not be confused with customer satisfaction. Although loyalty is built on satisfaction, organizations without loyalty can still have satisfaction. Customer satisfaction is an “opinion measure” about company performance and how customers feel their needs were met in past interactions or by past purchases, whereas customer loyalty is a result measure that includes expectations of future behavior [41].
Even though customer loyalty and customer satisfaction are two distinct concepts, there is a number of researches verifying the strong correlation between them [42,43]. It is claimed that the link between customer loyalty and customer satisfaction is affected by two
critical thresholds. When customer satisfaction reaches a certain point, customer loyalty increases dramatically. Similarly, when customer satisfaction declined to a certain level, loyalty decreased dramatically as well [44]. Furthermore, a research conducted by Xerox illustrate that satisfied customers are more likely to exhibit repurchase behavior. According to a research, 60 to 80 percent of customers who switch to competitors’ brands stated that they were either satisfied or very satisfied with the product or service they left [2]. Therefore, it is claimed that in order to ensure customer retention, customers must be extremely satisfied [45].
However, it is also believed that customer satisfaction is not necessarily a guarantee of loyalty. In fact, customer satisfaction is really no more than the price of entry to a category. For satisfaction to be effective, loyalty must be created among customers. If a business focuses merely on customer satisfaction, it faces the risk of becoming an undifferentiated brand whose customers believe only that it meets the minimum performance criteria for the category. In today’s competitive market, long-term customer retention requires the supplier to go beyond satisfaction. Hence, business owners have to look for ways of establishing ties of loyalty that will defuse the attack of a competitor [46].
All in all, based on the research done by numerous academicians, it can be concluded that even though customer satisfaction does not guarantee repeat purchase, it plays a crucial role in ensuring customer loyalty and retention.
2.7. RISK AVERSION
As an interdisciplinary concept, risk aversion has received considerable attention of researchers from the fields of Marketing, Economics and Finance. It can be asserted that consumers might vary with respect to the amount of risk they are willing to take in a given situation [47]. While risk averse customers prefer low expected utility with known risks, risk lover ones might pursue higher expected utility at the expense of unknown risks.
Due to being threatened by ambiguous novel situations, it is generally more likely for risk averse customers to refrain from trying new products, services and brands. Therefore, risk averse people have a general tendency to stick with the product, service or brand they are already satisfied with [48]. Also, it is asserted that risk averse customers decrease the
risk level by selecting higher-priced brands especially in markets where objective quality and intrinsic product information are less credible [49]. To minimize perceived risk, customers might also seek information from both formal and informal sources and use brand reputation as quality guide [50]. However, information searching might bring some additional costs. Instead of searching for new information and taking risks by trying a new product or service, consumers who have high level of risk aversion might follow a simplifying strategy and stay loyal to a brand [51].
In this research mediating role of risk aversion on the relationship between SMEs’ power procurement satisfaction and SMEs’ loyalty will be tested.
2.8. OVERVIEW OF THE TURKISH POWER SECTOR
2.8.1. Turkish Electricity Market Reform
Due to the increase in energy prices, many countries have started to take measures about cost and efficiency issues in order to ensure supply security. Being influenced by the liberalization and privatization trend, electricity sector has been started to be reconstructed all over the world. The motivation behind the liberalization of electricity sector is enhancing the current weak performance of the industry [52].
An electricity sector reform is generally comprised of privatization, competition and regulation [53]. Main stages of electricity sector reform are summarized in Table 2.2.
Table 2.2 Main steps in electricity reform [54].
Reconstruction Vertical unbundling of power generation,
transmission, distribution and supply Horizontal division of power generation and procurement activities
Competition & Markets Competition in wholesale and retail markets
Regulation Establishment of an independent regulator
Encouraging regulation in power transmission and distribution stages
Ownership Encouragement of the emergence of new
private companies
Privatization of public held companies
In order to switch from the state dominated power market to a competitive one, Turkish authorities have introduced competition gradually in Turkish electricity sector beginning with the enactment of Law No 4628 in 2001 by Energy Market Regulatory Authority (EMRA). The law and the secondary legislation enacted by EMRA, designed in a way that requires the dominance of the private sector in power market except transmission. The ultimate aim of EMRA is to establish a competitive, stable and transparent power market in Turkey. Being in line with this purpose, the share of private sector in Turkish power market has increased steadily thanks to gradual privatization process.
Being in line with its economic developments, driven by industrialization and urbanization electricity demand has been growing tremendously in Turkey over the past decade. Despite economic crisis of 2001 and 2008, electricity consumption has more than tripled in the last twenty years mostly due to the growth in electricity intensive sectors such as automotive, textile, construction, mining and production [55].
Figure 2.7. Turkey gross electricity demand (GWh) (TEIAS).
It is a generally accepted fact that electricity demand growth rate and GDP growth rate are highly correlated. For instance, Ferguson et al. (2000) analyzed the correlations between electricity use and economic development in over 100 countries. They found that for the global economy as a whole, there is a strong correlation between electricity use and wealth creation [56]. It is also verified by the below figure of Turkish gdp growth- electricity demand growth graph between 2000 and 2011.
Figure 2.8. GDP growth-electricity demand growth (TEIAS).
According to TEIAS projections, electricity demand will continue to increase steadily in Turkey. As it can be seen from the figure, electricity demand will reach 398 or 434 billion kWh in 2020 depending on the high or low scenarios.
Figure 2.9. Demand forecast (TEIAS).
According to World Bank, while annual electricity consumption per person is around 2500 kWh in Turkey, it is around 8000 kWh in OECD countries. Therefore, it can be claimed that although electricity consumption has been increasing tremendously, it has not reached a satisfactory level when compared to other developed countries.
Figure 2.10. Annual electricity consumption per person [65].
All in all, it can be argued that Turkish Electricity Market has a great growth potential when considering the economic development of country as well as the relatively lower consumption compared to that of developed nations.
Until recent years, Turkish electricity sector was dominated by a state-owned utility, TEK (Turkish Electricity Institution). It was unbundled in 1994 into TEAŞ (Turkish Electricity Generation and Transmission Company) and TEDAŞ (Turkish Electricity Distribution Company). While TEAŞ was responsible for the operation of all state-owned plants as well as transmission, imports and export activities of electricity, TEDAŞ was responsible for distributing electricity nationwide. In order to create a liberal and competitive market mechanism, EMRA (Turkish Energy Market Regulatory Authority) was established and EPK (Turkish Electricity Market Law) was put into practice in 2001. After the enactment of EPK, TEAŞ was further split into EÜAŞ, TETAŞ and TEİAŞ. EÜAŞ is a state owned company which is responsible for generating electricity in compliance with the energy and economic policies of the state and in accordance with the principles of efficiency and profitability. The main responsibilities of TETAŞ is carrying out sale and purchase agreements within the scope of its contracts, engaging organized wholesale markets for sale and purchase agreements and conducting bilateral agreements. Finally, TEİAŞ is responsible
for the operation of the electrical transmission system, day ahead market and balancing power market.
Figure 2.11. Turkish electricity market reform milestones [57].
EPK has enabled private sector investors to participate market operations such as electricity generation, distribution and wholesale/retail under the condition that they acquire the required licence. The ultimate purpose is to form a market mechanism in which market participants can make reciprocal agreements and customers can choose their own suppliers. Being in line with electricity market liberalization goal, a new concept known as ‘‘eligible customer’’ arouse in 2001. According to regulatory board’s decision, any customer who has a minimum electricity consumption of 9 GWs/year could be labeled as an eligible customer. An eligible customer could choose his/her own electricity supplier. After this initial movement, eligible customer limit has been decreased year by year. Finally, in 2015 eligible customer limit wasdecleared as 4.000 kWh/year.
Table 2.3. Annual eligible customer limit [12].
Eligible Customer Limit
2004 7,8 GWh 2006 6 GWh 2007 3 GWh 2008 1,2 GWh 2009 0,48 GWh 2010 0,1 GWh 2011 0,03 GWh 2012 25.000 kWh 2013 5.000 kWh 2014 4.500 kWh 2015 4.000 kWh
As it can be seen from the above figure, EMRA has been gradually reducing the eligibility threshold to allow that more privately produced power can be sold in the free market. The most recent reduction was made at the beginning of 2015. According to new law, customers more than 4.000 kWh annual consumption are allowed to have direct access to wholesale market and procure their electricity via bilateral contracts with their suppliers under free market condition.
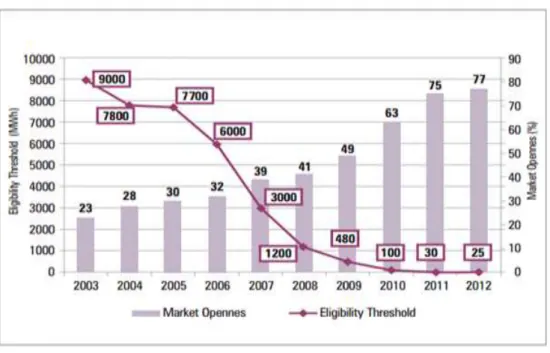
Being in line with this gradual decline period, share of customers free to choose their suppliers has been increasing as well. As it can be seen from Figure 2.12 market openness rate has increased from 23% to 77% between 2003 and 2012. In fact, according to Electricity Market and the Security of Supply Strategy Paper the ultimate aim is reaching 100% market openness by making all customers eligible. Hence more and more companies have started to make investment to give a particular kind of electricity service.
Figure 2.12. Eligibility threshold-market openness (%) (TEIAS).
As of 2014, there were 458 licensed private electricity generation companies, 21 licensed electricity distribution companies, and 172 licensed electricity wholesale companies in Turkey.
It can be claimed that as an industry becomes more liberal, competition among firms has become more severe. As competition becomes more severe, more companies try to do their best to give a better service so that they can differentiate themselves among others. The same situation is valid for companies operating in Turkish electricity business. With the existence of abundant of private electricity suppliers, eligible customers have become to set different criteria and make deep evaluations before choosing their electricity provider. Due to the fact that quality or function of electricity offered do not change from one supplier to another, suppliers operating in Turkish electricity business have become to focus on a number of factors. It can be asserted that with the help of building a trust mechanism, offering a better price, billing and payment conditions, excelling on customer service etc. one can differentiate itself from others. In order to figure out how one can differentiate itself from others, power suppliers should pay careful attention to the concepts of service quality, customer satisfaction and customer loyalty.
2.8.2. Market Structure
Market operations determined by EPK include generation, transmission, transportation, wholesale, retail sale, trade, import and export activities.
Figure 2.13. Market structure.
EÜAŞ as a state owned company, operates the generating facilities which have not been transferred to private sector.
Conducting transmission activities as a state monopoly, operating power balancing market and day ahead market are the fundamental responsibilities of TEİAŞ.
TETAŞ is responsible for carrying out sale and purchase agreements within the scope of its contracts, engaging organized wholesale markets for sale and purchase agreements and conducting bilateral agreements.
TEDAŞ had full control over distribution regions until recent years. In 2005, 20 out of 21 distribution companies were established as a subsidiary of TEDAŞ. Each distribution company has the right to operate the distribution system that is actually owned by TEDAŞ for 30 years. Each distribution company holds a monopoly in its region and also holds a retail sales license. Currently, privatizations of all distribution companies have been finalized.