JHEP05(2014)068
Published for SISSA by SpringerReceived: February 26, 2014 Revised: April 1, 2014 Accepted: April 15, 2014 Published: May 16, 2014
Measurement of the production of a W boson in
association with a charm quark in pp collisions at
√
s = 7 TeV with the ATLAS detector
The ATLAS collaboration
E-mail: [email protected]Abstract: The production of a W boson in association with a single charm quark is stud-ied using 4.6 fb−1 of pp collision data at√s = 7 TeV collected with the ATLAS detector at the Large Hadron Collider. In events in which a W boson decays to an electron or muon, the charm quark is tagged either by its semileptonic decay to a muon or by the presence of a charmed meson. The integrated and differential cross sections as a function of the pseudorapidity of the lepton from the W -boson decay are measured. Results are compared to the predictions of next-to-leading-order QCD calculations obtained from various parton distribution function parameterisations. The ratio of the strange-to-down sea-quark distri-butions is determined to be 0.96+0.26−0.30 at Q2 = 1.9 GeV2, which supports the hypothesis of an SU(3)-symmetric composition of the light-quark sea. Additionally, the cross-section ra-tio σ(W++c)/σ(W−+c) is compared to the predictions obtained using parton distribution function parameterisations with different assumptions about the s–s quark asymmetry.
Keywords: Electroweak interaction, Hadron-Hadron Scattering, Charm physics ArXiv ePrint: 1402.6263
JHEP05(2014)068
Contents
1 Introduction 1
2 The ATLAS detector 3
3 Data and Monte Carlo samples 4
4 Object reconstruction and W -boson selection 5
4.1 W → eν 6
4.2 W → µν 6
5 Event yields for W D(∗) final states 7
5.1 Determination of inclusive W yields 7
5.2 D-meson selection 8
5.3 Determination of OS − SS yields 10
5.3.1 Fits to ∆m and m(D) distributions 11
5.3.2 Removal of heavy-flavour backgrounds 13
5.4 Resulting OS-SS yields 15
6 Event yields for W c-jet final states 15
6.1 Charm-jet selection 16
6.2 Determination of OS-SS yields 16
6.2.1 Backgrounds and yield in the electron channel 17
6.2.2 Backgrounds and yield in the muon channel 19
7 Cross-section determination 22
7.1 Definition of the fiducial phase space 22
7.2 Cross-section determination 23
7.3 Determination of the W D(∗) cross sections 24
7.4 Determination of the W c-jet cross sections 25
8 Systematic uncertainties 25
8.1 Common systematic uncertainties 25
8.2 Systematic uncertainties on W D(∗) 27
8.2.1 Tracking efficiency 27
8.2.2 Secondary-vertex reconstruction efficiency 28
8.2.3 D∗ isolation efficiency 28
8.2.4 Fitting procedure 28
8.2.5 Signal modelling 29
8.2.6 Branching ratio 29
8.2.7 Extrapolation to fiducial region 29
JHEP05(2014)068
8.3.1 Soft-muon tagging 29
8.3.2 c-quark fragmentation 30
8.3.3 c-hadron decays 30
8.3.4 Signal modelling 30
9 Results and comparison to theoretical predictions 31
9.1 Data combination 31
9.2 Theoretical predictions 32
9.3 Discussion 34
10 Additional results 40
10.1 Cross-section ratio σfidOS−SS(W D(∗))/σfid(W ) differential in pD
(∗)
T 40
10.2 Cross sections σfidOS−SS(W c-jet) and σOS–SS
fid (W c-jet(c → µ)) as a function of
the jet multiplicity 41
11 Conclusion 43
The ATLAS collaboration 50
1 Introduction
The production of a W boson in association with a single charm quark in proton-proton col-lisions is described at leading order (LO) in perturbative quantum chromodynamics (QCD) by the scattering of a gluon and a down-type quark (d, s, b). The relative contribution from each of the three families in the initial state is determined by the parton distribution functions (PDF) of the proton and by the quark-mixing matrix elements Vcd, Vcs and Vcb.
In proton-proton collisions at a centre-of-mass energy of √s = 7 TeV, gs → W−c and g¯s → W+c production channels are dominant, while the reaction initiated by a d-quark¯ contributes about 10% [1], being suppressed by the quark-mixing matrix element Vcd. The
contribution of processes that include b-quarks is negligible. The next-to-leading-order (NLO) QCD terms [2] are dominated by one-loop corrections to the subprocess gs → W c and the tree-level 2 → 3 processes gg → sW c and qs → qW c. Processes with charm quarks in the initial state are not considered for this analysis as explained in section9.2. Since the gs → W c process and its higher-order corrections are dominant, the pp → W cX production is directly sensitive to the s-quark distribution function in the proton at momentum-transfer values on the order of the W -boson mass (mW).
The s-quark PDF has been determined by neutrino-nucleon deep inelastic scattering (DIS) experiments [3, 4] at momentum transfer squared Q2 ∼ 10 GeV2 and momentum
fraction x ∼ 0.1. However, the interpretation of these data is sensitive to the modelling of c-quark fragmentation and nuclear corrections; some analyses [5–7] indicate that the s-quark sea is suppressed relative to the d-s-quark sea at all values of x while others [8] suggest that SU(3) symmetry is restored as x decreases. A recent joint analysis of inclusive W and
JHEP05(2014)068
Z production data from ATLAS at Q2 ∼ m2
W and DIS data from HERA has bolstered
the case for an SU(3)-symmetric sea at x ∼ 0.01 [9]. The main result of that analysis was obtained under the assumption that the s- and s-quark distributions are equal. However, fits to the neutrino DIS data from NuTeV [4,5,10] prefer a small asymmetry between the s and s sea.
The possibility of using W + c events as probes of the strange-quark distribution func-tion has been discussed for some time [11,12]. While the cross section for this process was measured with a precision of 20–30% at the Tevatron [13–15], the large production rates available at the Large Hadron Collider (LHC) provide the first opportunity for a measure-ment with sufficient precision to constrain the s-quark PDF at x ∼ 0.01. A measuremeasure-ment of the W + c production cross-section at the LHC was performed recently by CMS [16] and exploited to constrain the s-quark PDF in ref. [17].
This paper presents a measurement of the production of a W boson in association with a single charm quark using 4.6 fb−1 of pp collision data at √s = 7 TeV collected with the ATLAS detector at the LHC in 2011. In events where a W boson decays to an electron or muon, the charm quark is tagged either by the presence of a jet of particles containing its semileptonic decay to a muon (hereafter referred to as a soft muon) or by the presence of a charmed hadron reconstructed in the decay modes D+ → K−π+π+ and D∗+ → D0π+
with D0 → K−π+, D0 → K−π+π0 or D0 → K−π+π−π+, and their charge conjugates. The relative sign of the charges of the W boson and the soft muon, or the D(∗)meson,1 is exploited to reduce the backgrounds substantially. In W + c production, the final-state W boson is always accompanied by a charm quark with charge of opposite sign, that is W++ c or W− + c. The soft muon and the D(∗)meson have the same-sign charge as the charm quark and thus a charge opposite to the W boson and its corresponding decay lepton. Requiring the W boson and the soft muon or D(∗)meson to be of opposite charge therefore selects the W + c signal with very high purity. Most backgrounds are evenly distributed between events with opposite-sign (OS) and same-sign (SS) charge. Therefore, an important strategy used in this analysis is to determine the W + c yields by measuring the difference between the number of opposite-sign and same-sign charge events (OS–SS). Since the kinematics of pair-produced charm and anti-charm quarks are the same, the pair-produced quarks do not contribute to distributions formed from OS–SS events.
The integrated and differential cross sections as a function of the pseudorapidity of the lepton from the W -boson decay are measured for the fiducial region defined by lepton transverse momentum p`T > 20 GeV and pseudorapidity |η`| < 2.5,2 neutrino transverse
momentum pνT > 25 GeV and W -boson transverse mass mWT > 40 GeV.3
1
Throughout this paper, D(∗)refers to D∗±and D±.
2
ATLAS uses a right-handed coordinate system with its origin at the nominal interaction point (IP) in the centre of the detector and the z-axis coinciding with the axis of the beam pipe. The x-axis points from the IP to the centre of the LHC ring, and the y-axis points upward. Cylindrical coordinates (r,φ) are used in the transverse plane, φ being the azimuthal angle around the beam pipe. The pseudorapidity is defined in terms of the polar angle θ as η = − ln tan(θ/2).
3mW
T is defined as mWT =p2p`TETmiss(1 − cos∆φ) where ∆φ is the azimuthal separation between the
JHEP05(2014)068
The two tagging methods are sensitive to different charm-quark kinematic regions and have different dominant systematic uncertainties. In the analysis referred to as the W c-jet analysis, the selection requires that a soft muon is associated with a jet reconstructed in the calorimeter with a minimum transverse momentum pT > 25 GeV and pseudorapidity
|η| < 2.5. The cross section is evaluated for the production of a W boson in association with a particle-level jet containing a weakly decaying charmed hadron with pT> 5 GeV and
within a cone of ∆R =p(∆φ)2+ (∆η)2= 0.3 from the jet axis as described in section7.1.
In addition, the cross section is reported in a fiducial region where the above mentioned charmed hadron is required to decay semileptonically to a muon with pµT > 4 GeV and pseudorapidity |ηµ| < 2.5 with ∆R < 0.5 from the jet axis.
The analysis referred to as the W D(∗) analysis does not require a reconstructed calorimeter jet and is thus sensitive to charmed hadrons from c-quarks at lower trans-verse momenta. Differential cross sections are measured separately as a function of the D(∗)-meson transverse momentum pDT(∗) and of the pseudorapidity of the lepton from the W -boson decay |η`|. The data are then integrated and the fiducial cross section is measured for D(∗)mesons with pDT(∗) > 8 GeV and |ηD(∗)| < 2.2.
The measurements are performed separately for events with a positively and a nega-tively charged W boson, and the ratio
R±c ≡ σ(W++ c)/σ(W−+ c)
is also measured. All measurements are compared to predictions of NLO QCD calculations obtained with various PDF sets and the sensitivity to the choice of PDFs is presented.
2 The ATLAS detector
The ATLAS detector is described in detail in ref. [18]. The inner detector (ID) is used to measure the momenta and trajectories of charged particles. The ID has full coverage in the azimuthal angle φ and over the pseudorapidity range |η| < 2.5. It consists of three subsystems: a silicon-pixel detector, a silicon-strip tracker (SCT) and a transition-radiation straw-tube tracker (TRT). These detectors are located inside a solenoid that provides a 2 T axial field. The ID barrel (end-caps) consists of three (2 × 3) pixel layers, four (2 × 9) double-layers of single-sided silicon strips with a 40 mrad stereo angle, and 73 (2 × 160) layers of TRT straws. These detectors have position resolutions of typically 10, 17 and 130 µm in the azimuthal (rφ) coordinate and, in the case of the pixel and SCT, 115 and 580 µm, respectively, for the second measured coordinate (z). A track from a particle traversing the barrel detector has typically 11 silicon hits (3 pixel clusters and 8 strip clusters), and more than 30 straw hits.
The electromagnetic calorimeters use liquid argon as the active detector medium. They consist of accordion-shaped electrodes and lead absorbers, and are divided into one barrel (|η| < 1.475) and two end-cap components (1.375 < |η| < 3.2). The technology used for the hadronic calorimeters varies with η. In the barrel region (|η| < 1.7), the detector is made of scintillator tiles with steel absorbers. In the end-cap region (1.5 < |η| < 3.2), the detector uses liquid argon and copper. A forward calorimeter consisting of liquid argon and
JHEP05(2014)068
tungsten/copper absorbers has both electromagnetic and hadronic sections, and extends the coverage to |η| < 4.9.
The muon spectrometer (MS) contains one barrel and two end-cap air-core toroid magnets, each consisting of eight superconducting coils arranged symmetrically in azimuth, and surrounding the calorimeter. Three layers of precision tracking stations, consisting of drift tubes and cathode strip chambers, provide precise muon momentum measurements over the range |η| < 2.7. Resistive plate and thin-gap chambers provide muon triggering capability over the range |η| < 2.4.
The ATLAS trigger consists of three levels of event selection: a first level implemented using custom-made electronics, which selects events at a design rate of at most 75 kHz, and two successive software-based higher levels using fast online algorithms for the second level and reconstruction software which is close to the offline algorithms for the third level.
3 Data and Monte Carlo samples
This analysis is based on data collected with the ATLAS detector in the year 2011 during periods with stable pp collisions at√s = 7 TeV in which all relevant detector components are fully operational. The resulting data sample corresponds to an integrated luminosity of 4.6 fb−1 with an uncertainty of 1.8% [19].
MC samples are used to compute efficiencies, to model kinematic distributions of signal and background processes and to interpret the results. The signal is defined to be the production of a W boson in association with a single charm quark. Background processes include the production of W +light jets (i.e. light-quark and gluon jets, hereafter referred to as W +light), W + cc and W + bb, while the contribution from W + b production is negligible. Z+jets (including γ∗+jets), top-quark pairs, single top quarks, dibosons and multijet events also contribute to the background.
The W D(∗) signal events are generated with Pythia 6.423 [20] where the EvtGen [21] program is used to model the charm decays. The CTEQ6L1 PDF [22] is used for all LO MC generators.
W bosons produced in association with c-jets, b-jets and light jets are generated sep-arately using Alpgen 2.13 [23] interfaced to Herwig 6.520 [24] for the parton shower and hadronisation, as well as Jimmy 4.31 [25] for the underlying event. Exclusive samples with zero to four additional partons and an inclusive sample with five or more additional partons are used. Overlaps between different Alpgen samples with heavy-flavour quarks originating from the matrix element and from the parton shower are removed. In addition, the MLM [26] matching scheme is applied to remove overlaps between events with the same parton multiplicity generated by the matrix element or the parton shower.
A dedicated sample generated with Alpgen and Pythia for the parton shower and hadronisation is used for the W boson plus c-jet signal process. In this sample, the frag-mentation fractions are reweighted to those derived from the combination of measurements in e+e− and ep collisions [27], the momentum fraction of c-hadrons is reweighted to that given by Herwig++ 2.6.3 [28], the semileptonic branching ratios of c-hadrons are rescaled
JHEP05(2014)068
to the world average values [29] and the distribution of the momentum of outgoing muons in the c-hadron rest frame is reweighted to that provided by EvtGen.
Inclusive W production is generated using the Powheg r1556 [30–33] generator in-terfaced to Pythia for parton shower, hadronisation and underlying-event modelling. For systematic studies, samples generated using Powheg or MC@NLO 4.01 [34], where the parton shower and hadronisation are modelled by Herwig and the underlying event by Jimmy, are used. The CT10 [8] PDF is used for the NLO matrix-element calculations, while showering is performed with the CTEQ6L1 PDF.
Background from Z+jets events is generated with Alpgen interfaced to Herwig and Jimmy using the same configuration as for W +jets events. For the diboson backgrounds (W W , W Z and ZZ), MC samples generated with Herwig are used. The tt background is obtained from the MC@NLO generator with Herwig used for the parton shower and hadronisation, while single-top production is based on the Acer 3.7 [35] MC generator (interfaced to Pythia) in the t-channel, and MC@NLO in the s-channel and for associ-ated production with a W boson. When Pythia or Herwig is used, Tauola [36] and Photos [37] are employed to model the decay of τ -leptons and the radiation of photons, respectively.
The background processes are normalised to NNLO predictions for inclusive W , Z and tt production [38, 39] and to NLO predictions for the other processes [40, 41]. The properties of the multijet background events are determined using data-driven techniques. Multiple pp collisions per bunch crossing (pileup) are modelled by overlaying minimum-bias events generated using Pythia with the hard process.
The MC events are passed through a detailed simulation of the ATLAS detector re-sponse [42] based on GEANT4 [43].
4 Object reconstruction and W -boson selection
W bosons are reconstructed in their leptonic decay channels, W → eν and W → µν. While the W D(∗) and W c-jet analyses share a common selection strategy for the W bosons, the selection requirements are optimised separately for the two analyses to better suppress the respective backgrounds. The measured cross sections for the two analyses are extrapolated to a common fiducial region of W -boson kinematics (see section7).
Data used for this analysis are triggered either by a single-muon trigger with a require-ment on the pseudorapidity of |ηµ| < 2.4 and on the transverse momentum of pµT > 18 GeV, or by a single-electron trigger with pseudorapidity coverage of |ηe| < 2.47 and a threshold for the transverse momentum peTof 20 GeV or 22 GeV, depending on the data-taking period. Events are required to have at least one vertex. The vertex with the highest sum of the squared transverse momenta of the associated tracks is selected as the primary vertex. Jets are reconstructed with the FastJet package [44] which uses the infrared- and collinear-safe anti-kt algorithm [45] with radius parameter R = 0.4. The input from the calorimeter is
based on three-dimensional topological clusters [46] and jet energies are calibrated using the EM+JES scheme [47]. The presence of neutrinos is inferred from the missing transverse momentum. The magnitude (ETmiss) and azimuthal direction are measured from the vector
JHEP05(2014)068
sum of the transverse momenta of calibrated physics objects [48]. Low-pT tracks are used
to recover soft particles which are not measured in the calorimeters [49].
Exactly one lepton fulfilling the isolation requirements discussed below is allowed in each event. Events with additional isolated electrons or muons are vetoed to suppress back-ground from Z and t¯t events. The selection applied to veto leptons is looser than the one used for signal leptons to ensure higher background rejection. Trigger and reconstruction scale factors are applied to the MC simulation so that the simulation efficiencies match those measured in data.
4.1 W → eν
Electrons with transverse momentum peT > 25 GeV and in the pseudorapidity range |ηe| < 2.47, excluding the calorimeter transition region 1.37 < |η| < 1.52, are selected. Electrons are required to satisfy the “tight” identification criteria described in ref. [50].
In the W D(∗) analysis, stringent requirements on the electron isolation and track im-pact parameter are applied in order to reject electrons from multijet background events. The W D(∗) analysis uses and calorimeter-based isolation requirements: the track-based isolation criterion requires the sum of transverse momenta, Σ∆R<0.4ptrackT , of tracks
with ptrackT > 1 GeV within a cone of radius ∆R = 0.4 around the electron’s direction to be less than 10% of the electron’s transverse momentum. The track associated with the electron is excluded from the calculation of the isolation requirement. The calorimeter-based isolation requirement is analogously defined as the sum of transverse energies in the calorimeter cells (including electromagnetic and hadronic sections, and excluding contri-butions from the electron itself), Σ∆R<0.4ETcells, and is required to be less than 40% of peT.
To improve the measurement of the electron track parameters, tracks associated with the electron are refitted by the Gaussian Sum Filter described in ref. [51] which takes into ac-count bremsstrahlung effects. The transverse impact parameter significance is required to be |d0|/σ(d0) < 3, where σ(d0) is the uncertainty on the measured d0, and the longitudinal
impact parameter is required to be |z0| < 1 mm.
The W c-jet analysis uses only a calorimeter-based isolation requirement,
Σ∆R<0.3ETcells < 3 GeV. The electron must be separated by ∆R > 0.5 from any jet. In
both analyses, a minimum ETmiss of 25 GeV and a minimum mWT of 40 GeV are required.
4.2 W → µν
Muon candidates are formed from associated tracks in the ID and the MS that are combined using a χ2-matching procedure [52, 53]. Muons are required to have pµT > 20 GeV and a pseudorapidity range |ηµ| < 2.4. The set of ID hit requirements described in [54] together with an additional condition of at least one hit in the first pixel layer is applied to select high-quality tracks.
The W D(∗) analysis uses a selection on the longitudinal impact parameter |z0| <
1 mm to remove muons from cosmic-ray background. In order to suppress background from heavy-flavour decays, the muon is required to have a transverse impact parameter satisfying |d0|/σ(d0) < 2.5 and track- and calorimeter-based isolation requirements are
JHEP05(2014)068
applied: Σ∆R<0.4ptrackT < 0.1 · p µ T and Σ∆R<0.4E cells T < 0.2 · p µT , where the contribution
from the muon itself is excluded.
The W c-jet analysis also uses a combination of track- and calorimeter-based isolation: Σ∆R<0.3ptrackT is required to be less than 2.5 GeV and Σ∆R<0.2ETcells to be less than 4 GeV.
Additionally, muons must be separated by ∆R > 0.4 from any jet with pT > 25 GeV.
The W D(∗) analysis requires a minimum ETmiss of 25 GeV and mWT is required to be greater than 40 GeV. A lower ETmiss threshold of 20 GeV is applied in the W c-jet anal-ysis. However, a more stringent mWT requirement of 60 GeV is imposed to improve the suppression of the multijet background.
5 Event yields for W D(∗) final states
The measurement of the cross section for the production of a single charmed meson in association with a W boson proceeds as follows. First, leptonic W -boson decays are se-lected as described in section 4. The inclusive W yield is then determined for each lepton species and each charge separately. Second, in events satisfying the W selection criteria, D(∗)mesons are reconstructed for the decay modes D+→ K−π+π+and D∗+ → D0π+with
D0 → K−π+, D0 → K−π+π0, and D0 → K−π+π−π+. Third, distributions of the mass (for the D) or the mass difference ∆m = m(D∗) − m(D0) (for the D∗) are formed in the OS and SS samples. Fourth, the charge correlation between the lepton and the D(∗)meson
is exploited to extract the single-charm component by forming the OS–SS mass or mass difference distributions. Fifth, the W D(∗) yield is extracted for each decay mode in bins of pDT(∗) or |η`| by fitting the mass or mass difference distribution in OS–SS events after combining the electron and muon channels. The raw yields are then corrected for detector acceptance, reconstruction efficiency and migration due to finite pDT(∗) resolution as dis-cussed in section7. The corrected results are presented as ratios of the W D(∗) production cross section to the inclusive W production cross section, that is σOS−SSfid (W D(∗))/σfid(W ).
In addition, the cross-section ratio R±c is calculated.
Finally, the inclusive W → eν and W → µν cross sections, which are measured with different fiducial requirements, are corrected to a common kinematic region and com-bined. The inclusive W cross section is used to obtain fully corrected measurements of σfidOS−SS(W D(∗)).
5.1 Determination of inclusive W yields
The inclusive W → µν and W → eν yields are determined from the number of data events passing the event selection after subtracting the expected background contributions. The backgrounds from real leptons are estimated from simulation. Among these sources of backgrounds, the contributions from the W → τ ν and Z → `` channels are dominant and amount to 1.8(2.8)% and 1.2(3.6)% of the total yield in the electron(muon) channel, respectively. Contributions from tt, single-top and diboson channels are small, at the level of 0.4%.
The background from multijet events is important due to the large production cross section. In the electron channel, multijet events pass the electron selection due to
misiden-JHEP05(2014)068
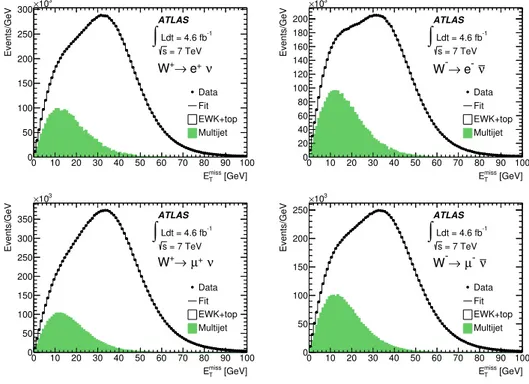
tified hadrons, converted photons and semileptonic heavy-flavour decays. In the muon channel, muons from heavy-flavour decays as well as decays in flight of pions and kaons are the dominant sources. Since predictions for the normalisation and the composition of these backgrounds suffer from large uncertainties, data-driven techniques are applied. To minimize systematic uncertainties arising from correlations between ETmiss and mWT in the multijet background, the signal yields are derived from binned maximum-likelihood fits [55] of templates to the ETmissdistributions in a expanded sample obtained by removing the requirements on ETmissand mWT. These fits discriminate the electroweak and top-quark processes from the multijet background. W yields in the signal region are determined from the fitted yield at ETmiss > 25 GeV after removing electroweak and top-quark background events and applying a small correction for the efficiency of the mWT requirement.4
The templates for electroweak and top-quark events are taken from simulation and the relative normalisations of the individual processes are fixed according to the corresponding cross sections. The multijet templates are derived from data in a control region defined like the signal region except that the lepton transverse impact parameter requirement is reversed, the lepton transverse momentum requirement is lowered, and no requirement is imposed on ETmissor mWT. This selection defines a region orthogonal to the signal region and enriches the heavy-flavour content in the sample. The contamination from electroweak and top-quark events in the control region is estimated from MC simulation and subtracted. The resulting fits, presented in figure1, show that the template predictions provide a good description of the data. The stability of the fit result is verified by repeating the fits with varied bin width and fit ranges.
The size of the multijet background in the signal region is 3.1(4.2)% for W+(W−) in the electron channel and 2.0(3.0)% for W+(W−) in the muon channel. The reconstructed inclusive W yields after background subtraction are 6.9 · 106 for W+ → e+ν, 4.7 · 106 for
W−→ e−ν, 9.3 · 106 for W+→ µ+ν and 6.0 · 106 for W−→ µ−ν. The maximum-likelihood
fits are also performed in four bins of |η`|.
Systematic effects arising from the modelling of the electroweak and top-quark event template shapes are investigated by studying the dependence of the fit result on the choice of generator and PDF set. The uncertainty in the multijet template shapes is determined using alternative control region definitions in data and in simulation. Systematic uncer-tainties on the extrapolation to the signal region are assessed by comparing the efficiencies of the mWT requirement produced by different generators and different hadronisation and underlying event models. The systematic uncertainty due to the MC-based subtraction of the electroweak and top-quark backgrounds is taken into account by propagating the corresponding cross-section uncertainties. These studies result in a relative systematic un-certainty with respect to the number of W candidates of 2.6(0.8)% for the electron(muon) channel and 1.3% for the combined measurement.
5.2 D-meson selection
Charmed hadrons from events passing the W selection are reconstructed in the decay modes D+ → K−π+π+ and D∗+ → D0π+ with D0 → K−π+, D0 → K−π+π0 or D0 →
4
The efficiency of the mWT > 40 GeV requirement in signal events is determined from simulation and
JHEP05(2014)068
[GeV] miss T E 0 10 20 30 40 50 60 70 80 90 100 Events/GeV 0 50 100 150 200 250 300×103 Data Fit EWK+top Multijet ATLAS -1 Ldt = 4.6 fb∫
s = 7 TeV ν + e → + W [GeV] miss T E 0 10 20 30 40 50 60 70 80 90 100 Events/GeV 0 20 40 60 80 100 120 140 160 180 200 3 10 × Data Fit EWK+top Multijet ATLAS -1 Ldt = 4.6 fb∫
s = 7 TeV ν e → -W [GeV] miss T E 0 10 20 30 40 50 60 70 80 90 100 Events/GeV 0 50 100 150 200 250 300 350 3 10 × Data Fit EWK+top Multijet ATLAS -1 Ldt = 4.6 fb∫
s = 7 TeV ν + µ → + W [GeV] miss T E 0 10 20 30 40 50 60 70 80 90 100 Events/GeV 0 50 100 150 200 250 3 10 × Data Fit EWK+top Multijet ATLAS -1 Ldt = 4.6 fb∫
s = 7 TeV ν -µ → -WFigure 1. Result of the binned maximum-likelihood fit to the Emiss
T distribution for W+→ e+ν (top
left), W−→ e−ν (top right), W+ → µ+ν (bottom left) and W− → µ−ν (bottom right). The data
are shown by filled markers and the fit result by the solid line. The multijet template, normalised according to the fit result, is shown by the filled histogram. The shape of the distribution for the electroweak and top-quark processes is obtained from simulation. Electroweak processes include W , Z and diboson processes.
K−π+π−π+ and their charge conjugates. The selection is optimised to maximise the signal-to-background ratio using simulated events. D(∗)candidates are reconstructed from good-quality tracks within |η| < 2.5. Each track is required to have at least six hits in the SCT and to have a hit in the innermost layer of the pixel detector unless it passes through a region where no hit is expected. Only tracks with no more than one missing pixel or SCT hit are used. A requirement of |z0| sin θ < 15 mm is applied to suppress background
from pileup events. No requirement on the track impact parameter in the transverse plane is applied to avoid any bias in the selection of tracks coming from a displaced D-meson decay vertex.
The D0(D+) candidates are reconstructed from tracks with p
T> 500 (800) MeV. The
track associated with the lepton from the decay of the W boson is excluded. Sets of tracks with the appropriate charge combination in a cone of ∆R = 0.6 are fit to a common vertex hypothesis in three dimensions. All possible pion or kaon mass assignments are considered for the tracks. The vertex fit is required to have χ2 < 5. Vertex candidates are retained if their distance to the primary vertex in the transverse plane, Lxy, is greater than 0 (1) mm
for D0 (D+) candidates. The transverse impact parameter of the candidate’s flight path with respect to the primary vertex is required to fulfil the requirement |d0| < 1 mm. A
JHEP05(2014)068
this channel, the impact parameter distribution is distorted due to the π0 meson, which is not reconstructed. Combinatorial background in the D+ reconstruction is reduced by requiring cos θ∗(K) > −0.8 where θ∗(K) is the angle between the kaon in the Kππ rest frame and the Kππ line of flight in the laboratory frame. D+ candidates with m(Kππ) −
m(Kπ) < 180 MeV are rejected5 to suppress background from D∗ decays. Background from Ds+ → φπ+ → (K+K−)π+ is significantly reduced by removing any D+ candidate
containing a pair of oppositely charged particles with an invariant mass within 8 MeV of the nominal φ mass [29] when the kaon mass hypothesis is assumed for both tracks.
For the D∗ channel, suitable ranges are selected in the m(D0) invariant mass spectrum: m(Kπ(ππ)) is required to be within 40 MeV of the nominal D0 mass [29] for the D0 → K−π+(π−π+) channels, while the D0→ K−π+π0 decay is reconstructed from the satellite
peak [56] at 1.5 GeV< m(Kπ) < 1.7 GeV. An additional track (π+slow) with pT> 400 MeV,
|d0| < 1 mm and charge opposite to the kaon is used to form D∗+ → D0π+ candidates. In
order to reduce combinatorial background, an isolation requirement of pT(D0)/ΣpT > 0.5 is
imposed where the sum runs over all tracks with pT > 500 MeV in a cone of radius ∆R = 0.4
around the D0 candidate. Duplicate removal is performed in the D0 → K−π+π−π+
channel: if two or more D∗ candidates share the same πslow+ track as well as two tracks from the decay of the associated D0, only the candidate with the mass closest to the nominal D0 mass is retained. Finally, kinematic requirements of pDT(∗) > 8 GeV and |ηD(∗)| < 2.2 are applied.
If several D(∗)candidates are found in an event, all of them are used for the inclusive cross-section measurement. They enter the OS or SS samples, depending on the charge of the charmed meson and of the W -boson candidate. The fraction of events with multiple candidates is about 10% for D+→ K−π+π+, D0 → K−π+and D0 → K−π+π0and about
30% for D0→ K−π+π−π+.
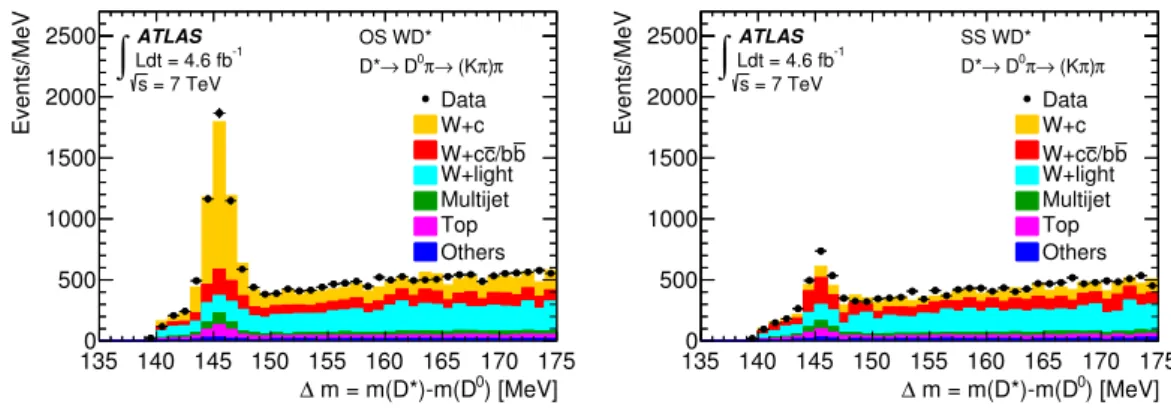
For illustration, the ∆m distribution for D∗+ → D0π+→ (K−π+)π+ events is shown
in figure2 for OS and SS events passing the W D(∗) selection in data and is compared to simulation. The simulation provides a good description of the data. The difference in nor-malisation is less than the uncertainty on the nornor-malisations of the simulated backgrounds. The dominant background is from W +light events. All other background sources are small and further reduced after the OS–SS subtraction.
5.3 Determination of OS − SS yields
In order to suppress background contributions, the charge correlation of the W D(∗) signal process is exploited by measuring the number of OS–SS events (NOS–SS). The remaining
background after the OS–SS subtraction is predominantly W +light events in which the OS/SS asymmetry is due to the correlation of the charge of the W boson and the associated quark, and to the charge conservation among the fragmentation products of the quark. A smaller contribution is from top-quark events and semileptonic decays in cc/bb events with a D meson from the charm hadronisation. The fraction of W D(∗) events with W → τ ν
5Here the mass difference is calculated for both pion candidates and the D+ candidate is rejected if
JHEP05(2014)068
) [MeV] 0 m = m(D*)-m(D ∆ 135 140 145 150 155 160 165 170 175 Events/MeV 0 500 1000 1500 2000 2500 Data W+c b /b c W+c W+light Multijet Top Others ATLAS -1 Ldt = 4.6 fb∫
s = 7 TeV OS WD* π ) π (K → π 0 D → D* ) [MeV] 0 m = m(D*)-m(D ∆ 135 140 145 150 155 160 165 170 175 Events/MeV 0 500 1000 1500 2000 2500 Data W+c b /b c W+c W+light Multijet Top Others ATLAS -1 Ldt = 4.6 fb∫
s = 7 TeV SS WD* π ) π (K → π 0 D → D*Figure 2. Reconstructed ∆m = m(D∗) − m(D0) distributions in OS (left) and SS (right) events
passing the selection for D∗± → D0π±→ (K∓π±)π±. The data distributions are shown by the filled
markers. The coloured stacked histograms represent the predictions for the signal and background processes. The predictions are obtained from simulation, except for the multijet background, which is estimated from the data control region with semileptonic b-quark decays. The difference in normalisation between data and predictions is consistent with the uncertainty on the background normalisations.
is determined from simulation to be 2.5% and is subtracted from the number of signal events. All other backgrounds are negligible after the OS–SS subtraction. The W D(∗) yields in OS–SS events are obtained from fits to the mass (for the D meson) or ∆m (for the D∗ meson) distributions. In the fit, template histograms from a data control region are used to model the signal shape and functional forms are used for the combinatorial background. The data control regions and the fitting methodology are discussed in the following sections.
In contrast to the combinatorial background, top-quark and heavy-flavour production include real D mesons that produce a peak in the signal region of the mass distribution and requires special treatment. The background from top-quark events is estimated from MC simulation. The background from heavy-flavour production in OS–SS events depends on the relative contributions from cc and bb events and is estimated using a data-driven technique. The peaking backgrounds are subtracted from the fitted W D(∗) yields as out-lined below.
5.3.1 Fits to ∆m and m(D) distributions
Signal templates. The signal templates for the m(D) and ∆m distributions are ob-tained from a data control region dominated by events with semileptonic b-quark decays. Due to the abundant production of bb pairs, this control region provides a large sample of D-meson decays with similar decay kinematics to the signal events and is thus well suited for this purpose. Semileptonic b-quark decays are characterised by non-isolated leptons with lower pT and lower ETmiss than in signal events. Furthermore, the decay products of
b-quarks tend to be collimated within a jet and the average spatial separation between the lepton and the D meson from the b-quark decay is thus smaller than in W D(∗) events. The control sample with semileptonic b-quark decays is selected in the muon channel. The muon selection follows the signal selection but with the isolation and impact parameter
JHEP05(2014)068
m [GeV] 1.75 1.8 1.85 1.9 1.95 2 2.05 2.1 Events/12 MeV 5 10 15 20 25 30 3 10 × ATLAS -1 Ldt = 4.6 fb∫
= 7 TeV s ± π ± π ± K → ± D Control region Data Background m(D) [GeV] 1.75 1.8 1.85 1.9 1.95 2 2.05 2.1 Significance -2 -10 1 2 m [MeV] ∆ 135 140 145 150 155 160 165 170 175 180 185 Events/MeV 2 4 6 8 10 12 14×103 ATLAS -1 Ldt = 4.6 fb∫
= 7 TeV s ± π ) ± π ± (K → ± π 0 D → ± D* Control region Data Background ) [MeV] 0 m = m(D*)-m(D ∆ 135 140 145 150 155 160 165 170 175 180 185 Significance -2 -10 1 2 m [MeV] ∆ 135 140 145 150 155 160 165 170 175 180 185 Events/MeV 1 2 3 4 5 6 7 8 9×10³ ATLAS -1 Ldt = 4.6 fb∫
= 7 TeV s ± π ) 0 π ± π ± (K → ± π 0 D → ± D* Control region Data Background ) [MeV] 0 m = m(D*)-m(D ∆ 135 140 145 150 155 160 165 170 175 180 185 Significance -2 -10 1 2 m [MeV] ∆ 135 140 145 150 155 160 165 170 175 180 185 Events/MeV 2 4 6 8 10 12 14 16×103 ATLAS -1 Ldt = 4.6 fb∫
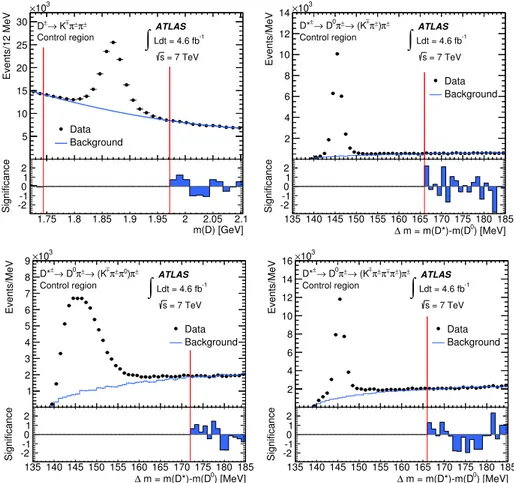
= 7 TeV s ± π ) ± π ± π ± π ± (K → ± π 0 D → ± D* Control region Data Background ) [MeV] 0 m = m(D*)-m(D ∆ 135 140 145 150 155 160 165 170 175 180 185 Significance -2 -10 1 2Figure 3. Reconstructed m(D) and ∆m = m(D∗) − m(D0) distributions in the sample with
semileptonic b-quark decays for D± → K∓π±π±(top left), D∗±→ D0π±→ (K∓π±)π±(top right),
D∗± → D0π± → (K∓π±π0)π± (bottom left) and D∗± → D0π± → (K∓π±π∓π±)π± (bottom
right). The data distributions are shown by the filled markers. The solid line represents the shape of the combinatorial background that is subtracted in order to obtain the signal templates for the fits to the W D(∗)signal region. The combinatorial background is normalised in the sidebands of the m(D) and ∆m distributions indicated by the vertical lines. The lower panels show the statistical significance of the deviations of the fit from the data in the sideband region.
requirements removed and with a lower muon momentum requirement of pµT > 18 GeV. In addition, the Emiss
T and mWT requirements are inverted to make the control region
or-thogonal to the signal region. Other selection criteria are identical to those applied to the W D(∗) signal sample. The muon and the reconstructed D(∗)candidate are required to be within ∆R(µ, D(∗)) < 1 and to have an invariant mass consistent with a B-meson decay,
m(µD(∗)) < 5 GeV. Finally, the muon and the D(∗)are required to have opposite charge. The mass distributions of reconstructed D candidates in the control region as well as the ∆m distributions for D∗ candidates are shown in figure 3. The template histograms used for the fit in the W D(∗)signal region are obtained from these distributions by subtract-ing the combinatorial background. The continuously fallsubtract-ing spectrum of the combinatorial background in the D channel is described by a second-order polynomial with parameters extracted from a fit to the mass sidebands. In the D∗ channel, events with a wrong-sign
JHEP05(2014)068
soft-pion track are used to model the shape of the combinatorial background in the ∆m distribution. In this configuration, the soft pion has the same charge as the muon and the kaon. The normalisation of the combinatorial background is obtained in the region of high ∆m where the signal contribution is negligible. Appropriate template predictions are obtained for each bin in pDT(∗) and for each charge. For the fits in bins of |η`|, the signal templates are obtained from the inclusive sample. The procedure used to derive the D∗ templates from data in events with semileptonic b-quark decays removes combinatorial background but can potentially retain events from other D-meson decay modes which can produce broad reflections at low ∆m. Since these reflections cannot be discriminated ef-ficiently from the reconstructed signal, they are treated as signal events in the fits. The effect of these reflections on the fitted yields is later included as part of the calculation of the reconstruction efficiency.
Shape of combinatorial background. The shape of the combinatorial background in the signal region due to W +light production is determined in a control region defined by Lxy < −1 (0) mm for D(D∗) decays. A functional form is used to fit the shape of
the background in the W +light control region: a second-order polynomial in the m(D) distribution and a logarithmic function for the background in the ∆m distribution. These functions are found to provide a good description of the combinatorial background in all pDT(∗) bins; their parameters are determined for each decay mode from a fit in the control region and are fixed in the fits to the signal region.
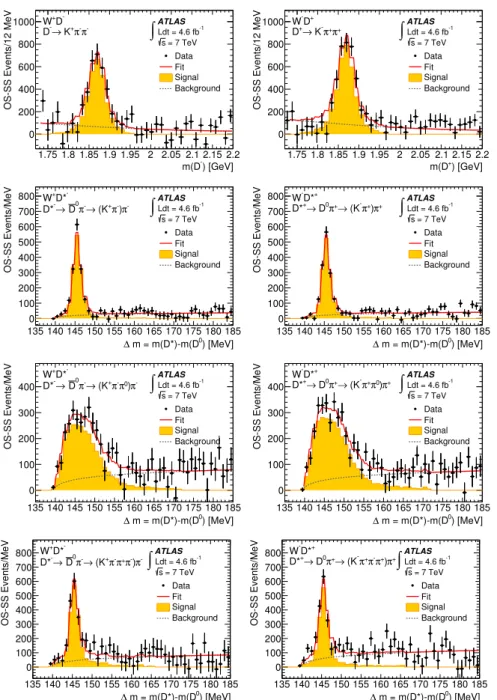
Fit results. In the fits to the W D(∗) signal region, the normalisations of the signal template and the background function are the only free parameters. The results of the fits to m(D) and ∆m in the signal region are shown in figure 4. The electron and muon channels are combined to decrease the statistical uncertainty. In addition to the inclusive samples, the fits are performed in four bins of pDT(∗) and four bins of |η`|. Good-quality fits are obtained in all kinematic regions.
5.3.2 Removal of heavy-flavour backgrounds
The W D(∗)yields are obtained by subtracting the expected contribution from heavy-flavour pair production from the fitted yields. D mesons from heavy-flavour pair-produced events give rise to a peak in the mass spectra for both the OS and SS events (see figure 2). Given the large uncertainties in predicting this background from simulation, a data-driven technique is used to estimate it. The number of background events in the signal region is obtained from the ABCD method [57] applied to background-dominated control regions defined by reversing the lepton isolation requirement or the missing transverse momentum and mWT requirements. In these control regions, the number of events is taken to be the number of events in the m(D) or ∆m peaks, since the combinatorial background contribution is already taken into account in the fitting procedure described in the preceding sections. The number of events in the peak is determined by a fit to the m(D) or ∆m distributions in the control regions. The peaking background in the OS–SS W D(∗) signal, which is dominated by heavy-flavour pair production, is found to be less than 1% in all
JHEP05(2014)068
) [GeV]
-m(D 1.75 1.8 1.85 1.9 1.95 2 2.05 2.1 2.15 2.2
OS-SS Events/12 MeV
0 200 400 600 800 1000 ATLAS -1 Ldt = 4.6 fb
∫
s = 7 TeV -D + W -π -π + K → -D Data Fit Signal Background ) [GeV] + m(D 1.75 1.8 1.85 1.9 1.95 2 2.05 2.1 2.15 2.2OS-SS Events/12 MeV
0 200 400 600 800 1000 ATLAS -1 Ldt = 4.6 fb
∫
s = 7 TeV + D -W + π + π K → + D Data Fit Signal Background ) [MeV] 0 m = m(D*)-m(D ∆ 135 140 145 150 155 160 165 170 175 180 185 OS-SS Events/MeV 0 100 200 300 400 500 600 700 800 ATLAS -1 Ldt = 4.6 fb∫
s = 7 TeV -D* + W -π ) -π + (K → -π 0 D → -D* Data Fit Signal Background ) [MeV] 0 m = m(D*)-m(D ∆ 135 140 145 150 155 160 165 170 175 180 185 OS-SS Events/MeV 0 100 200 300 400 500 600 700 800 ATLAS -1 Ldt = 4.6 fb∫
s = 7 TeV + D* -W + π ) + π (K → + π 0 D → + D* Data Fit Signal Background ) [MeV] 0 m = m(D*)-m(D ∆ 135 140 145 150 155 160 165 170 175 180 185 OS-SS Events/MeV 0 100 200 300 400 ATLAS -1 Ldt = 4.6 fb∫
s = 7 TeV -D* + W -π ) 0 π -π + (K → -π 0 D → -D* Data Fit Signal Background ) [MeV] 0 m = m(D*)-m(D ∆ 135 140 145 150 155 160 165 170 175 180 185 OS-SS Events/MeV 0 100 200 300 400 ATLAS -1 Ldt = 4.6 fb∫
s = 7 TeV + D* -W + π ) 0 π + π (K → + π 0 D → + D* Data Fit Signal Background ) [MeV] 0 m = m(D*)-m(D ∆ 135 140 145 150 155 160 165 170 175 180 185 OS-SS Events/MeV 0 100 200 300 400 500 600 700 800 ATLAS -1 Ldt = 4.6 fb∫
s = 7 TeV -D* + W -π ) -π + π -π + (K → -π 0 D → -D* Data Fit Signal Background ) [MeV] 0 m = m(D*)-m(D ∆ 135 140 145 150 155 160 165 170 175 180 185 OS-SS Events/MeV 0 100 200 300 400 500 600 700 800 ATLAS -1 Ldt = 4.6 fb∫
s = 7 TeV + D* -W + π ) + π -π + π (K → + π 0 D → + D* Data Fit Signal BackgroundFigure 4. Results of the fits to the distributions of m(D) and ∆m = m(D∗) − m(D0) in OS– SS W±D(∗)∓ events. The fit results are shown for W+D(∗)− (left) and W−D(∗)+ (right) in the inclusive sample defined by pD(∗)
T > 8 GeV and |ηD (∗)
| < 2.2: D± → K∓π±π±(top row), D∗± →
D0π± → (K∓π±)π± (second row), D∗± → D0π± → (K∓π±π0)π± (third row) and D∗± →
D0π±→ (K∓π±π∓π±)π± (bottom row). The data distributions are shown by the filled markers,
where the error bars show the statistical uncertainty. The fit result is shown by the solid line. The filled histogram represents the signal template normalised according to the fit result, while the contribution of the combinatorial background is shown by the dotted line.
bins of pDT(∗) and |η`|. Systematic uncertainties on the amount of background from heavy-flavour production arise due to the extrapolation uncertainty from the background control region to the signal region. For the integrated measurement, these uncertainties are small
JHEP05(2014)068
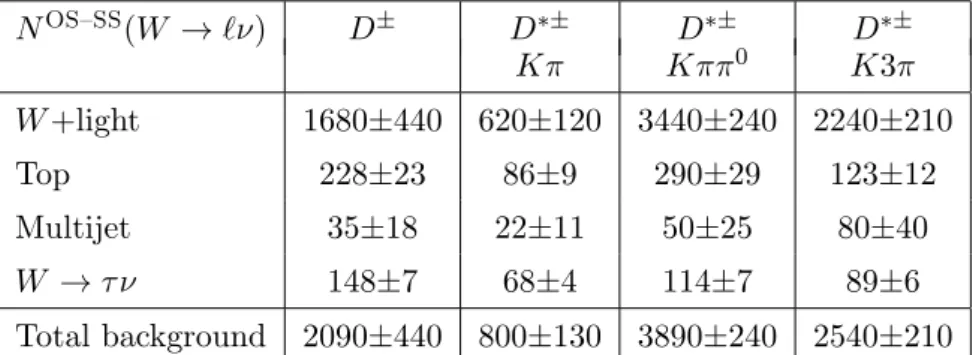
NOS–SS(W → `ν) D± D∗± D∗± D∗± Kπ Kππ0 K3π W +light 1680±440 620±120 3440±240 2240±210 Top 228±23 86±9 290±29 123±12 Multijet 35±18 22±11 50±25 80±40 W → τ ν 148±7 68±4 114±7 89±6 Total background 2090±440 800±130 3890±240 2540±210Table 1. Estimated background in OS–SS events in the four decay modes of the W D(∗)
analy-sis. The electron and the muon channels are combined. The uncertainties include statistical and systematic contributions.
for all decay modes, at a level of 0.3–0.5%. The systematic uncertainties range from 0.3% to 2.1% depending on the bin of pDT(∗) and the D(∗)decay mode.
5.4 Resulting OS-SS yields
After subtracting the contribution of heavy-flavour events from the fitted yields, the re-maining background is predominantly due to top-quark events and is estimated using MC simulation. The uncertainty on the predicted number of top-quark events due to the un-certainty on the cross section and the fiducial acceptance is 10% in the low pDT(∗) bins, while it is increased to 20% in the two highest pDT(∗) bins to cover the uncertainty due to the limited number of MC events.
The yields are determined in each pDT(∗) and |η`| bin, separately for W+D(∗)− and
W−D(∗)+ and are quoted for the four D(∗)decay modes in a range of 140 MeV < ∆m < 155 MeV for D0 → K−π+ and D0 → K−π+π−π+ , 140 MeV < ∆m < 170 MeV for D0 →
K−π+π0 and 1.8 GeV < m(D) < 1.94 GeV. The measured yields in the integrated data sample after combining the electron and muon channels are 7990±370 for the D mode and 3590±130, 8850±290 and 5890±270 for the D∗ modes (Kπ, Kππ0, K3π). The expected numbers of background events are summarised in table1.
6 Event yields for W c-jet final states
In a complementary approach, inclusive charm-quark production is studied by exploiting the semileptonic decays of charm quarks into muons. In this approach, a charm quark is identified by reconstructing the jet of particles produced by its hadronisation and finding an associated soft muon from its semileptonic decay. The singlecharm yield for each W -boson charge is determined from the OS–SS yields. The analysis is performed on separate samples of events with exactly one and exactly two reconstructed jets as well as on the combined sample of events with one or two jets. The electron and muon decay channels of the W boson are analysed separately and subsequently combined.
JHEP05(2014)068
6.1 Charm-jet selection
In addition to the event selection described in section4, events are required to have either one or two jets with pT > 25 GeV and |η| < 2.5. In order to remove jets reconstructed from
energy deposits from particles produced in pileup events, the pT sum of tracks inside the
jet and associated with the primary vertex divided by the pT sum of all tracks inside the
jet is required to be larger than 0.75.
One and only one jet is required to contain a soft muon with pT> 4 GeV and |η| < 2.5.
A good match between the ID and MS tracks of the soft muon is required. The same set of ID hit requirements [54] that is used for muon candidates from W -boson decays is applied to soft muons in addition to two impact parameter requirements: |d0| < 3 mm
and |z0· sin θ| < 3 mm. Exactly one muon is required to be associated with the jet within
a cone of radius ∆R = 0.5; the small fraction of events with jets containing more than one muon is discarded. The soft-muon tagging (SMT) efficiency and mistagging rate are measured in data [58]. The overall c-tagging efficiency is about 4%, due mainly to the low branching ratio of charmed hadrons to muons (approximately 10%). The light-quark mistagging efficiency is around 0.2% depending on the jet kinematics. Scale factors are applied to correct the MC simulation efficiencies to those measured in data. Efficiency scale factors are applied to b- and c-jets. Scale factors for the mistagging rates are applied to light jets. Two additional requirements, with minor impact on the signal, are applied in the muon channel to suppress the Z+jets and the Υ backgrounds. First, the c-jet candidate is required to have either a track multiplicity of at least three or an electromagnetic-to-total energy fraction of less than 0.8. Second, the event is discarded if the invariant mass of the soft muon and the muon from the decay of the W -boson candidate is close to either the Z-boson mass (i.e. 80–100 GeV) or the Υ mass (i.e. 8–11 GeV).
6.2 Determination of OS-SS yields
Since most backgrounds are nearly OS/SS symmetric, the number of OS–SS events is a good estimator of the signal yield. Nonetheless, residual asymmetries in the backgrounds necessitate an additional subtraction. The signal yields are determined from:
NOS–SS
W c-jet = NdataOS–SS−
X
bkg
Abkg· NbkgOS+SS, (6.1)
where NOS+SS
bkg is the sum of the number of background events in the OS (NbkgOS) and SS
(NSS
bkg) samples and the asymmetry Abkg is defined as
Abkg = NbkgOS–SS/NbkgOS+SS. (6.2)
Backgrounds to the W c-jet candidate sample include the production of W +light, W plus heavy-flavour quark pairs (c¯c, b¯b), multijet events, Z and, to a lesser extent, single and pair-produced top quarks, and dibosons.
The background from W +light events and multijet events is estimated with data-driven methods. Z events, in which one of the muons from the Z decay radiates a photon
JHEP05(2014)068
[GeV] miss T E 0 20 40 60 80 100 120 Events/2.5 GeV 0 200 400 600 800 1000 1200 1400 1600 Data Fit EWK+top Multijet ATLAS -1 Ldt = 4.6 fb∫
= 7 TeV s Wc-jet 1,2 jets OS ν e → W [GeV] miss T E 0 20 40 60 80 100 120 Events/2.5 GeV 0 100 200 300 400 500 600 700 800 900 Data Fit EWK+top Multijet ATLAS -1 Ldt = 4.6 fb∫
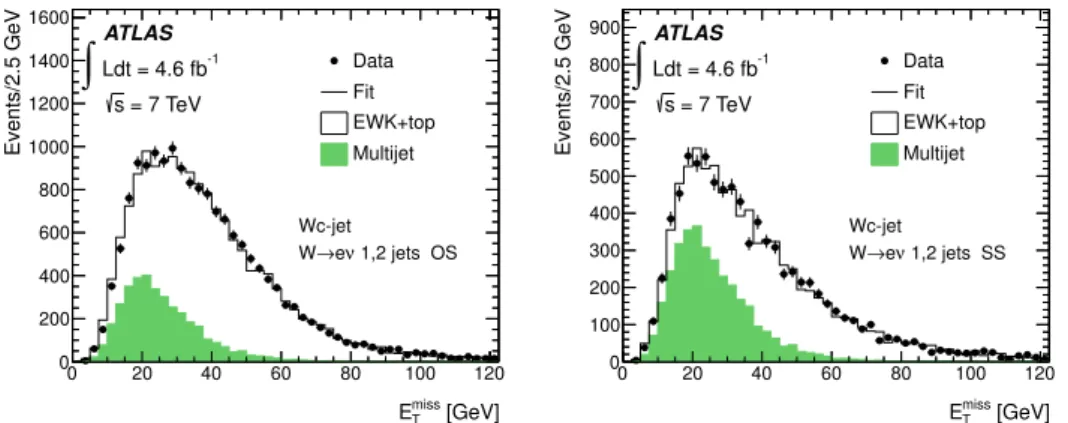
= 7 TeV s Wc-jet 1,2 jets SS ν e → WFigure 5. Results of the fits to the Emiss
T distribution which are used to determine the multijet
background in the electron channel, in the OS (left) and SS (right) samples of W +1,2 jets candidate events. The data are shown by filled markers and the fit result by the solid line. The multijet template, normalised according to the fit result, is shown by the filled histogram. The shape of the distribution for the electroweak and top-quark processes is obtained from simulation. Electroweak processes include W , Z and diboson processes.
that is mistakenly reconstructed as a jet, are a significant background source in the muon channel and are thus determined using a data-driven method. Smaller backgrounds from top-quark and diboson production, and the Z+jets background in the electron channel, are estimated from MC simulations. Backgrounds from W + b¯b, W + c¯c are negligible since they are OS/SS symmetric.
6.2.1 Backgrounds and yield in the electron channel
The numbers of W +light and multijet background events are obtained from a constrained χ2 fit to the number of events in the SS sample followed by a propagation to OS–SS using
the equation NOS–SS bkg = Abkg· NbkgOS+SS = 2 · Abkg 1 − Abkg NSS bkg. (6.3)
In the fit, the sum of the multijet and W +light backgrounds plus the remaining back-grounds and a small signal contribution is required to be equal to the total data count in the SS sample. The relative fractions of multijet and W +light events are allowed to vary in the fit, while all other backgrounds and the signal contribution are fixed to the values from simulation.
The OS/SS asymmetry of the multijet background, Amultijet, is found by performing
a binned maximum-likelihood fit of templates to the ETmiss distribution in data. The fit follows the procedure discussed in section 5.1 and is done in an expanded sample where the ETmiss selection requirement is removed. Two templates are used: one representing the multijet background and the other representing the contributions from all other sources. The template for the multijet sample is extracted from a data control sample selected by inverting the electron isolation and some of the electron identification requirements. Contamination in the control sample from W/Z and top-quark events is estimated from simulation and subtracted. The template representing all other processes, including the
JHEP05(2014)068
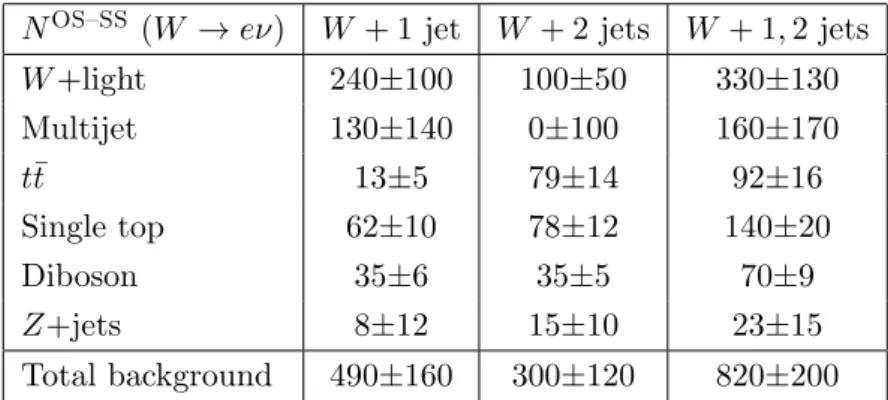
NOS–SS (W → eν) W + 1 jet W + 2 jets W + 1, 2 jets
W +light 240±100 100±50 330±130 Multijet 130±140 0±100 160±170 t¯t 13±5 79±14 92±16 Single top 62±10 78±12 140±20 Diboson 35±6 35±5 70±9 Z+jets 8±12 15±10 23±15 Total background 490±160 300±120 820±200
Table 2. Estimated background in OS–SS events in the W +1 jet, W +2 jets and W +1,2 jets samples for the electron channel. The uncertainties include statistical and systematic contribu-tions. The correlations between the uncertainties for the different background estimates stemming from the constraint in the SS sample is taken into account when computing the total background uncertainties. For backgrounds estimated with data-driven methods the yields in the W +1 jet, W +2 jets, and W +1,2 jets sample are estimated independently.
signal, W/Z, diboson and top-quark production, is obtained from MC simulation and built separately for OS and SS samples. Figure5shows the results for the OS and SS W +1,2 jets samples. Amultijetis computed using the fit results in the signal region (ETmiss> 25 GeV) and
is found to be consistent with zero within uncertainties. The uncertainties are dominated by the statistical component. The systematic uncertainties are estimated by varying the fit range and trying alternative multijet and other background templates. These uncertainties are found to be small.
The OS/SS asymmetry of the W +light background, AW +light, is obtained from MC
simulation and corrected using the asymmetry measured in a data control region following the relation:
AW +light= AMCW +light
Adata,tracksW +light
AMC,tracksW +light . (6.4)
AMCW +lightis the OS/SS asymmetry in the MC simulation for the signal region and AMC,tracksW +light
(Adata,tracksW +light ) is the OS/SS asymmetry in MC (data) events estimated using the charges
of the W boson and a generic track that passes the soft-muon kinematic requirements. AMC,tracksW +light and Adata,tracksW +light are computed from an expanded sample selected with no soft-muon requirements (called the pretag sample). AW +light is found to be approximately
10%. The uncertainty on AW +lightis dominated by the statistical uncertainty on AMCW +light.
The sub-leading systematic uncertainty contains contributions from uncertainties on the background contamination in the pretag sample and the modelling of the track properties. The estimated numbers of background events are shown in table2. The total number of OS(SS) events in the data SMT samples of W +1 jet and W +2 jets is 7436(3112) and 4187(2593), respectively. The corresponding number of OS–SS events in data is 4320±100 for the W +1 jet and 1590±80 for the W +2 jets sample.
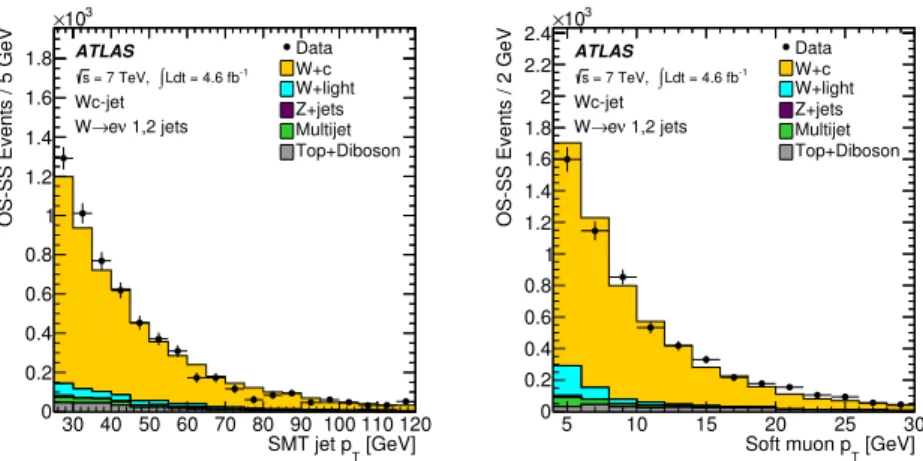
Figure6shows the pT distribution of the SMT jet and the soft muon in OS–SS events
JHEP05(2014)068
[GeV]
T
SMT jet p 30 40 50 60 70 80 90 100 110 120
OS-SS Events / 5 GeV
0 0.2 0.4 0.6 0.8 1 1.2 1.4 1.6 1.8 3 10 × Data W+c W+light Z+jets Multijet Top+Diboson ATLAS -1 Ldt = 4.6 fb ∫ = 7 TeV, s Wc-jet 1,2 jets ν e → W [GeV] T Soft muon p 5 10 15 20 25 30
OS-SS Events / 2 GeV
0 0.2 0.4 0.6 0.8 1 1.2 1.4 1.6 1.8 2 2.2 2.4 3 10 × Data W+c W+light Z+jets Multijet Top+Diboson ATLAS -1 Ldt = 4.6 fb ∫ = 7 TeV, s Wc-jet 1,2 jets ν e → W
Figure 6. Distribution of the SMT jet pT(left) and the soft-muon pT(right) in OS–SS events of
the W +1,2 jets sample for the electron channel. The normalisation of the W +light background and the shape and normalisation of the multijet background are obtained with data-driven methods. All other backgrounds are estimated with MC simulations and normalised to their theoretical cross sections. The signal contribution is normalised to the measured yields.
the measured yields and the background contributions are normalised to the values listed in table2. The MC simulation is in satisfactory agreement with data.
In addition to the inclusive samples, yields and cross sections are measured separately for W+ and W− and in 11 bins of |η`|. The multijet background |η`|-shape is derived
from individual fits to the ETmiss distribution and normalised to the inclusive total. The remaining backgrounds are taken from simulation.
6.2.2 Backgrounds and yield in the muon channel
The multijet background in the muon channel is substantially different from that in the electron channel since it is dominated by heavy-flavour semileptonic decays. The estimation technique is adapted to take this into account. The multijet background in OS+SS events is determined by the equation
NOS+SS multijet= N pretag multijet· R SMT multijet, (6.5)
where Nmultijetpretag is the multijet event yield in the pretag sample and RSMTmultijetis the soft-muon tagging rate for events in the multijet sample.
The evaluation of Nmultijetpretag uses a data-driven technique known as the Matrix Method [59]. An expanded sample enriched in multijet events is obtained by applying all selection cuts to the data except for the muon isolation requirements. The efficiencies of the isolation requirements for multijet events and prompt isolated muons are needed to relate the expanded sample to the signal sample. The isolation efficiency for prompt muons is measured in an independent sample of Z → µµ events. The efficiency in multijet events is measured both in a control sample with inverted missing transverse momentum and W -boson transverse mass requirements, and through a fit to the muon d0 significance;
it is parameterised as a function of the muon and jet kinematics. The average of the results obtained with the two measurements is taken as the final estimate and half the difference is used as the systematic uncertainty.
JHEP05(2014)068
[GeV] T W boson m 0 20 40 60 80 100 120 140 Events / 5 GeV 0 2 4 6 8 10 12 3 10 × Data W+jets Z+jets Top+Diboson ATLAS -1 Ldt = 4.6 fb ∫ = 7 TeV, s Wc-jet 1,2 jets OS+SS ν µ → W Control selection Signal selectionMuon calorimeter-based isolation [GeV] 0 2 4 6 8 10 12 14 Events / 0.25 GeV 10 2 10 3 10 4 10 Data W+jets Z+jets Top+Diboson ATLAS -1 Ldt = 4.6 fb ∫ = 7 TeV, s Wc-jet 1,2 jets OS+SS ν µ → W Signal selection Control selection
Muon track-based isolation [GeV] 0 2 4 6 8 10 12 14 Events / 0.25 GeV 2 10 3 10 4 10 Data W+jets Z+jets Top+Diboson ATLAS -1 Ldt = 4.6 fb ∫ = 7 TeV, s Wc-jet 1,2 jets OS+SS ν µ → W Signal selection Control selection
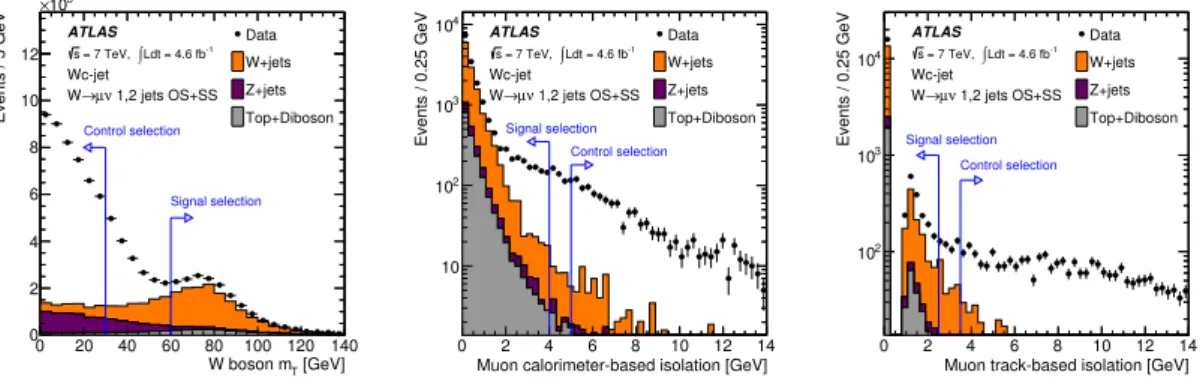
Figure 7. Distribution of the W -boson transverse mass (left), muon calorimeter-based isolation (centre) and muon track-based isolation (right) in data and the expectation from W/Z+jets, top-quark and diboson events. Events with low transverse mass and large values of isolation variables are predominantly multijet events. W/Z+jets refers to the production of W/Z bosons in association with light, c or b jets.
RSMTmultijet and Amultijet are independently determined in two control regions enriched
in multijet background. The samples are selected by inverting either the muon isolation requirements or the W -boson transverse mass requirement. The distributions of events as a function of the muon isolation variables and the W -boson transverse mass are shown in figure 7. The amount of contamination from W/Z+jets events in the multijet control regions is estimated from MC simulation. The contamination from top-quark and diboson production is negligible. The value of RSMTmultijet is determined by measuring the soft-muon tagging rate as a function of the muon isolation in the multijet control regions and ex-trapolating it to the signal region assuming a linear dependence. Uncertainties from the W/Z+jets contamination level and from the extrapolation procedure are taken into ac-count. The value of Amultijet is deduced from the average of the two control regions and is
approximately 20%.
The W +light background in OS+SS events is estimated according to the follow-ing equation: NOS+SS W +light= N pretag W +jets· flight· R SMT W +light, (6.6)
where NW +jetspretag is the yield of W +jets events in the pretag sample, flight is the fraction of
events in which the W boson is produced in association with a light jet and RSMT W +light is
the soft-muon tagging rate in W +light events. All the terms of equation (6.6) are derived using data-driven methods.
NW +jetspretag is calculated as the difference between the number of selected data events
and the sum of all other expected background contributions, namely multijet, Z+jets, top-quark, and diboson production in the pretag sample. The multijet background is estimated using the Matrix Method as explained above while all other backgrounds are taken from simulation. The fraction flight is obtained through an analysis of the tagging rate of a
lifetime-based tagger in the pretag sample as done in ref. [60]. RSMTW +light is determined using a W +light MC simulation corrected by a data-derived scale factor for the soft-muon mistag rate [58]. The asymmetry AW +lightis obtained using equation (6.4), as done in the
JHEP05(2014)068
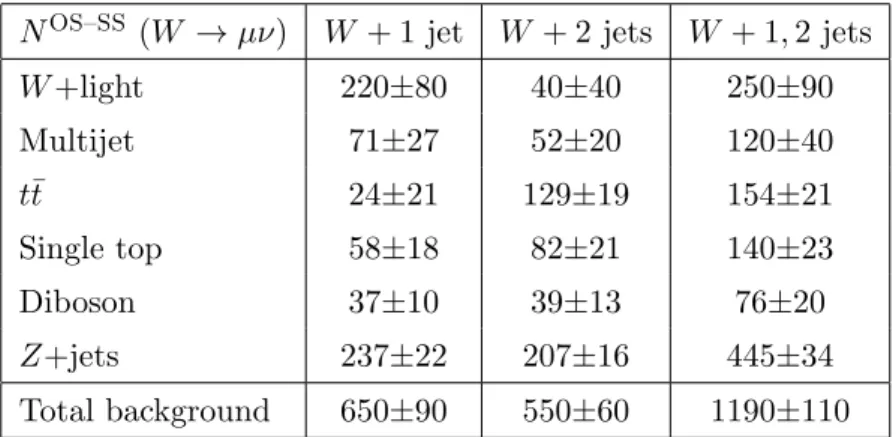
NOS–SS (W → µν) W + 1 jet W + 2 jets W + 1, 2 jets
W +light 220±80 40±40 250±90 Multijet 71±27 52±20 120±40 t¯t 24±21 129±19 154±21 Single top 58±18 82±21 140±23 Diboson 37±10 39±13 76±20 Z+jets 237±22 207±16 445±34 Total background 650±90 550±60 1190±110
Table 3. Estimated background in OS–SS events in the W +1 jet, W +2 jets and W +1,2 jets samples for the muon channel. Uncertainties include statistical and systematic contributions.
The Z+jets background is estimated by using a data control sample to normalise the MC simulation. The control sample is defined by requiring the invariant mass of the soft muon and the muon from the decay of the W -boson candidate to be between 80 GeV and 100 GeV. The normalisation is carried out in OS–SS events, which has the advantage of minimising contributions from non-Z events. The Z+jets yield in the control region is estimated from data by subtracting the expected contamination of W + c signal, W +light and diboson events (the latter two account for less than 1% of the events). The contami-nation of the control sample by W + c events is estimated initially through MC simulation and then refined by iteratively adjusting the W + c, Z+jets and W +jets normalisations to match the data. A normalisation factor for Z+jets of 1.06 ± 0.06 is derived. The invariant mass of the lepton from the decay of the W -boson candidate and the soft muon is shown in figure8for W +1,2 jets data passing all event selection requirements except for the veto around the invariant masses of the Z boson and the Υ meson. The expected contributions of all processes, normalised as described above, are also shown. The predicted distributions provide a good description of the data.
The total number of OS(SS) events in the data samples of W +1 jet and W +2 jets is 7736(2775) and 4376(2479), respectively. The corresponding number of OS–SS events in data is 4960±100 for the W +1 jet and 1900±80 for the W +2 jets sample. The expected backgrounds are summarised in table3.
Figure 9 shows the distribution of the SMT jet pT and the soft-muon pT in OS–
SS events in the W +1,2 jets sample for the muon channel. The signal contribution is normalised to the measured yields and the background contributions are normalised to the values listed in table3. The MC simulation is in fair agreement with data.
In addition to the inclusive samples, yields and cross sections are measured in 11 bins of |η`|, separately for W+ and W−, as is done for the electron channel except that the
|η`| distribution of the multijet background is derived from the inverted isolation and low
JHEP05(2014)068
) [GeV] µ , soft µ m( W-decay 0 20 40 60 80 100 120 140OS-SS Events / 2.5 GeV
0 100 200 300 400 500 600 700 800 Data W+c W+light Z+jets Multijet Top+Diboson ATLAS -1 Ldt = 4.6 fb ∫ = 7 TeV, s Wc-jet 1,2 jets ν µ → W
Figure 8. Invariant mass constructed using the four-momenta of the soft muon and the muon from the decay of the W -boson candidate.
[GeV]
T
SMT jet p 30 40 50 60 70 80 90 100 110 120
OS-SS Events / 5 GeV
0 0.2 0.4 0.6 0.8 1 1.2 1.4 1.6 1.8 2 2.2 3 10 × Data W+c W+light Z+jets Multijet Top+Diboson ATLAS -1 Ldt = 4.6 fb ∫ = 7 TeV, s Wc-jet 1,2 jets ν µ → W [GeV] T Soft muon p 5 10 15 20 25 30
OS-SS Events / 2 GeV
0 0.5 1 1.5 2 2.5 3 10 × Data W+c W+light Z+jets Multijet Top+Diboson ATLAS -1 Ldt = 4.6 fb ∫ = 7 TeV, s Wc-jet 1,2 jets ν µ → W
Figure 9. Distribution of the SMT jet pT (left) and soft-muon pT (right) in OS–SS events of
the W +1,2 jets sample for the muon channel. The normalisations of the W +light and Z+jets backgrounds and the shape and normalisation of the multijet background are obtained with data-driven methods. All other backgrounds are estimated with MC simulations and normalised to their theoretical cross sections. The signal contribution is normalised to the measured yields.
7 Cross-section determination
7.1 Definition of the fiducial phase space
The fiducial cross sections σfidOS−SS(W D(∗)) and σfidOS−SS(W c-jet) measure the cross sections times the branching ratio W → `ν and are determined in a common fiducial region defined in MC simulation in terms of the W -boson kinematics as follows:
• p` T > 20 GeV and |η`| < 2.5, • pν T > 25 GeV, • mW T > 40 GeV,
where ` and ν are the charged lepton and the neutrino from the decay W → `ν. The leptons are defined before QED final-state radiation. As discussed in the following, the measured