Issues
ISSN: 2146-4138
available at http: www.econjournals.com
International Journal of Economics and Financial Issues, 2017, 7(2), 574-584.
Bank Specific and Macroeconomic Determinants of Bank
Profitability: Evidence from Turkey
Mehmet Sabri Topak
1*, Nimet Hulya Talu
21Department of Business Administration, Faculty of Economics, Istanbul University, Turkey, 2Faculty of Economics, Administrative
and Social Sciences, Gelisim University, Turkey. *Email: [email protected]
ABSTRACT
In this study, we attempt to determine the bank-specific and macroeconomic determinants of commercial banks in Turkey over the period 2005-2015. A balanced panel data set has been formed covering 43 periods between the dates of January 2005 and September 2015. Each period is of 1-year length. According to the empirical results, bank-specific characteristics such as, the ratio of interest on loans to the interest on deposits (ILID), used as a proxy for net interest margin, the ratio of net fees and commissions revenues to total operating expenses (FCE), and relative size (SIZE) have positive and significant impact on profitability represented by return on assets and return on equity. On the other hand, the ratio of nonperforming loans to total loans (NPL) used as a proxy for credit risk, and capital adequacy (ESA) and the ratio of other operating expenses to total operating revenues (OEI), are negatively related to profitability. The most striking result is the fact that among all the bank-specific variables OEI has the strongest impact on profitability. This finding is consistent with the fact that since banks are limited in the determination of interest rates, they do not have control on the level of net interest revenues. Thus economising on the operating expenses is a more feasible option in increasing the profits. With respect to macroeconomic variables, real GDP and interest rate have positive impact on profitability whereas the exchange rate has a negative impact.
Keywords: Bank Profitability, Performance, Turkish Banking Sector, Panel Data JEL Classifications: G21, L25, C23
1. INTRODUCTION
Banks play a major role in the distribution of financial sources to fund demanding units in the economy. Firms can provide funds from primary stock offerings, issuance of long and short-term debt securities as well. However, in developing regions such as Middle East, majority of Asia and Africa, banks play a major role in the allocation of financial sources. Therefore, the efficient functioning of the banking system carries utmost importance.
Before we proceed to the determination of bank profitability, it is useful to give information about the developments in the Turkish banking sector during the last three decades. During the 1990-2003 period quite a number of bank failures occurred due the structural problems of the Turkish economy, and the fragilities of the Turkish banking sector. The characteristics of the 1990-2000 period can be listed as high inflation, high level of domestic borrowing, high level of budget deficit, current account deficit, and as result,
macroeconomic instability. The average GDP growth during the period was 4.7% and changed frequently within the range from 9.3% to −5.5%1. Low level of domestic savings negatively affected
the development of money and capital markets and the financial markets remained shallow despite the liberalization efforts in the 1990-2000 period. The high level of inflation and budget deficit increased the borrowing requirements of the government, and this resulted in the issuance of government debt securities with high yields. Due to the borrowing requirements of the treasury, banks were pressured to make extensive investments in government debt securities as a result of which they could not fulfil the function of funding the real economy. The share of funding of treasury outgrew the share of loans extended to the real sector. This increased the market risk exposed by the banks and led to the failure of some
1 Economic and Social Indicators Report. (1950-2014), Ministry of Development of the Republic of Turkey, Electronically. Available from: http://www.mod.gov.tr/Lists/RecentPublications/Attachments/84/ Economic%20and%20Social%20Indicators%20(1950-2014).pdf.
which were given the task of market making for government securities.
Foreign investors seizing the opportunity, invested enormous capital in the stock Exchange raising the BIST to unsupportable peaks and then disinvested their holdings and invested in Treasury Bonds, making use of high yields, and finally sold them and converted the proceeds into USD or EURO. The entrance and departure of great amounts of capital into the financial markets increased the volatility and the liquidity requirements of the economy.
Turkish economy underwent two successive crises, the first at the end of November 2000 and 3 months later the 2nd in February
2001. Due to the mounting economic and sectoral problems during the 1990-2001 period and its aftermath 2002-2003 period during which remedies were undertaken, operating licenses of 23 banks were revoked and they were transferred to the Savings Deposit Insurance Fund (SDIF)2. The government made a series of
structural reforms named “transition to the strong economy “and strict measures were taken in remedying the economic problems and restructuring the banking system3. The regulation, supervision,
and auditing of the banking sector was given to the newly formed autonomous governmental body, Banking Regulation and Supervision Agency (BRSA) and shortly after another body SDIF, SDIF responsible for the insurance of the saving deposits and their repayment to the depositors in the case of a bank failure was formed. The sole control of the banking sector and other financial institutions were placed under the authority of the BRSA. During the first years following the establishment of the BRSA, the operations of quite a number of banks were ceased and they were transferred to the SDIF.
BRSA prepared the regulations with respect to the Basel requirements and implemented measures to increase the capital adequacy and risk management capacity of the banking sector. Four public banks were closed and their assets were transferred to the biggest remain public banks: Ziraat Bank and Halk Bank. The Joint Fund Bank was established to which assets of the banks whose operations were ceased by BRSA were transferred. Measures applied other than bankruptcy consisted of selling the banks, or merging them with another private bank4.
As a result of the restructuring and close monitoring, the banking sector was strengthened and was hardly affected by the global financial crisis which started during 2008 and evolved into an economic crisis by 2010, the adverse effects of which are still felt on certain economies.
2 Electronically Available from: http://www.tmsf.org.tr/intikaleeden. bankalar.tr.
3 For more information on transition to the strong economy program, please see the program electronically. Available from: http://www.tcmb.gov.tr/ wps/wcm/connect/9d473f48-f02c-4631-94e7-ee64593f250d/strengten ingecon.pdf? MOD=AJPERES&CACHEID=9d473f48-f02c-4631-94e7-ee64593f250d.
4 For More Information on the Banking Sector Restructuring Program, Please See the Banking Sector Restructuring Program Progress Report-(V). BDDK, 2002, Electronically. Available from: www.bddk.org.tr/WebSitesi/ english/Reports/Other_Reports/2651BSRP_Progress_112002. pdf.
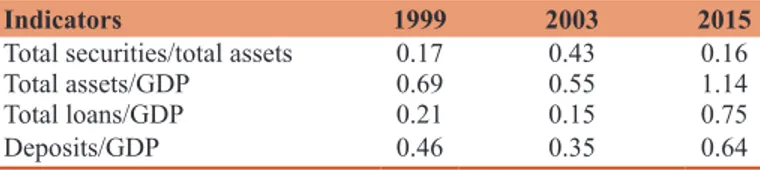
Several indicators of the banking sector in comparison with 2003, which reveal the strengthening of the sector, presented in Table 1.
2. LITERATURE REVIEW
The profitability of banks has always been an issue of great interest in economic literature. A considerable bulk of literature has come into existence in search for the indicators of profitability. In most of these studies the profitability of banks has been represented by the return on assets (ROA) and return on equity (ROE) besides other proxies. Some authors such as Sufian and Chong (2008), Athanasoglou et al. (2006), Pasiouras and Kosmidou (2007), Sufian (2012), Flamini et al. (2009) used ROA as the key indicator of profitability. ROE, has never been used as the sole indicator of profitability, but employed to elaborate the concept of profitability as evidenced in Tunay and Silpar (2006), Mirzaei and Mirzaei (2011). Dietrich and Wanzenried, in their 2011 dated study, considered return on average assets as more important than ROAE, return on average equity, because of its disregard of the higher risk associated with high leverage. On the other hand, Alexiou and Sofoklis (2009), parallel to Goddard et al. (2004), consider ROE as a more important indicator of profitability due to the fact that earnings generated from off - balance sheet activities which are not included in total assets, generate a significant contribution to total profit.
Demirgüç-Kunt and Huizinga (1999), Atasoy (2007), used net interest margin (NIM), computed as the ratio of the difference between interest revenues and interest expenses to total assets, as an additional dependent variable. Taskin (2011) and Capraru and Ihnatov (2014) used NIM besides ROA and ROE. Naceur and Omran, in their 2011 dated study, considered the use of NIM and Spread as important factors impacting profitability besides ROA and ROE. They defined spread as interest received divided by total earning assets minus interest paid divided by total liabilities.
The determinants of profitability can be categorized as internal factors, arising from the specific attributes of each bank, and external factors such as macroeconomic indicators and industry-specific factors.
2.1. Bank Specific Determinants of Bank Profitability The most commonly used proxies for bank-specific determinants are: NIM, capital adequacy, size, credit risk, liquidity, other operating expenses, and noninterest revenues.
Table 1: Comparison of the Turkish banking sector indicators between the years of 1999, 2003 and 2015
Indicators 1999 2003 2015
Total securities/total assets 0.17 0.43 0.16 Total assets/GDP 0.69 0.55 1.14 Total loans/GDP 0.21 0.15 0.75
Deposits/GDP 0.46 0.35 0.64
Source: Statistical Reports of the Banks Association of Turkey: Electronically. Available from: https://www.tbb.org.tr/en/banks-and-banking-sector-information/ statistical-reports/20
2.1.1. NIM
NIM is computed as the difference between the interest received and interest paid, divided by total or interest bearing assets. When the income statement of a bank is analysed, it is clearly evident that net interest revenues comprise the major portion of the total operating income. In an economy the level of interest rates is determined by the supply and demand for funds, country risk, and the policies of central banks. In reality, there is very little ground for banks to play in this area. Apart from the general level of interest rates, the competitive structure of the banking sector is also important in determining the interest charged for loans and interest offered for deposits.
In a highly concentrated market, banks with greater assets have more power to determine the interest rates on loans and deposits. A bank with a strong capital base, may be able to offer lower rates for deposits. Its success in providing funds depends on the relative power of the bank in the sector and the risk assessment of the depositors. In Turkey, which had two financial crises in 2000 and 2001 successively, a considerable number of bank failures occurred. As a result, BRSA exercises strict control on the interest ceilings for deposits as well as other aspects of the operations. On the other hand, interest charged for loans also depends on the market power of the bank and the demand for loans.
2.1.2. Capital adequacy
Capital adequacy has always been interpreted as an indicator of capital strength and it is widely accepted that banks possessing high levels of capital are financially strong. This consideration constitutes the basis for the Basel Capital Accord. As the ratio of equity to total assets increases, risk of insolvency decreases and parallel to this, cost of funding decreases. On the other hand, increases in equity may raise cost of equity due to the increase in the opportunity cost of capital. Moreover, the replacement of borrowing with equity causes the benefits from tax subsidy to decrease and this may cause an increase in the overall cost of funding. In most of the studies the relationship of capital structure with profitability is found positive, such as Bourke (1989), Demirgüç-Kunt and Huizinga (1999), Goddard et al. (2004), Kosmidou et al. (2005), Pasiouras and Kosmidou (2007), Athanasoglou et al. (2008), Flamini et al. (2009), Naceur and Omran (2011), Dietrich and Wanzenried (2011) Mirzaei and Mirzaei (2011). On the other hand, in Taskin (2011), the impact was insignificant on ROA but negative and highly significant on ROE. In Petria et al. (2015), the impact of this ratio on ROE was not statistically significant. In the case of ROA the relationship was positive and statistically significant but very weak.
2.1.3. Size
Size can be considered an important determinant of profitability. In some studies, it is represented by actual total assets, in others, natural logarithm of assets is used. The effect of size on profitability may vary. Increase in size can increase profitability due to economies of scale. On the other hand, increased size may cause externalities and thus have a negative effect on profitability. In Goddard et al. (2004), Sufian (2012) and Petria et al. (2015) the effect was positive and significant in the case of ROAE, positive but very small on ROAA, whereas in Sufian and Chong (2008)
and Athanasoglou et al. (2008), the effect of size was negative. In the study of Dietrich and Wanzenried (2011), where they used total assets as a proxy for size, the effect was negative. In Mirzaei and Mirzaei (2011) the impact was negative but highly insignificant.
2.1.4. Credit risk
Credit risk is an important source of risk in commercial banks and it is the only kind of risk investigated in prior research. Due to the difficulties encountered in finding a proxy, financial risks such as market and operational risks have not been integrated into the models. One of the most logical proxies for credit risk is the ratio of Loan Loss Provisions to Total Loans, as in Heffernan and Fu (2008), Sufian and Chong (2008) and in Mirzaei and Mirzaei (2011). The effect was negative as expected. Capraru and Ihnatov (2014) and Petria et al. (2015), used Impaired Loans to Total Loans ratio and both found a negative and significant impact on ROAE and a negative and smaller impact on ROAA. On the other hand, Atasoy (2007) used Loan Loss Provisions to Total Assets ratio and discovered a positive impact on ROA. According to Flamini et al. (2009), the ratio of Loans to Deposits and Short Term Funding, had a significant and positive effect on ROA. Naceur and Omran (2011), used total loans to assets ratio as a proxy for credit risk and found a positive and significant relationship. The positive effect is most probably due to the fact that loans constitute the primary income generating accounts within total assets. As long as they are collectible and there is sufficient margin between the lending and deposit rates, increase in loans are expected to increase profits. Moreover, the percentage of total loans among assets, can hardly be regarded as a proxy for credit risk.
2.1.5. Liquidity
Until the recent subprime loan crisis, the capital structure was considered the most important basis for the financial strength of a bank. To a great extent, this was due to the first and second Basel Capital Accords which emphasized the capital adequacy. The recent crisis proved that in the case of rapid downward market prices the standard approach regarding the amount of equity with respect to the market, credit and operational risks could not suffice in preventing insolvency. In Basel 3 (The 3rd International
Regulatory Framework for Banking) special emphasis has been placed on liquidity and two new measures have been introduced: Liquidity coverage and net stable funding ratios. The liquidity coverage ratio is equal to the ratio of high quality liquid assets to the liabilities to be paid within 30 days, and the net stable funding ratio is the ratio of available amount of stable funding to the amount of stable funding required.
In literature a number of proxies have been used for liquidity, the most common of which is the ratio of liquid assets to total assets, as in Kaya (2002), Dietrich and Wanzenried (2011), Alper and Anbar (2011), and Mirzaei and Mirzaei (2011). The level of liquid assets may be quite high but this fact does not guarantee that the short term payment requirements will be met. Therefore, the share of liquid assets within total assets cannot be regarded a trustworthy measure of liquidity. Due to the fact that liquid assets bring lower yields, a high share of these assets are expected to impact profitability negatively. A number of studies focused on liquidity risk. In the studies of Pasiouras and Kosmidou (2007), Alexiou
and Sofoklis (2009), Mirzaei and Mirzaei (2011), Capraru and Ihnatov (2014), and Petria et al. (2015), liquidity risk is measured as the ratio of loans to customer deposits. An increase in this ratio means an increase in the amount of loans with the same level of deposits. As a result of this, liquidity risk increases. There is an opposite relationship between liquidity and this ratio.
2.1.6. Other operating expenses
These expenses correspond to the operating expenses in a nonfinancial company, and in literature are often referred to as overhead costs or noninterest expenses. Operating expenses are grouped as general administrative, marketing, and research and development expenses. In a bank these expenses are comprised mostly of general administrative expenses which include rent of the bank offices, salaries and wages, internet and other communication fees, heating and lighting expenses etc. And marketing expenses. These expenses are controllable by management and are inversely related to bank profits. In literature, two different approaches are taken in analysing the effect of these expenses. The first approach is to take the ratio of these expenses to total assets as in Demirgüç-Kunt and Huizinga (1999), Staikouras and Wood (2004), Sufian and Chong (2008), Sufian (2011). Except Demirgüç-Kunt and Huizinga (1999), all the other authors found the impact negative.
The second approach is to take the ratio of these expenses to income, namely cost to income ratio, as in Pasiouras and Kosmidou (2007), Alexiou and Sofoklis (2009), Dietrich and Wanzenried (2011), Capraru and Ihnatov (2014), Petria et al. (2015), and Talu (2016). In all of these studies the effect of these expenses have been found statistically significant and negative. Since the aim is to search the impact of these expenses on profitability, it is more logical to use the ratio of these expenses to total operating income. Prior to the extensive use of computer systems and the internet, greater number of employees worked in bank departments. Thus, salaries and wages constituted a considerable part of overhead expenses. Due to this fact some authors used total employment costs as a proxy for overhead expenses i.e., Molyneux and Thornton (1992). They used staff expenses as a proxy for overhead expenses and found a strong and positive relationship between these expenses and before-tax ROA. Abreu and Mendez (2001) and Taskin (2011), also used staff expenses. Taskin (2011) found a negative relationship with ROA and ROE, whereas in Abreu and Mendez (2001), the effect on ROA and ROE was positive but statistically insignificant.
2.1.7. Noninterest revenues
Noninterest revenues consist of fees and commissions received for noncash loans and the services rendered by the bank. These constitute a very important element of operating revenues. Especially during times of narrow interest margin, banks rely heavily on this source to cover operating expenses. According to the income statement format determined by the BRSA, Operating Revenues of the bank are comprised of the sum of net interest revenues, net fees and commission revenues, dividend revenues and trading Income from capital market operations and trading gains on securities, foreign exchange transactions and gains or losses from derivate contracts. Fees and commission revenues are
presented as fees and commissions from noncash loans, and other fees and commissions. Noninterest income is comprised of trading income, dividend revenues and net fees and commissions revenues. Flamini et al. (2009) used the ratio of net interest revenues to other operating income as an indicator of diversification and found a negative and highly significant relationship with profitability. Sufian and Chong (2008), Sufian (2011), Sufian (2012), and Petria et al. (2015) used the ratio of noninterest income to total assets to test the impact of noninterest revenues and found a positive and significant relationship. The term “noninterest income or revenues“ is ambiguous and could be interpreted as encompassing all other revenues except interest. In reality it is not the case. The content of this term may change according to the format of the bank income statement determined by the banking authority of each country. This may create problems especially in cross country research. A variable must represent the same thing to the reader without regard to the local regulations. Being specific about the content of each variable is of great importance. In our opinion, it is not suitable to take the ratio net interest revenues to other operating income as a proxy for noninterest revenues as in the 2009 dated study of Flamini et al. Nevertheless, the incongruence of bank financial statements among the Sub-Saharan African Countries could have necessitated this approach.
2.2. Macroeconomic Determinants of Bank Profitability
External determinants of profitability are comprised of macroeconomic and industry-specific indicators which are outside the control of the management. Quite a number of macroeconomic factors have impact on bank profitability such as interest rates, inflation, money supply, and the growth rate of GDP. Nevertheless, the existence of multicollinearity among these indicators does not allow the inclusion of all of them in the models. The most commonly used indicators in literature are inflation or interest rate, and GDP growth.
2.2.1. Inflation/interest rate
Inflation affects the level of overhead costs, and the net interest revenues. As a result of inflation, cost of funding from local sources increases through higher deposit and credit rates. Banks using foreign credits from countries where the economy is stable and inflation is low may economize on borrowing rates in the short run. In the long run, higher inflation is reflected on the foreign credit rates through higher spreads to compensate for the increased country risk. The flexibility of the bank to adjust to the increases in inflation is important. Banks which are able to reflect the inflation premium on the loan rates, may not face decreases in the net interest revenues.
There is a controversy in the choice of inflation or interest rate as macroeconomic determinants. Since nominal interest rates include inflation premium, using interest rates as a variable seems more reasonable. Nevertheless, inflation is a widely used macroeconomic variable as evidenced in the works of Demirgüç-Kunt and Huizinga (1999), Abreu and Mendes (2001), Athanasoglu et al. (2008), Flamini et al. (2009), Sufian (2011), Naceur and Omran (2011), Mirzaei and Mirzaei (2011), Capraru
and Ihnatov (2014), and Petria et al. (2015). The impact of inflation on profitability was found positive in all of the above studies except for Mirzaei and Mirzaei (2011), Capraru and Ihnatov (2014), and Petria et al. (2015).
Demirgüç-Kunt and Huizinga (1999), used the short term government debt yield as a proxy for the real interest rate, besides inflation. Staikouras and Wood (2004) used the 3 – month interbank rate as a proxy for the level of interest rates and found a positive effect. Dietrich and Wanzenried (2011), used the difference between the interest rates of a 5 and a 2-year treasury bill and found a positive relationship.
2.2.2. GDP
Gross Domestic product is another variable common to most studies. Since GDP growth is the measure of growth in the economy, it is expected to have a positive impact on bank profitability. In literature, GDP is used in several forms, such as real GDP, growth in real GDP, lnGDP, percapita GDP and log of per capita GDP. Demirgüç-Kunt and Huizinga, in their 1999 dated article, used GDP per capita and growth in real GDP per capita as proxies for GDP and found that GDP per capita had a positive and significant effect on profitability, whereas the effect of the growth of GDP per capita was insignificant. The findings of Sufian (2012), Petria et al. (2015), are in line with Demirgüç-Kunt and Huizinga (1999). Staikouras and Wood (2004), found that the growth of GDP had a negative impact on bank profitability. Dietrich and Wanzenried (2011) and Capraru and Ihnatov (2014), assessed the effect of internal and external determinants of bank profitability before and during the crisis. Dietrich and Wanzenried (2011) found the impact of real GDP growth on bank profitability insignificant before the crisis but they did not use this variable in the model with crisis. Capraru and Ihnatov (2014) found the impact of GDP per capita growth on ROA and ROE insignificant during the crisis but positive and significant on ROA, and insignificant on ROE before the crisis.
3. DATA AND METHODOLOGY
The dataset of this study is comprised of the commercial banks on the BIST Banks Index during the period between the dates of 1 January 2005 and 30 September 2015. Out of the commercial banks, Tekstil Bank and Alternatif Bank have been omitted due
to incongruities caused by their minimal scale5. The 10 banks
included, comprise the 72.95% of the total banking sector of Turkey with respect to the asset size, as of the end of September 2015. The assets, equity, loans and deposits of these banks with respect to the sector are presented in Table 2.
A balanced panel data has been formed covering the 43 periods between the dates of January 2005 and September 2015. Each period is of 1-year length. The financial data used in the study have been computed from the quarterly unconsolidated financial statements of the banks. For each quarterly period, annual data has been computed starting from the beginning of the quarter in the prior year to the end of the corresponding quarter in the current year. E.g.; the period between the dates of 1 April, 2014 and 31 March, 2015. Income statement items have been computed by adding up the income or expenses in each quarter. Balance sheet items have been computed as the average of the totals of the 5 quarters marking the end and beginning of each quarterly period. Financial statements of the banks until 2009, have been obtained from the http://www.borsaistanbul.com/yatirimcilar/ mali-tablolar-arsiv and beginning with 2009, from http://www.kap. gov.tr addresses. Halkbank shares before being traded on BIST in 2007 have been taken from the official website of the bank. Information concerning macro indicators have been provided from the official websites of Central Bank of Turkey and the Undersecretariat of Treasury.
The names of the variables and the nominator and the denominator of the ratios used are the same as the items actually used on the financial statements in line with the international accounting standards. Each variable exactly stands for the factor for which it has been used as a proxy. Due to this fact there is no ambiguity about the variables used in this study.
The capital structure, asset and equity profitability of the Turkish commercial banks trading in BIST are presented in Table 3. 3.1. Definitions of Variables
Variables are comprised of dependent variables which represent bank profitability and the independent variables which are thought
5 Tekstil Bank and Alternative Bank comprise 0,21 and 0,59 % of the total banking sector.
Table 2: Share of the banks within the sector
Bank Year of foundation Assets (%) Total loans and receivables (%) Total deposits (%) Equity (%)
Türkiye iş Bankasi A.Ş. 1924 12.32 12.38 12.21 12.47
Türkiye Garanti Bankasi A.Ş. 1946 11.47 10.92 11.69 11.95
Akbank T.A.Ş. 1948 10.39 9.65 11.04 10.62
Yapı ve Kredi Bankası A.Ş. 1944 10.22 10.24 10.38 9.29
Türkiye Halk Bankası A.Ş. 1938 8.35 8.65 9.62 7.69
Türkiye Vakiflar Bankası T.A.O. 1954 8.31 8.56 8.81 6.71
Finans Bank A.Ş. 1987 3.98 3.91 3.82 3.78
Denizbank A.Ş. 1997 3.62 3.53 3.85 3.15
Türk Ekonomi Bankası A.Ş. 1927 3.24 3.68 3.51 2.79
Şekerbank T.A.Ş. 1953 1.05 1.13 1.17 1.03
Share of the 10 banks within the
sector 72.95 72.67 76.11 69.47
to be effective in determining bank profitability. A thorough examination of prior studies has been made in the determination of the variables.
3.1.1. Dependent variables
As dependent variables we used the ROA, computed as net income divided by average total assets and ROE computed as net income divided by the average equity.
3.1.2. Independent variables6
Independent variables represent factors which determine the profitability. In selecting these variables, prior studies and specific conditions which prevail in the Turkish banking sector and the economy have been taken into consideration. They are comprised of bank-specific variables which are computed using the data presented in the financial statements, and macroeconomic variables which represent economic indicators of the Turkish economy. The bank-specific variables used in this study are as follows: ILID: Interest revenue from loans/interest expense on deposits. Interest revenues, constitute the key portion of bank revenues. Among the interest revenues, interest received from loans have the greatest weight. Bank profits are comprised of net interest revenues, net fees and commission revenues, dividend revenues and the profit and loss from the trading operations. Net interest revenues is the difference between interest revenues and interest expenses. Interest received from loans constitute the major portion of interest revenues and similarly interest incurred on deposits constitute the major portion of interest expenses. In our opinion, the interest expense coverage function of interest revenues is more meaningful than their percentage to total assets in determining bank profits. In consideration of this fact, we used the ratio of interest revenue from loans to interest expense on deposits (ILID), as a proxy for NIM, which is computed as the ratio of net interest revenues to total assets. ILID is first used in literature in Topak and Talu (2016) and we consider it a contribution. The expected impact of this variable is positive.
FCE: Net fees and commissions revenues/total expenses. The next important source of income is fees and commissions which include the commissions received from noncash loans and fees received in return for the services rendered. It is important to note that these revenues do not represent noninterest income,
6 In this section, ratios related to bank-specific variables calculated by the authors using the statistical reports of The Banks Association of Turkey, Electronically available from: https://www.tbb.org.tr/tr/bankacilik/banka-ve-sektor-bilgileri/istatistiki-raporlar/59
due to the fact that noninterest income is comprised of the sum of dividend revenues and trading revenues besides fees and commission revenues. In reality the share of net fees and commissions is equal to the 11.37% of total gross revenues of the banks in the BIST Index as of 2015, whereas the share of total noninterest revenues is 16.21%. These revenues can be crucial in covering the expenses, especially during periods of narrow interest margin. The fact that as of 31 December 2015, net fees and commissions revenues cover 15.42% of total gross expenses and 43.90% of other operating expenses, proves the importance of their contribution. As a proxy for these revenues, we used the ratio of net fees and commissions revenues to total expenses (FCE). In literature the effect of net fees and commissions revenues have not been used by themselves as an independent variable. Sufian and Chong (2008), Sufian (2011), Sufian (2012), and Petria et al. (2015) used the ratio of noninterest income to total assets to test the impact of noninterest revenues. In the discussions in the literature section, we mentioned the ambiguity caused by the use of the term noninterest revenues. In the above studies noninterest revenues are divided by total assets, which in our regard does not yield any information with respect to expense coverage. Due to this fact we used the ratio of fees and commissions revenues to total expenses which exists in no other study in literature. This is another contribution of this study.
OEI: Other Operating expenses/total operating revenues. Other operating expenses are expenses which do not result from banking operations but incurred in the operations of any company, namely expenses comprising of general administrative and marketing expenses in nonfinancial firms. These are important in the determination of bank profits. While interest expenses are uncontrollable by the bank management, it is possible to economize on operating expenses and increase profits. An increase in the ratio of these expenses to total operating revenues means that a greater share of operating revenues is consumed by these expenses resulting a decrease in profits. As of the end of December 2015, the ratio of other operating expenses to total operating revenues of the banks on the BIST Index, is 25.90%. This means that more than ¼th of total revenues are consumed by
these expenses. As a proxy for these expenses, the ratio of other operating expenses to total operating income (OEI) is used. The expected impact on profitability of this variable is negative. NPL: Nonperforming loans/total loans and receivables.
While net interest revenues usually comprise the greatest portion of the operating profits, they are in the form of revenue accruals. Collectability of loans and their accrued interests is essential in the realization of these revenues. Uncollectible loans and revenues
Table 3: The capital structure, asset and equity profitability of the Turkish commercial banks trading in BIST
Ratio 2015 2014 2013 2012 2011 2010 2009 2008 2007 2006 2005 2004
Equity / Assets 10.9 11.2 10.9 12.9 11.4 12.9 12.4 10.7 12.2 10.9 12.2 15.0 Net Income / Assets 1.1 1.3 1.6 1.8 1.8 2.3 2.4 1.7 2.5 2.1 0.7 1.9 Net Income / Equity 10.1 11.6 14.3 14.2 16.0 18.0 19.4 16.1 20.5 19.0 5.5 12.4
are reported in the non-performing loans account. Increases in the share of uncollectible loans to total loans decreases profits. On the bank balance sheet, loans are presented as loans and receivables. Being faithful to the official terminology we used the ratio of nonperforming loans to total loans and receivables as a proxy for credit risk. As of 31, December 2015, the share of nonperforming loans of the banks on the BIST index among total loans and receivables is 3.40%.
ESA: Stockholders’ equity/total assets.
As a proxy for capital adequacy we used the ratio of equity to total assets parallel to the literature. The view that well capitalized banks are protected against the risk of bankruptcy is widely shared in literature. Nevertheless, the latest financial crisis proved that mere capital adequacy cannot be sufficient in saving the bank in the case of liquidity deficit. The effect of the share of equity within the total sources on profitability is twofold: (1) Due to the perception of safety, an increase in capital may lower the cost of borrowing of the bank; thus, help to increase the NIM. As a result of lower cost of borrowing, banks may be able to lower loan rates and increase the amount of loans. In this respect, a positive impact on profitability is expected, (2) since cost of equity is higher than cost of borrowing, increases in equity beyond the point of safety, increase the marginal and the opportunity cost of capital, and thus, cause a decline in profitability. As a result of these considerations our expectation for the impact of capital adequacy is not definite. SIZE: Total assets of the bank/total assets of the banking sector. Size is represented by total assets. In literature it is sometimes proxied by the natural logarithm of total assets. Market share of a bank in the sector is measured as the ratio of the assets of the individual bank to the total assets of the sector. An increase in the market share of the bank may increase the profitability due to economies of scale but after a certain size, diseconomies occur and profitability decreases. As a proxy for relative size we used the ratio of the total assets to the total assets of the sample banks in the sector. The expected impact can be negative or positive. After a series of trials with indicators i.e. inflation rate, ratio of the current account balance to GDP, ratio of the budget balance to GDP, and the ratio of the M2 money supply to GDP, considered to be effective in explaining the bank profitability, we ended up with the following macroeconomic variables.
GDP: Annual real GDP growth rate.
Annual percentage growth rate of GDP at market prices based on constant local currency. The expected impact is positive.
INT: Benchmark interest rate.
The benchmark or base interest rate which is the minimum rate required by the investors for a treasury debt instrument. In general, this is equal to the yield of the most recent on-the-run treasury security. The expected impact is indeterminate.
EXCR: Exchange Rate Basket Consisting of 50% USD and 50% EURO.
Exchange rate is not a common macroeconomic indicator in literature, however, banks have foreign exchange assets and liabilities of different maturities which affect profitability. Assets and liabilities may be denominated in different exchange rates and the due to the parity between the foreign exchanges profit or loss occurs. Foreign exchange assets and liabilities are common in the Turkish banking system and they are reported in the financial statements. As of 31 December 2015, foreign assets of the banks in the BIST comprised 39% of the total assets and the share of foreign liabilities was 45%, which indicates that there is a foreign exchange gap in the BIST banks as of the end of 2015. Depending on the parity between the foreign exchange denomination of the assets and the liabilities this could result in a steep fall in profits. It is undoubtable that in economies where the floating exchange rate parity is exercized the exchange rate parity presents exchange rate risk. Turkey has implemented the policy of floating exchange rate since the 1980s. In economies marked with high inflation, foreign exchange is often used as a means of investment. In view of these facts, we used exchange rate as an independent variable in this study. This variable has not been used in literature. This is another contribution of this study. Our expectation with regard to the impact of exchange rate is negative.
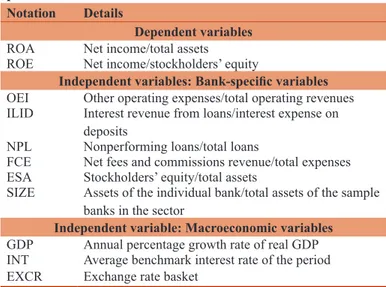
The dependent and independent variables used in this study are presented in Table 4.
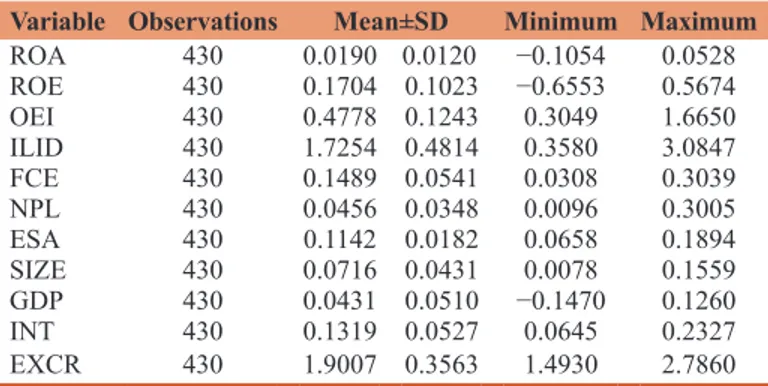
Summary statistics of variables are presented in Table 5. The average annual ROA of the sample banks over the period January 2005-September 2015 is 1.90% and the ROE is 17.04%.
3.2. Empirical Methodology
In this study we attempt to determine the bank-specific and macroeconomic determinants of commercial banks profitability by panel data analysis. Models have been formed with ROA and ROE as dependent and the bank-specific and the macroeconomic variables as independent variables. During this process it has
Table 4: The variables used in the determination of bank performance
Notation Details
Dependent variables
ROA Net income/total assets ROE Net income/stockholders’ equity
Independent variables: Bank‑specific variables
OEI Other operating expenses/total operating revenues ILID Interest revenue from loans/interest expense on
deposits
NPL Nonperforming loans/total loans
FCE Net fees and commissions revenue/total expenses ESA Stockholders’ equity/total assets
SIZE Assets of the individual bank/total assets of the sample banks in the sector
Independent variable: Macroeconomic variables
GDP Annual percentage growth rate of real GDP INT Average benchmark interest rate of the period EXCR Exchange rate basket
been discovered that there is multicollinearity between OEI with the other bank-specific variables. Due to this fact, OEI has been removed from the equations with other bank-specific variables.
ROAit = + ILIDit+ FCEit+ NPLit+ ESAit
+
10 11 12 13 14
1
55SIZEit+16GDPit+17INTit+18EXCRit+u1it (1)
ROEit = + ILIDit+ FCEit+ NPLit+ ESAit
+
β30 β31 β32 β33 β34
ββ35SIZE β36GDP β37INT β38EXCR u3
it+ it+ it+ it+ it (2) Considering that OEI is a very important determinant of profitability, we have built two additional models with ROA and ROE as dependent variables and OEI and macroeconomic variables as independent variables.
ROAit =20+21OEIit+22GDPit+23INT +24EXCRit+u2it
(3)
ROEit =40+41OEIit+42GDPit+43INTit+44EXCRit+u4it
(4) To determine the most appropriate model, various tests have been made to detect the existence of individual and/or time effects for each equation. The outcome of the LR tests used for this purpose are presented in Table 6.
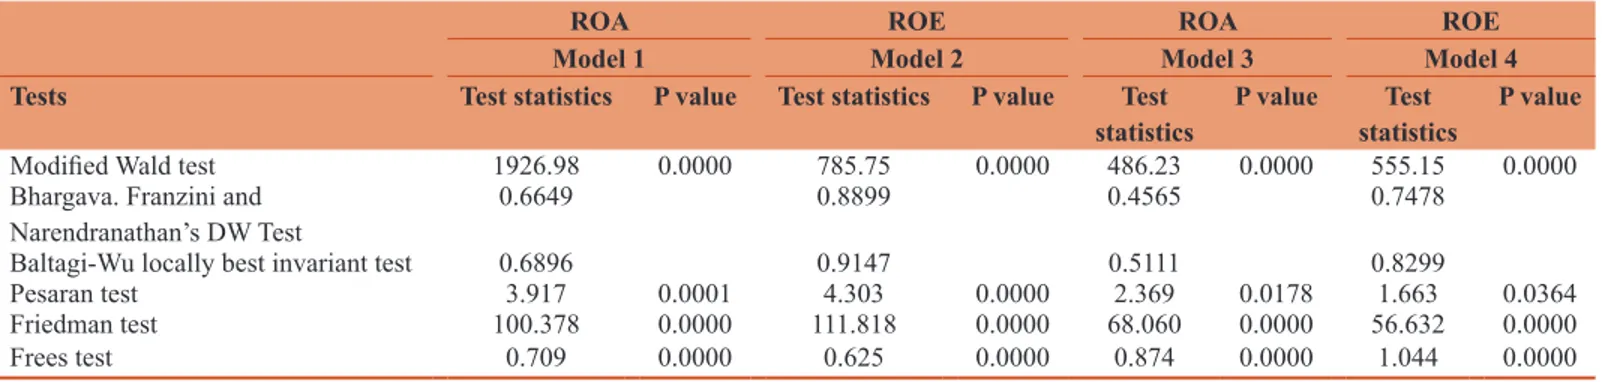
According to the results of the LR tests, in each of the four equations there is individual effect. To determine whether the individual effect is random or fixed, Hausman Test has to be employed. The results of the Hausman test are presented in Table 7. According to the results of Hausman test, for all models with ROA and ROE as dependent variables fixed effects model has to be used. Panel data models are based on the assumption that, error terms have the same variances between and across individuals (homoscedasticity), and there is no autocorrelation and cross - sectional dependence in the models (Tatoğlu, 2012). In view of this fact, the models formed should be tested for autocorrelation, heteroscedasticity across individuals, and cross sectional dependence between them. In the case of any deviations detected, other suitable methods should be used in estimating the models. The test of the deviations from the assumptions are presented in Table 8.
In modified Wald test, the null hypothesis stated that there is no heteroscedasticity. The existence of autocorrelation in the models has been tested by Panel Durbin Watson Test, suggested by Bhargava at al. (1982), and Local Best Invariant Test, suggested by Baltagi and Wu (1999). The fact that the statistics of both tests are less than the critical value 2, indicates that the null hypothesis that the coefficient of autocorrelation is equal to zero has been rejected. Cross Sectional Dependence has been examined using tests developed by Friedman (1937), Frees (1995) and Pesaran (2004). The null hypothesis of these tests states that there is no cross sectional correlation. As a result of the tests applied, the existence of autocorrelation,
heteroscedasticity and cross sectional correlation has been accepted. These problems do not have any effect on the unbiasedness of parameter estimators, but result in loss of efficiency. In view of this fact, in all the models with ROA and ROE as dependent variables, final models have been determined by using Driscoll and Kraay standard errors.
3.3. Empirical Findings
The results of the final models for the commercial banks whose shares are traded in the BIST between the years of 2005 and 2015 are presented in Table 9.
According to the final results presented in Table 9, in all the 4 models, the F test which produces the general results for models is significant within the 95% confidence interval.
Table 5: Summary statistics of variables
Variable Observations Mean±SD Minimum Maximum
ROA 430 0.0190 0.0120 −0.1054 0.0528 ROE 430 0.1704 0.1023 −0.6553 0.5674 OEI 430 0.4778 0.1243 0.3049 1.6650 ILID 430 1.7254 0.4814 0.3580 3.0847 FCE 430 0.1489 0.0541 0.0308 0.3039 NPL 430 0.0456 0.0348 0.0096 0.3005 ESA 430 0.1142 0.0182 0.0658 0.1894 SIZE 430 0.0716 0.0431 0.0078 0.1559 GDP 430 0.0431 0.0510 −0.1470 0.1260 INT 430 0.1319 0.0527 0.0645 0.2327 EXCR 430 1.9007 0.3563 1.4930 2.7860 SD: Standard deviation
Table 6: Comparing the models: Tests and results
Segment A: LR Test: Individual and time effects H0: σσ2µµi==σσλλ2t ==0 Dependent variable Models Test statistics P value
ROA Model 1 123.20 0.0000
ROE Model 2 110.91 0.0000
ROA Model 3 242.94 0.0000
ROE Model 4 136.91 0.0000
Segment B: LR Test: Individual effects H0 i
2 0
: σσµµ ==
Dependent variable Models Test statistics P value
ROA Model 1 120.96 0.0000
ROE Model 2 104.98 0.0000
ROA Model 3 237.40 0.0000
ROE Model 4 134.00 0.0000
Segment C: LR Test: Time effects H0: σσ2λλt ==0
Dependent variable Models Test statistics P value
ROA Model 1 0.00 1.0000
ROE Model 2 0.76 0.1919
ROA Model 3 0.00 1.0000
ROE Model 4 0.08 0.3873
Table 7: Hausman tests results H E X0: ( it iµµ ==) 0)
Dependent variable Models Test statistics P value
ROA Model 1 28.76 0.0003
ROE Model 2 19.58 0.0120
ROA Model 3 21.66 0.0000
3.3.1. Interpretation of Models 1 and 2.
Both models 1 and 2 have the same independent variables. The dependent variable of Model 1 is ROA, and the dependent variable of Model 2 is ROE. Independent variables explain the 31% of the changes in ROA, and 38% of the changes in ROE.
All of the independent variables in Models 1 and 2 are significant within 95% confidence interval. While increases in bank-specific variables such as ILID, FCE and SIZE positively impact ROA and ROE in line with our expectations and literature, increases in NPL and ESA have negative impact.
ILID has been used as a proxy for NIM as the primary constituent of bank income. NIM has been used in literature mostly as a dependent variable as in Demirgüç-Kunt and Huizinga (1999), Atasoy (2007), Taskin (2011) and Capraru and Ihnatov (2014), Naceur and Omran (2011). As a dependent variable, neither NIM, nor any proxy for it, has been used except Dietrich and Wanzenried (2011) where the ratio of interest income to total income (interest income share) and Topak and Talu (2016) where the ratio of interest revenue from loans to interest expense on deposits (ILID) are used respectively. Since the share of net interest revenues in the total operating income, NIM or a proxy for it, should be used as a dependent variable in order to determine the factors which affect bank profitability. In this respect, using ILID is the contribution of this study.
In the case of Fees and Commissions Revenues, our study is unique due to the fact that these revenues have been related to the total
operating expenses rather than total assets and total revenues. In taking the total operating expenses in the denominator our aim was to discover the contribution of fees and commissions revenues in covering the total expenses. When either assets or total revenues are used in the denominator, it is not possible to detect the benefit of these revenues. This is our second contribution to literature. Sufian and Chong (2008), Sufian (2011), Sufian (2012), and Petria et al. (2015) used the ratio of noninterest income to total assets and found a positive and significant relationship. This result is similar to ours except the denominator of the variable in our study is total expenses. Flamini et al. (2009) used the ratio of net interest revenues to other operating income as an indicator of diversification and found a negative and highly significant relationship with profitability.
The effect of NPL is negative as expected and in line with Heffernan and Fu (2008), Sufian and Chong (2008) and in Mirzaei and Mirzaei (2011), Capraru and Ihnatov (2014) and Petria et al. (2015). On the other hand, Atasoy (2007) used loan loss provisions to total assets ratio and discovered a positive impact on ROA. Some authors have used different proxies for credit risk. Flamini et al. (2009) used the ratio of loans to deposits and short term funding, and Naceur and Omran (2011) used total loans to assets ratio and stated that a positive and significant relationship was discovered between credit risk and profitability. The positive effect is most probably due to the fact that loans constitute the primary income generating assets. In the case of capital adequacy our finding is contrary to the results of Bourke (1989), Demirgüç-Kunt and Huizinga (1999), Goddard
Table 9: The results of regression equations with driscroll‑kraay standard errors
Dependent variables ROA ROE ROA ROE
Independent variables Model 1 Model 2 Model 3 Model 4
Bank‑specific variables Co‑efficient P Co‑efficient P Co‑efficient P Co‑efficient P
ILID 0.0044 0.050 0.0395 0.042 FCE 0.1221 0.028 0.9198 0.034 NPL −0.0492 0.049 −0.4371 0.045 ESA −0,1862 0,022 −2,7676 0,000 SIZE 0.4319 0.011 3,0574 0.035 OEI −0.1056 0.000 −0.8157 0.000 Macroeconomic variables GDP 0.0243 0.025 0.2435 0.015 0.0221 0.008 0.1769 0.047 INT 0.0781 0.010 0.7277 0.013 0.0462 0.013 0.5957 0.010 EXCR −0.0123 0.000 −0.1044 0.000 −0.0029 0.043 −0.0102 0.485 F test 29.98 0.000 32.11 0.000 119.36 0.000 68.56 0.000 R2 0.3071 0.3791 0.8157 0.6741
Table 8: Tests: Heteroscedasticity, autocorrelation and cross‑section dependence
ROA ROE ROA ROE
Model 1 Model 2 Model 3 Model 4
Tests Test statistics P value Test statistics P value Test
statistics P value statisticsTest P value
Modified Wald test 1926.98 0.0000 785.75 0.0000 486.23 0.0000 555.15 0.0000 Bhargava. Franzini and
Narendranathan’s DW Test 0.6649 0.8899 0.4565 0.7478
Baltagi-Wu locally best invariant test 0.6896 0.9147 0.5111 0.8299
Pesaran test 3.917 0.0001 4.303 0.0000 2.369 0.0178 1.663 0.0364 Friedman test 100.378 0.0000 111.818 0.0000 68.060 0.0000 56.632 0.0000 Frees test 0.709 0.0000 0.625 0.0000 0.874 0.0000 1.044 0.0000
et al. (2004), Kosmidou et al. (2005), Pasiouras and Kosmidou (2007), Athanasoglu et al. (2008), Flamini et al. (2009), Dietrich and Wanzenried (2011), Naceur and Omran (2011), Mizraei and Mirzaei (2011) with the exception of Taskin (2011) and Petria et. al. (2015) and Topak and Talu (2016). Taskin (2011) found the impact on ROA insignificant but, on ROE negative and highly significant. Petria et al. (2015), and Topak and Talu (2016), found the impact on ROA positive and significant, but, on ROE insignificant. The view that increases in equity causes a decline in profitability through lower deposit rates is not valid in the Turkish banking sector. Following the bank failures at the end of 1990s, and the beginning of 2000s, BRSA has been applying strict controls on the banking activities and requires the lower limit for the capital adequacy ratio to be 12%. Moreover, in order to prevent deposit withdrawals from banks, the practice of deposit insurance has been brought. The coverage was as high as 100% during the first years of 2000s. Even though Turkish depositors are well aware of the fact that some banks may not be safe, due to the trust BRSA has created through higher capital requirement, and the protection of the deposit insurance, they are not willing to accept lower deposit rates for safety reasons. Therefore, increases in equity would not cause a decrease in the deposit rates and thus increase profitability.
With respect to SIZE, our results are in line with Goddard et al. (2004), Sufian (2012) and Petria et al. (2015) and contrary to Sufian and Chong (2008), Athanasoglu et al. (2008), Dietrich and Wanzenried (2011), Mirzaei and Mirzaei (2011).
In the case of macroeconomic variables, increases in GDP and INT positively impact ROA and ROE, whereas increases in EXCR has a negative impact. GDP growth has a positive significant impact on profitability parallel to the expectations. This result is in line with, Demirguc-Kunt and Huizinga (1999), Sufian (2012), Petria et al. (2015). Interest rate proved to be an important determinant of profitability with a significant and positive sign. An increase of 1% INT, produced an increase of 0.0781% in ROA and 0.7277% increase in ROE in line with Staikouras and Wood (2004) and Dietrich and Wanzenried (2011). Due to the negative net foreign currency position of the Turkish commercial banks, 1% increase in EXCR, results in a 0.0123% decrease in ROA and 0.1044% decrease in ROE. This result is in line with our expectations. 3.3.2. Interpretation of Models 3 and 4
The dependent variable of Model 3 is ROA, and the dependent variable of Model 4 is ROE. Explanatory variables in both models are the ratio of Other Operating Expenses to Total Operating Revenues and macroeconomic variables.
As a result of the regressions carried out, it is found that the independent variables explain approximately 81% of the changes in ROA, and 67% of the changes in ROE. All of the independent variables except EXCR in Model 4, are significant within the 95% confidence interval. Among the independent variables only OEI, has a very significant negative impact on both ROA and ROE. An increase of 1% in OEI produces a decrease of 0.1056% in ROA and 0.8157% decrease in ROE. Our results are in line with Pasiouras and Kosmidou (2007), Alexiou and Sofoklis (2009),
Dietrich and Wanzenried (2011), Capraru and Ihnatov (2014), Petria et al. (2015), Topak and Talu (2016).
With respect to macroeconomic variables, the impact of GDP and INT is positive on ROA and ROE as expected and consistent with the results of Models 1 and 2, whereas EXCR has a negative impact on ROA but is not significant in explaining ROE. In the case of EXCR the results are slightly different. The impact of the exchange rate on ROA is negative as in Model 1 whereas the impact on ROE is insignificant.
4. CONCLUSIONS
In this study we searched for the bank-specific and macroeconomic determinants of commercial bank profitability in Turkey over the period of 2005-2015/Q3. We used a balanced panel comprised of 10 commercial banks on the BIST Banks Index, covering 43 periods. The financial data used in the study have been computed from the quarterly unconsolidated financial statements of the banks. Each period is of 1-year length. According to the empirical results, bank-specific variables such as, the ratio of interest on loans to the interest on deposits (ILID), used as a proxy for NIM, the ratio of net fees and commissions revenues to total operating expenses (FCE), and relative size (SIZE) have positive and significant impact on profitability represented by ROA and ROE. On the other hand, the ratio of other operating expenses to total operating revenues (EI), the ratio of nonperforming loans to total loans (NPL) used as a proxy for credit risk, and capital adequacy (ESA), are negatively related to profitability. These results are consistent with our expectations.
The fact that the R-squared values in Models 3 and 4 are considerably higher than those in Models 1 and 2, indicates that OEI which is the ratio of other operating expenses to the total operating revenues is more effective than other bank-specific variables in determining bank profitability. This finding is consistent with the fact that since banks are limited in the determination of interest rates, economising on the operating expenses is a more feasible instrument in increasing the profits. With respect to macroeconomic variables, real GDP and interest rate have positive impact on profitability whereas the exchange rate has a negative impact. This result is also in line with our expectations.
REFERENCES
Abreu, M., Mendes, V. (2001), Commercial bank interest margins and profitability: Evidence for some EU countries. In: Pan-European Conference Jointly Organised by the IEFS-UK & University of Macedonia Economic & Social Sciences, Thessaloniki, Greece, May. p17-20.
Alexiou, C., Sofoklis, V. (2009), Determinants of bank profitability: Evidence from the Greek banking sector. Economic Annals, 54(182), 93-118.
Alper, D., Anbar, A. (2011), Bank specific and macroeconomic determinants of commercial bank profitability: Empirical evidence from Turkey. Business and Economic Research Journal, 2(2), 139-152.
Atasoy, H. (2007), Türk Bankacılık Sektöründe Gelir-Gider Analizi ve Kârlılık Performansının Belirleyicileri. Türkiye Cumhuriyet Merkez Bankası, Uzmanlık Yeterlilik Tezi, Ankara.
Athanasoglou, P., Delis, M., Staikouras, C. (2006), Determinants of Bank Profitability in the Southern Eastern European Region. Munich Personal RePEc Archive.
Athanasoglou, P.P., Brissimis, S.N., Delis, M.D. (2008), Bank-specific, industry-specific and macroeconomic determinants of bank profitability. Journal of International Financial Markets, Institutions and Money, 18(2), 121-136.
Baltagi, B.H., Wu, P.X. (1999), Unequally spaced panel data regressions with AR (1) disturbances. Econometric Theory, 15(06), 814-823. Banks Association of Turkey, Statistical Report, Electronically. Available
from: https://www.tbb.org.tr/en/banks-and-banking-sector-information/statistical-reports/20.
Bhargava, A., Franzini, L., Narendranathan, W. (1982), Serial correlation and the fixed effects model. The Review of Economic Studies, 49(4), 533-549.
Bourke, P. (1989), Concentration and other determinants of bank profitability in Europe, North America and Australia. Journal of Banking and Finance, 13(1), 65-79.
BRSA. (2002), Banking Sector Restructuring Program Progress Report (V). Ankara: BDDK.
Capraru, B., Ihnatov, I. (2014), Banks’ profitability in selected central and Eastern European countries. Procedia Economics and Finance, 16, 587-591.
Demirgüç-Kunt, A., Huizinga, H. (1999), Determinants of commercial bank interest margins and profitability: Some international evidence. The World Bank Economic Review, 13(2), 379-408.
Dietrich, A., Wanzenried, G. (2011), Determinants of bank profitability before and during the crisis: Evidence from Switzerland. Journal of International Financial Markets, Institutions and Money, 21(3), 307-327.
Flamini, V., Schumacher, M.L., McDonald, M.C.A. (2009), The Determinants of Commercial Bank Profitability in Sub-Saharan Africa (No. 9-15). International Monetary Fund.
Frees, E.W. (1995), Assessing cross-sectional correlation in panel data. Journal of Econometrics, 69(2), 393-414.
Friedman, M. (1937), The use of ranks to avoid the assumption of normality implicit in the analysis of variance. Journal of the American Statistical Association, 32(200), 675-701.
Goddard, J., Molyneux, P., Wilson, J.O. (2004), The profitability of European banks: A cross sectional and dynamic panel analysis. The Manchester School, 72(3), 363-381.
Heffernan, S., Fu, M. (2008), The Determinants of Bank Performance in China. EMG Working Paper Series No. 03.
Kaya, T.Y. (2002), Determinants of Profitability in Turkish Banking
Sector. Turkish Banking Regulation and Supervision Agency No. 1. Kosmidou, K., Tanna, S., Pasiouras, F. (2005), Determinants of
profitability of domestic UK commercial banks: Panel evidence from the period 1995-2002. In: Money Macro and Finance (MMF) Research Group Conference. Vol. 45. p1-27.
Mirzaei, A., Mirzaei, Z. (2011), Bank-specific and macroeconomic determinants of profitability in Middle Eastern banking. Iranian Economic Review, 15(29), 101-128.
Molyneux, P., Thornton, J. (1992), Determinants of European bank profitability: A note. Journal of Banking and Finance, 16(6), 1173-1178.
Naceur, S.B., Omran, M. (2011), The effects of bank regulations, competition, and financial reforms on banks’ performance. Emerging Markets Review, 12(1), 1-20.
Pasiouras, F., Kosmidou, K. (2007), Factors influencing the profitability of domestic and foreign commercial banks in the European Union. Research in International Business and Finance, 21(2), 222-237. Pesaran, M.H. (2004), General Diagnostic Tests for Cross Section
Dependence in Panels, Cambridge Working Papers in Economics No:0435, Faculty of Economics, University of Cambridge. Petria, N., Capraru, B., Ihnatov, I. (2015), Determinants of banks’
profitability: Evidence from EU 27 banking systems. Procedia Economics and Finance, 20, 518-524.
Staikouras, C.K., Wood, G.E. (2004), The determinants of European bank profitability. International Business and Economics Research Journal, 3, 57-68.
Sufian, F. (2011), Profitability of the Korean banking sector: Panel evidence on bank-specific and macroeconomic determinants. Journal of Economics and Management, 7(1), 43-72.
Sufian, F. (2012), Determinants of bank profitability in developing economies: Empirical evidence from the South Asian banking sectors. Contemporary South Asia, 20(3), 375-399.
Sufian, F., Chong, R.R. (2008), Determinants of bank profitability in a developing economy: Empirical evidence from the Philippines. Asian Academy of Management Journal of Accounting and Finance, 4(2), 91-112.
Taskin, F.D. (2011), Türkiye’de ticari bankalarin performansini etkileyen faktörler/the factors affecting the performance of the Turkish commercial banks. Ege Akademik Bakis, 11(2), 289.
Tatoğlu, F.Y. (2012), Panel Veri Ekonometrisi. İstanbul: Beta Yayınevi. Topak, M.S., Talu, N.H. (2016), Internal determinants of bank
profitability: Evidience from turkish banking sector. International Journal of Economic Perspectives, 10(1), 37.
Tunay, K.B., Silpar, M.A. (2006), Performance Analysis Based on Profitability in Turkish Banking Sector. Banks Association of Turkey, Research Papers, (2006-I).