1
Dokuz Eylül Üniversitesi Denizcilik Fakültesi Dergisi
Cilt: 4 Sayı: 2 2012
ANALYSIS OF SHIP ACCIDENTS IN THE STRAIT OF İSTANBUL Nur Jale ECE1
ABSTRACT
This paper attempts to analyze the accidents occured in The Strait of İstanbul during the “right-side up” scheme period 1982-2010 by using the statistical methods as like frequency distribution, Chi Square (χ2) Analysis to purpose further required measurements to ensure safety navigation and environment in the Strait of İstanbul. This paper’s findings consist of the following: (i) collisions were the most common type of accident in the Strait of İstanbul respectively groundings; (ii) the most of the accidents are attributed to human error; (iii) the Strait of İstanbul faced the most ship accidents in the First Zone (Haydarpaşa-Eminönü and Ortaköy-Çengelköy); (iv) the most number of accidents occurred between the years 1982-1993 before the The Maritime Traffic Regulations have been implemented; (v) the least number of accidents occurred after the implementation of the Vessel Traffic Services (VTS) in 2004; (vi) there is a statistical relationship between type of the accident and reason and zone of accident; type of ship and type of accident; ship flag and and zone of accident.
Keywords: The Strait of İstanbul, ship accident, accident analysis.
İSTANBUL BOĞAZI’NDA MEYDANA GELEN DENİZ KAZALARININ ANALİZİ
ÖZET
Bu makalede İstanbul Boğazı’nda seyir emniyeti ve çevre güvenliğini sağlamak için alınan tedbirlere ilaveten öneriler yapmak amacıyla İstanbul Boğazı’nda “Sağ Şerit Düzeni”nin uygulanmaya başladığı 1982 yılından 2010 yılına kadar meydana gelen kazaların frekans dağılımı, Ki-Kare (χ2) İlişki Testi gibi istatistiksel analizleri yapılmıştır. Söz konusu analiz sonuçlarından elde edilen bulgulardan şu sonuçlar çıkarılmıştır: (i) İstanbul Boğazı’nda en fazla kaza türü çatışma daha sonra karaya oturmadır; (ii) En fazla kaza insan hatası nedeniyle meydana gelmiştir; (iii) İstanbul Boğazı’nda en fazla kaza I. Bölgede (Haydarpaşa-Eminönü and Ortaköy-Çengelköy) meydana gelmiştir; (iv) En fazla kaza “Türk Boğazları Tüzüğü”nün uygulanmaya başlanmasından önce 1982-1993 yılları arasında meydana gelmiştir; (v) En az kaza “Gemi Trafik Hizmetleri (VTS)’nin 2004 yılında uygulanmaya başlanmasından sonra meydana gelmiştir; (vi) Kaza türü ile kaza
1 Dr., Prime Ministry of Republic of Turkey, Privatization Administration, Gazi University,
2
nedeni ve kaza bölgesi, gemi türü ile kaza türü ve gemi bayrağı ile kaza bölgesi arasında istatistiksel olarak anlamlı bir ilişki vardır.
Anahtar Kelimeler: İstanbul Boğazı, gemi kazası, kaza analizi. 1. INTRODUCTION
Shipping accident is a term generally used for any accident results in human casulty, property damage, enviromental damage and oil pollution, financial loss and traffic effectiveness (Akten, 2006: 269-304). The Strait of İstanbul which links the Black Sea to the Sea of Marmara is one of the most congested and risky waterway in the world to navigate. It also holds a strategic importance for States of Black Sea.
The Strait of İstanbul is 31 km long, 1,6 km wide and maximum depth being 110 m (Başar et al. 2006: 388-390). The Strait links the Black Sea to the Sea of Marmara. Geographical conditions and navigational constraints of the Strait, i.e. narrowness, deep, currents which varies between 0.5-4.8 knots and bad wheather conditions constitute the main parameters contributing to marine accidents in the Strait of İstanbul. Flow through the strait is one of the important events fort the passage of the vessel. Flow of the upper part of the Strait opposite for the lower part of the Strait (Yurtören, 2004).
The growing number of ships carrying dangerous cargo has become a serious threat to safety of navigation as well as human and environmental safety. The Strait of İstanbul takes several sharp turns and the ships are bound alter course at least 12 times at these bends. The current can reach 7-8 knots at this point. In the Strait visibility is restricted for several meteorological factors such as heavy rain, snow and fog and strong winds.The ships approaching from the opposite direction can not be seen round these bends (Akten, 2003: 241). The Strait has a risk from the point of view of maintaining a safety navigation expecially at night (Chapman and Akten, 1998: 6-8; Akten, 2004: 345-356). Turkish Straits is also a biological corridor serving for the penetration of Atlantic-Mediterranean fishes to the Black Sea. The Strait is also a passage for dolphins that were included in the list of protected wild life during the 8th conference of Convention on Migratory Species of United Nations environment program (UNEP/CMS) held in Nairobi (UN) (CMS, 2005). The Strait of İstanbul also possess valuable historical and cultural qualities.
There were a total of, nearly 54 000 direct passing nearly 9 500 of which are tankers in a year, navigating the Strait. On a monthly basis an average 5 000 vessels, on a daily basis, an average of 150 vessels navigated the strait. Nearly 145 millon tons of dangerous cargo annualy and more than 2,1 million barrels of oil every day passed through the Turkish Straits (Denizhaber, 2009). The traffic in Strait of İstanbul of safe passage has exceeded the limits for safety passage; moreover, the traffic in this area, especially the tanker traffic, is expected to
3
increase in accordance with the developments in technology, increasing significance of the Black Sea as an important direct passing corridor between east and west for oil and natural gas transportation. The growing number of the ships carrying dangerous cargo and the amount of the dangerous cargo has become a serious threat to safety of navigation as well as human and environmental safety. Accidents, which may occur, especially from tanker traffic, could create acute situations for the area, including the suspension of the Strait of İstanbul traffic.
The objective of this paper is to analyze ship accidents occured in the Strait of İstanbul during the “right-side up” scheme period 1982-2010 and provide further required measurements and suggestions to ensure safety navigation and environment in the Strait of İstanbul. The paper is organized as follows: The second section consists of literature review, the third section is a review of maritime traffic; the fourth section performs data collection and data analysis based on Frequency Distribution and Chi Square Test and the final section offers a number of conclusions and provides suggestions for the maritime sector, the government to be taken precuations and academic researchers.
2. LITERATURE REVIEW
Köse et al. (2003) shows that ship traffic and the transport Caspian oil to world markets through the Turkish Straits will cause further increase in traffic density, and likewise, the waiting period, adding to the greater probability of costs. Otay and Tan (1998) developed a stochastic model of tanker traffic to determine the probability of vessels casualties resulting from the transit traffic through a narrow waterway. The study shows the two most important vessel casualties are grounding and collision. Otay and Özkan (2003) developed mathematical model to estimate the probability of casualties by using the geographical characteristics. The model gives the collision risk is higher than grounding and stranding risk in the Strait of İstanbul. Akten (2006: 269-304) finds that a total of 461 shipping accidents occurred in the Strait of İstanbul during the1953–2002 period, the majority being collisions. Debnath et al. (2011) developed a technique for modelling collision risks in port waterways. According to the result of study risk of collision could be higher due to the reduced flexibility in manoeuvring. Risk of collision could rise due to the cross traffic interactions and the high number of vessel movements. Risk of collision is found to be higher at night with 9 times higher odds of a serious conflict than during the day. Montewka et al. (2012) developed Minimum Distance to Collision (MDTC) model which allows the probability of ship–ship collisions. The statistical analysis obtained MDTC values shows that the collision criterion depends mostly on the manoeuvring pattern applied in evasive action. Georlandt and Kujala (2011) presented collision simulation model to establish the risks involved in certain accident scenarios such as ship–ship collision modeling of ship collision probability. Analysis of historical accident data suggests that grounding and ship–ship collisions are the most frequent accidents in the Gulf of Finland in the period from January 1997 to June 2006. The main traffic routes are retained in the evaluation of the collision
4
candidates, amounting to 65.7% of the vessel movements. According to simulation model the most collision candidates is overtaking and respectively crossing and head on.
Ulusçu et al. (2009) analyzed safety risks pertaining to transit vessel maritime traffic in the Strait of İstanbul and developed simulation model to mimic the operation with its geographical and weather dynamics and performed safety risk analysis According to the result of the study local traffic density and pilotage turned out to be two main factors affecting the risks at the Strait of İstanbul. When the local traffic density in the Strait is decreased by 50% during daytime, it results in an 83% decrease in the average risk. The model indicates that pilots are of utmost importance for safe transit and lack of pilotage significantly increases the risks in the Strait. The study recommends the availability and deployment of more pilots to support the transit vessels expecially dangerous cargo vessels and mandatory pilotage for vessels longer than 150 m. in their navigation through the Strait.
Aydoğdu et al. (2012) invested current marine traffic situation in the Strait of İstanbul and used Marine Traffic Fast Time Simulation (MTFTS) studies to examine the effectiveness of the proposed counter-measures. According to the results of the MTFTS studies, Sector A2 (Harem-Sirkeci) was determined as being the most dangerous because of high traffic volume and the number of high encounter situations where unacceptable stress occurrence does not decrease during off-peak times compared with the other sectors and the Total Research Area. Although Sector A1 (Kadıköy-Yenikapı) has the lowest traffic volume and potential encounters, it has the second highest risk, due to its location at the entrance and exit point of the Strait.
Ulusçu et al. (2009) looked at the scenario of the Strait of İstanbul and developed a scheduling algorithm involving the relevant specific considerations. Different scheduling policies are used for daytime and nighttime vessel traffic. Tanker, LNG-LPG and carrying dangerous vessels (200-250 m. length and <15 m. draft and 250-300 m length and >15 draft) enter the Strait every 75 and 90 minutes from the north and south entrances, respectively within daytime traffic. Tanker, LNG-LPG vessels and carrying dangerous cargo vessels (150-200 m. length and <15 m. draft) are the most critical vessels in terms of their cargo type and length, among all the vessels that can pass through the Strait at night-time. These vessels may enter the Strait at 60-minute intervals.
Yazıcı and Otay (2009) developed a real time dynamic navigation support model for navigating vessels in narrow channels. The model is tested on the Strait of İstanbul using the Strait geometry, counter traffic and the surface currents as the disturbances. According to the overall result of the study The TSS restrictions increase the navigation difficulty and the grounding probability for Strait of İstanbul; the closer the entrance point of the vessel to the channel centreline, the safer and smoother is the navigation; Southbound travel is more dangerous in terms
5
of navigational difficulty in the Strait of İstanbul; Left-side-up traffic is less dangerous in terms of casualty risk compared to the currently enforced right-side-up traffic only in the Strait of İstanbul. Kum et al. (2006) define the type of accident into 6 categories. Collision (39.6%) and grounding (38.3%) are the highest accidents in the Strait and sinking (2.8%) is the minimum. In the study the area of the İstanbul Strait is divided into 4 areas according to the environmental traffic condition, such as; local traffic situation, strong surface current, sharp turnings and so on. The area between South Entrance and the line of Çengelköy-Ortaköy is defined as Area-A. In Area-A, the main accident is collision. There is 62% of collisions occurred in this area. The Area-A has the highest accidents (41.8%) among the other areas and the minimum accidents in Area-D (7.9%) which is between Sarıyer and North Entrance of the Strait.
Kum et al.(2007) clarify the mental workload (MWL) of VTS Operator; by understanding their characteristics during carrying out their task, with a physiological index. In the study Heart Rate Monitor (HRM) is utilized as physiological index. The ships which took pilot increase their MWL. Ship’s size and taking a pilot had also close relation. The ships over 150 mt. affected to increase MWL. Also, tankers, gas carriers and the ships carry dangerous material slightly affected to increase MWL. In generally, ship’s length and type had close relations, but some cases when the ship’s length was less than 100 mt., mental workloads were affected by ship’s type. The figures of VTS-Os’ heart rates clearly show that there is a rapid decline of heart fluctuations when the beginning of mental workload, and it instantaneously increases during the task execution then slightly keeps the condition (depends on the performing time), and finally repeats the rapid decline.
Akten (2006) describes the most of the accidents are attributed to human error; quite a lot to bad weather conditions and some also to force majeure reasons. Human errors may include, inter alia, a lack of adequate knowledge and experience, technical inability, bad look-out, not paying proper attention to procedures and rules, carelessness in commanding a ship, misinterpretations of radar information, fatigue and lack of alertness, overworking, tiredness, insufficient rest periods, etc. Tzannatos (2009) analyzed the significance of the human element in accidents involving Greek-flagged ships, during 1993–2006, worldwide. Tzannatos found that 57.1% of all accidents were attributed to the human element. In terms of the association of accident types and causes, the ship’s master was found to be responsible for almost all of the very frequently encountered groundings (inc. collisions), whereas most mechanical failures and fires were caused by engine officers, and cargo shifts and flooding by bridge officers.
İnce and Topuz (2004) described Ship Handling and Vessel Traffic Flow simulation models and Hyrographic Prediction model and conducted the simulation trials under different traffic and environment conditions and discussed to show the role that the prediction and simulation programmes can play in preventing marine casualities in different waterways. The casualties in İstanbul are
6
expected to be reduced to levels below one fifth of the present level by the traffic regulations which will be enforceable by a modern VTMIS and the traffic regulations are expected to reduce the probability of encounters (i.e. risk of collision) of vessels carrying hazardous cargo in critical areas from zero to 50% according the result of simulation studies.
Baniela and Rios (2011) analyzed the relationship between the level of compliance of the cargo carrying vessels with international standards and the degree of severity of the incidents they are involved in. The empirical results obtained in the work that there is a significant relationship between the safety standards and the severity of shipping accidents. This association shows the tendency of substandard vessels to suffer more serious accidents than others.
3. MARITIME TRAFFIC AND SHIP ACCIDENTS IN THE STRAIT OF İSTANBUL
The current international status of the Turkish Straits was set by the Montreux Convention of 1936. The Montreux Convention established freedom of passage and navigation with certain formalities for merchant vessels of any flag and with any kind of cargo, by day and by night (Akten, 2003: 241). According to Article 2 of the Montreux Convention "Pilotage and towage remain optional”.
Measure to enhance navigation safety A “left-side up” navigation scheme was applicable in the Strait within the period 1934-1982. From 1st May 1982 however, the Collisions Regulations 1972 became fully applicable, and hence a “right-side up” scheme now applies in the Strait. Turkey introduced the Traffic Separation Schemes (TSS), in full compliance with the Rule 10 of the Convention on the International Regulations for Preventing Collisions at Sea (COLREG 72) to ease and regulate traffic flow and prevent ship accidents in the Turkish Straits Region to enhance safety of navigation. The maritime traffic regulations have been implemented and the new schemes have been in use since 01 July 1994. Implementation allows two-way traffic to ensure the “innocent passage” of any vessel. Comparison of the accident rates based on annual shipping traffic through per ten thousands for the periods of “right-side-up” (1982-1994) and TSS (1994-on) clearly indicate that the yearly accident rate has sharply reduced (Ece et al., 2007: 46-54). The Turkish Republic installed a Vessel Traffic Management and Information System (VTMIS) to provide more efficient safety navigation and environment. The system based on 7 radar stations is fully operational as from 31 December 2003 (Akten, 2003: 241).
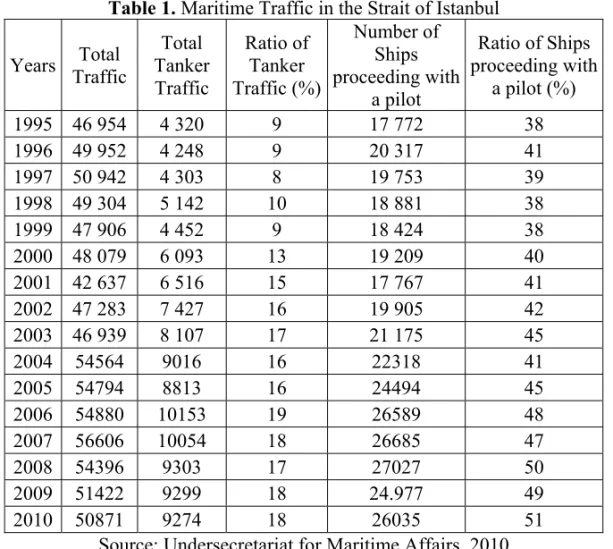
In the year 1936 in which the Montreux Convention was signed and brought into effect the number of vessels passed through the Strait was 4700 and similar figure for the year 2010 was 50 871 which of 26 035 employed maritime pilot (Undersecretariat for Maritime Affairs, 2010). There were a total of 9 274 tankers carrying nearly 145 million tons of dangerous cargos in a year
7
(Undersecretariat for Maritime Affairs, 2010). Maritime traffic in the Strait of İstanbul is given as follows:
Table 1. Maritime Traffic in the Strait of İstanbul
Years Total Traffic Total Tanker Traffic Ratio of Tanker Traffic (%) Number of Ships proceeding with a pilot Ratio of Ships proceeding with a pilot (%) 1995 46 954 4 320 9 17 772 38 1996 49 952 4 248 9 20 317 41 1997 50 942 4 303 8 19 753 39 1998 49 304 5 142 10 18 881 38 1999 47 906 4 452 9 18 424 38 2000 48 079 6 093 13 19 209 40 2001 42 637 6 516 15 17 767 41 2002 47 283 7 427 16 19 905 42 2003 46 939 8 107 17 21 175 45 2004 54564 9016 16 22318 41 2005 54794 8813 16 24494 45 2006 54880 10153 19 26589 48 2007 56606 10054 18 26685 47 2008 54396 9303 17 27027 50 2009 51422 9299 18 24.977 49 2010 50871 9274 18 26035 51
Source: Undersecretariat for Maritime Affairs, 2010
The rate of maritime pilot employed 51% in 2010 and it decreased 1% according to the previous year. An analysis concerning the accidents in the Strait of İstanbul shows that the rate of not employing a maritime pilot was 92,8 % in accidents and 7,2% for vessels that did employ a maritime pilot involved in accidents in Strait of İstanbul between the years in 1982-2003 (Ece, 2007: 105). Therefore taking on a pilot for the passage has proven successful to reduce the risk of an accident in the Strait of İstanbul. The maritime traffic in the Strait of İstanbul has exceeded the limits for safety navigation. Moreover, the ship traffic passing from the Strait of İstanbul continues to increase (Ece, 2008: 150-180).
There are a lot of accidents occurred in the Strait of İstanbul till today. Expecially tankers give very big environmental disaster. The important accidents listed below:
8
In December 1960 the tanker called Yugoslavia flagged tanker Zoranic-World Harmony collied with Greek tanker Zoranic-World Harmony and 18 000 tons of crude oil spilled. In March 1966 the Russian ships Lutsk-Kransky and Oktiabr collied at the south entrance of Strait of İstanbul and 1 850 tons of crude oil spilled. The most catastrophic of the accidents occurred in 1979 in the Marmara Sea at the entrance of Strait of İstanbul when the M/V Evriali collied with M/T Independenta, the latter fully laden with oil. The collision resulted one of the most serious oil spill in the world as a total of 95 000 tons of crude oil spilled and burned in the Strait. Forty three crew numbers lost their lives. Ammoniac loaded Panama flagged tanker M/T Blue Star, collied with the Turkish Crude Oil Tanker M/T Gaziantep, which was at the anchor, on 28 October 1988. Huge quantities of ammoniac cargo polluted the environment. In March 1990 the tanker Jambur and Datongshan collied and 2600 tons oil spilled. In 1994 M/T Nassia also collied with the M7V Ship Broker resulting in a spill of 20 000 tons and twenty nine crew members lost their lives. All the coastline were covered in thick oil and pitch.
Another disaster that occurred on 21 February 2006 is a intense illustration of this risk; a tanker 243 meters in length laden with 86 000 tonnes of fuel oil was navigating through Strait of İstanbul at a speed of 12 nautical miles when the rudder locked. The quick action of the pilot who by dropping anchor succeeded in stopping the tanker within a mere 200 meters from the 18th Century Dolmabahçe Palace quay (Undersecretariat for Maritime Affairs, 2000: 190-192; Oral, 2006: 1-29).
4. MATERIAL AND METHODS 4.1. Data Collection
The accident historical data included the years 1982 through to 2010 were applied to the vessels and tankers serving world oil markets passing through Strait of İstanbul. The accident data for Strait of İstanbul was acquired from the Prime Ministry, Undersecretariat for Maritime Affairs (2009-2011); www.denizce.com, 2004;), Turkish Maritime Pilots Association (2000-2004); Turkish Maritime Research Foundation (TÜDAV, 2003), LLyod’s Maritime Information Service’s traffic incident database and the articles (Kornhauster and Clark, 1995: 15-45) and PhD thesis (Baş, 1999: 146) on this matter. The data included name, type and flag of vessel; year, type, location and reason of accident.
Ship accident data base contains 785 records involving collisions, stranding, grounding, fire and explosion, foundering, contact and others. The vessels included all reported accidents involving commercial such as general cargo, dry bulk, container, Ro-Ro, tanker, tugboat, passenger, recreational, fishing vessels and others.
9 4.2. Data Analysis
The statistical analysis was used to analyse the accidents occured in Strait of İstanbul in the period of 1982-2010 by using SPSS Statistical Package Programme SPSS 17.00. The nonparametric variables such as accident year, ship flag, the type, reason and zone of accident were used in the analysis. The classification scale was used to define the non parametric variables and to divide sub groups.
In order to describe the data used in this paper I used the descriptive statistics such as frequency distribution and non parametric statistics such as Chi-Square Test (χ2). Frequency Distribution was used to show a summarized grouping of the nonparametric data. The Chi-Square Test was used to determine the relationships between the non parametric variables. The significance level was set at 5%.
4.2.1. Frequency Distribution
The Strait of İstanbul faced 785 ship accidents of different types such as collisions, groundings, strandings, fires/explosions and others (such as rudder blockade, vessel’s list, or engine breakdown) during the 1982-2010 period. The most number of accident occurred between the years 1982-1993 with the frequency 340 (43.3%) before the “right-side up scheme” period has been implemented.
Table 2. Frequency Distribution of Ship Accidents by Years
Years of occurrence Frequency Percentage
(%) Percentage of Total Cumulative (%) 1982 - 1993 340 43.3 43.3 1994 - 2003 268 34.1 77.5 2004 - 2010 177 22.5 100.0 Total 785 100.0
There was no traffic density until 1982. However, between 1992-2010, as the traffic density and tonnage of the ships increased so did the number of near misses. The least number of accident occurred after the implementation of the Vessel Traffic Services (VTS) with the frequency 177 (22.5%) in the years between 2004 and 2010. The accidents have decreased significantly after implementation of The Maritime Traffic Regulations, Traffic Separation Schemes (TSS) and VTS. Measurements such as VTS and the ship’s obeying rules are taken in order to diminish human error such as professional weariness and fatigue. İnce and Topuz (2004) also show VTMIS and the traffic regulations reduce the probability of risk of collision of vessels according the result of simulation studies. The accidents occured in the Strait of İstanbul decreased in the period 1982-2010 as shown the bar chart in Figure 1.
10
Figure 1. Bar Chart by Accident Years
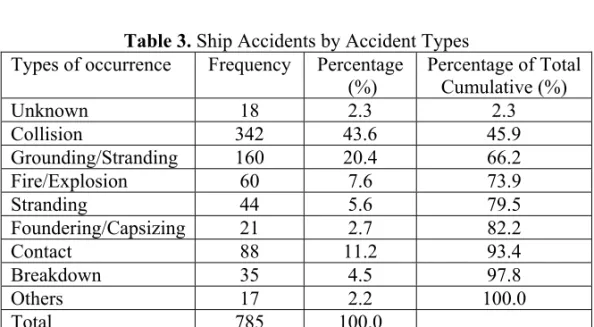
Table 3. Ship Accidents by Accident Types
Types of occurrence Frequency Percentage
(%) Percentage of Total Cumulative (%) Unknown 18 2.3 2.3 Collision 342 43.6 45.9 Grounding/Stranding 160 20.4 66.2 Fire/Explosion 60 7.6 73.9 Stranding 44 5.6 79.5 Foundering/Capsizing 21 2.7 82.2 Contact 88 11.2 93.4 Breakdown 35 4.5 97.8 Others 17 2.2 100.0 Total 785 100.0
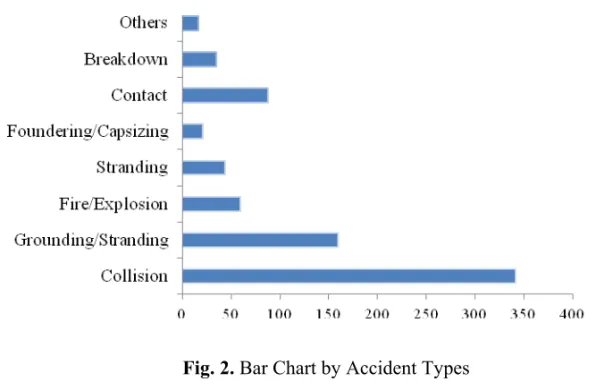
Based on the data over a twenty-eight years period from 1982 to 2010, a total of 43.6% of the accidents were collisions, 20.4.0% were grounding/stranding, 7.6% fire/ explosion, 5.6% were stranding, 11.2% were contact, 2.7% were foundering/capsizing and 4.5% were breakdown. The collison was the most accident type occured in the Strait of İstanbul as shown in Table 3 and Figure 2. Collisions are mostly caused by human error. Among accidents, collisions the most occurred accident type, because the near-miss area can not be controlled and has limited maneuver. The reason for grounding/stranding is oceanographic and hydrographic conditions. Otay and Tan (1998) and Georlandt and Kujala (2011) also show the two most important vessel casualties are grounding and collision. Otay and Özkan (2003), Akten (2006), Kum et al. (2006) and Debnath et al. (2011) describe the risk of collision is higher than grounding and stranding risk in the Strait of İstanbul.
11
Fig. 2. Bar Chart by Accident Types
To analyze ship accidents by accident zones, the Strait of İstanbul is divided four zones. The zones are as follows:
- First Zone: Haydarpaşa-Eminönü and Ortaköy-Çengelköy (included) - Second Zone: Ortaköy-Çengelköy and Yeniköy-Paşabahçe (included) - Third Zone: Yeniköy-Paşabahçe and Rumeli Kavağı-Kavak Burnu (included)
- Fourth: Rumeli Kavağı-Kavak Burnu and Anadolu Feneri-Rumeli Feneri (included)
Table 4. Frequency Distribution of Ship Accidents by Zones
The Strait of İstanbul faced the most ship accidents in the First Zone with the ratio of 35.2%, and respectively in the Second Zone (27.0%). The least number of accident occurred in the Fourth Zone (10.2%) between the years 1982-2010 during the “right-side up scheme” period. Başar et al. (2006) identified four high
Accident occurence zones Frequency Percentage (%) Percentage of Total Cumulative (%) Strait of İstanbul (Unknown) 96 12.2 12.2 First Zone 276 35.2 47.4 Second Zone 212 27.0 74.4 Third Zone 121 15.4 89.8 Fourth Zone 80 10.2 100.0 Total 785 100.0
12
risk areas after analysing accident statistics for the Strait of İstanbul. These areas are Anadolu Kavağı, Büyükdere, Çengelköy and Haydarpaşa. In my study, Çengelköy and Haydarpaşa are in the First Zone where the most accident occured. Aydoğdu et al. (2012) determine Sector A2 (Harem-Sirkeci) is the most dangerous because of high traffic volume and the number of high encounter situations and Sector A1 (Kadıköy-Yenikapı) has the second highest risk, due to its location at the entrance and exit point of the Strait. According to frequency distribution as shown in Table 4 the second highest risk location is defined between Ortaköy-Çengelköy and Yeniköy-Paşabahçe.
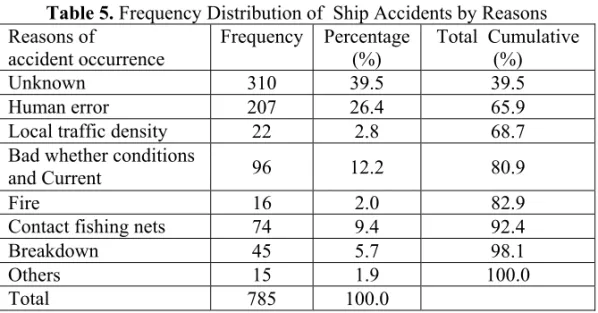
Table 5. Frequency Distribution of Ship Accidents by Reasons
Reasons of accident occurrence Frequency Percentage (%) Total Cumulative (%) Unknown 310 39.5 39.5 Human error 207 26.4 65.9
Local traffic density 22 2.8 68.7
Bad whether conditions
and Current 96 12.2 80.9
Fire 16 2.0 82.9
Contact fishing nets 74 9.4 92.4
Breakdown 45 5.7 98.1
Others 15 1.9 100.0
Total 785 100.0
Table 5 shows that human error is the major cause of accidents with the frequency of 207, respectively bad wheather conditions and current with the frequency of 96, contact fishing nets with the frequency of 74 and local traffic density with the frequency of 22. The least frequency of accident reason occurred fire with the frequency of 16 between the years 1982-2010 during the “right-side
up scheme” period. Akten (2006) and Tzannatos (2009) also describe the most of
the accidents are attributed to human error.
Human error is generally accounted for 85 percent of accidents at sea. Human error drives from such incidents that the person responsible from managing the vessel technically misconceives the lighthouse, and misreads values of depth, angle and distance, insufficiency of technical knowledge, mental disease, acting exceptionally, fatigue, sleeplessness, professional fatigue, lack of education and so on. The ship’s Master was found to be the main cause of groundings and collisions, whereas engine and bridge officers have caused many technical failures, fire/explosions and other types of accidents (Tzannatos, 2010: 125).
Ulusçu et al. (2009) show traffic density and pilotage turned out to be two main factors affecting the risks at the Strait of İstanbul. Passage through Strait of İstanbul becomes even more dangereous due to increasingly busy local traffic with an average of 2000-2500 daily crossing by boats transporting citizens’ back and
13
forth between the two coasts of the city. Pleasure boats used in the Strait, for tourist and entertaintment purposes, further increase the amounth of local traffic especially in summer seasons. Boat movements are also increased by the swarms of fishing boats ( İstikbal, 2006: 73-76). Local traffic density causes further increase in traffic density and accidents.
4.2.2. Chi Square Analysis
I used the cross-tabs to analyze the relationship between the non parametric
variables such as type, zone and reason of the accident and type of ship and ship flag. I also used the the Chi square (χ2) analysis to test the null hypothesis (H
0), which states there is no significant difference between expected and observed accident data between the years 1982-2010.
It was tested a hypothesis H
0that fully specifies p
1,….., pk,
H
0: p
1= p1
(0), ; p
2= p2
(0), …………., pk = pk
(0),
The formula for the χ
2test statistic is:
k k
χ
2= ∑ (n
i-np
i(0))
2= ∑ (Observed Count in Cell i- Expected Count in Cell i)
2(1)
i=1 np
i(0)i=1 Expected Count in Cell i
Chi Square Hypothesis for between type of the accident and reason of accident: Hypotesis;
H0: There is not a relationship between type of the accident and reason of accident H1: There is a relationship between type of the accident and reason of accident The Table 6 shows that the most of the collisions occured due to human error with the ratio of 32.5%. Most of the groundings occured due to human error with the ratio of 23.8%. Most of the domestic traffic density caused the collison with the ratio of 2.6% in the Strait of İstanbul in the period of 1982-2010.
The Chi Square value is 365,855 and P=0 which is less than significance level at 0.05 as shown in Table 6. We can safely use the chi-square test when (a) the samples are simple random samples; (b) all individual expected counts are 1 or more than 1 and (c) no more than 20% of expected counts are less than 5.
14
Table 6. Cross-Tab between Type of the Accident and Reason of Accident
Pearson Chi-Square χ2 = 365,855a P = 0,000, Likelihood Ratio =69,517, P= 0,000 a. 41 cells (56.9%)
have expected count less than 5. The minimum expected count is 0.32
According to the result of Pearson Chi-Square Tests, minimum expected count is less than 1 (0.32) and 56.9% of expected counts are less than 5. Therefore, the cells are pooled to reduced the number of expected frequencies that are less than 5.
15
Table 7. Chi-Square Tests between Type of the Accident and Reason of Accident
a. 6 cells (20.0%) have expected count less than 5. The minimum expected count is 1.05. The samples are simple random samples; all individual expected counts are more than 1 and 20% of expected counts are less than 5 as shown in Table 7. Therefore, I use the Chi-Square Test. The Pearson Chi-Square test statistic is 101,792. The test result indicated that since the P-value (0.0000) is less than the significance level (α =0.05), the null hypothesis (H0) is rejected, alternative hypothesis (Hı) is accepted. Thus, I conclude that there is a statistical relationship between type of the accident and reason of accident.
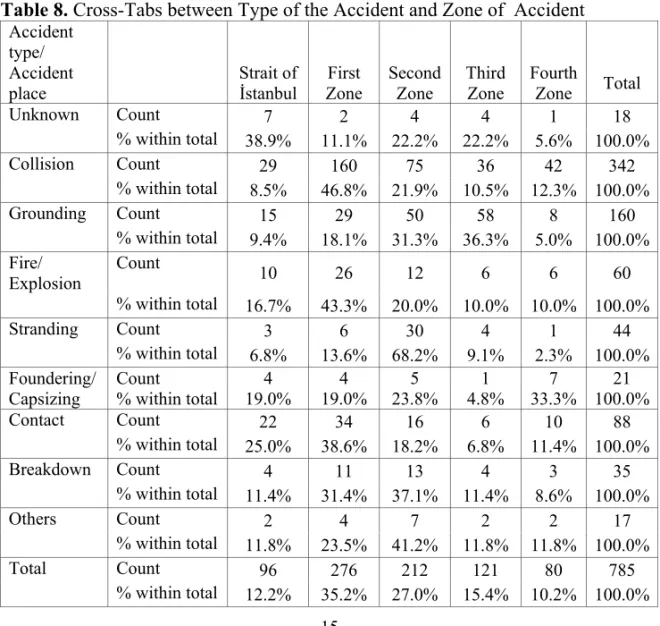
Table 8. Cross-Tabs between Type of the Accident and Zone of Accident Accident type/ Accident place Strait of İstanbul First Zone Second Zone Third Zone Fourth Zone Total Unknown Count 7 2 4 4 1 18 % within total 38.9% 11.1% 22.2% 22.2% 5.6% 100.0% Collision Count 29 160 75 36 42 342 % within total 8.5% 46.8% 21.9% 10.5% 12.3% 100.0% Grounding Count 15 29 50 58 8 160 % within total 9.4% 18.1% 31.3% 36.3% 5.0% 100.0% Fire/ Explosion Count 10 26 12 6 6 60 % within total 16.7% 43.3% 20.0% 10.0% 10.0% 100.0% Stranding Count 3 6 30 4 1 44 % within total 6.8% 13.6% 68.2% 9.1% 2.3% 100.0% Foundering/
Capsizing Count % within total 19.0% 4 19.0% 4 23.8% 5 4.8% 1 33.3% 7 100.0% 21
Contact Count 22 34 16 6 10 88 % within total 25.0% 38.6% 18.2% 6.8% 11.4% 100.0% Breakdown Count 4 11 13 4 3 35 % within total 11.4% 31.4% 37.1% 11.4% 8.6% 100.0% Others Count 2 4 7 2 2 17 % within total 11.8% 23.5% 41.2% 11.8% 11.8% 100.0% Total Count 96 276 212 121 80 785 % within total 12.2% 35.2% 27.0% 15.4% 10.2% 100.0%
Value df Asymp. Sig.
(2-sided) Pearson Chi-Square 101,792 20 0.000 Likelihood Ratio 100,688 20 0.000 Linear-by-Linear Association 14,990 1 0.000 N of Valid Cases 785
16
The most collision occured in the First Zone (%46.8) due to domestic traffic density. The most grounding occured in Third Zone (36.3%) due to the currents. the most fire/explosion occured in First Zone (43.3%). The most stranding occured in the Second Zone (68.2%). The most foundering/capsizing occured in the Fourth Zone (33.3%) due to velocity of current. The nost breakdown occured in the Second Zone (37.1%). Kum et al. (2006) define 62% of collisions occurred in the area which is located between South Entrance and the line of Çengelköy-Ortaköy.
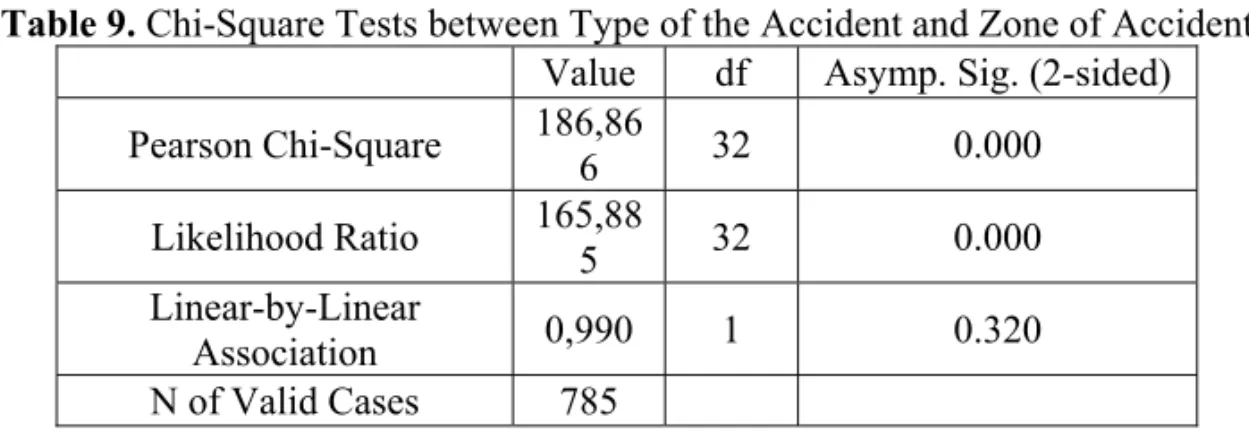
Table 9. Chi-Square Tests between Type of the Accident and Zone of Accident
Value df Asymp. Sig. (2-sided)
Pearson Chi-Square 186,86 6 32 0.000 Likelihood Ratio 165,88 5 32 0.000 Linear-by-Linear Association 0,990 1 0.320 N of Valid Cases 785
a. 14 cells (31.1%) have expected count less than 5. The minimum expected count is 1.73. According to the result of Pearson Chi-Square Tests shown in Table 9, minimum expected count is greater than 1 but 31.1% of expected counts are less than 5. Therefore, the accident types are pooled as collision, grounding, contact, breakdown and others to reduced the number of expected frequencies that are less than 5 (20%).
Table 10. Chi-Square Tests between Type of the Accident and Zone of Accident
(Re-Pooled)
Value df Asymp. Sig. (2-sided)
Pearson Chi-Square 136,296 20 0.000
Likelihood Ratio 124,255 20 0.000
Linear-by-Linear
Association 0,043 1 0.835
N of Valid Cases 785
a. 6 cells (20.0%) have expected count less than 5. The minimum expected count is 1.83. The minimum expected count is greater than 1 and 20.0% of expected counts are less than 5. Therefore I use the Pearson Chi-Square Test to determine whether there is a significant association between the two variables such as type of the accident and zone of accident. The Pearson Chi-Square test statistic is 136,296. The null hypothesis that there is not a relationship between type of the accident and zone of accident. The alternative hypothesis that there is a relationship type of the accident and zone of accident at the significance level at 5%. The test result
17
indicated that since the P-value (0.0000) is less than the significance level (α =0.05), the null hypothesis(H0)is rejected, alternative hypothesis (Hı) is accepted. Thus, I conclude that there is a statistical relationship between type of the accident and zone of accident.
Table 11. Cross-Tabs between Type of Ship and Type of Accident
The cargo ships (General cargo+dry bulk+refeer+container+Ro-Ro) were involved in the cargo ships (General cargo+dry bulk+refeer+container+Ro-Ro) were involved in the most accidents with the frequency of 358 and respectively the passenger ships (passenger ship&boat+sea bus+ferryboat) with the frequency of 142, boats (Boat+yatch+tugboat+research ship+others with the frequency of 108 and tankers and liquid bulk ships with the frequency of 79 were involved an accident. Cargo ships were involved in the most collision with the ratio of 38.5% (138 shipwrecks) and tankers and liquid bulk ships were involved in the most
18
collision with the ratio of 39.2% (31 shipwrecks) and passenger ships were also involved in the most collision with the ratio of 61.3% (87 shipwrecks). Boat, yatch, tugboat, research ship and etc. were involved in the most collision with the ratio of 48.1% (52 shipwrecks).
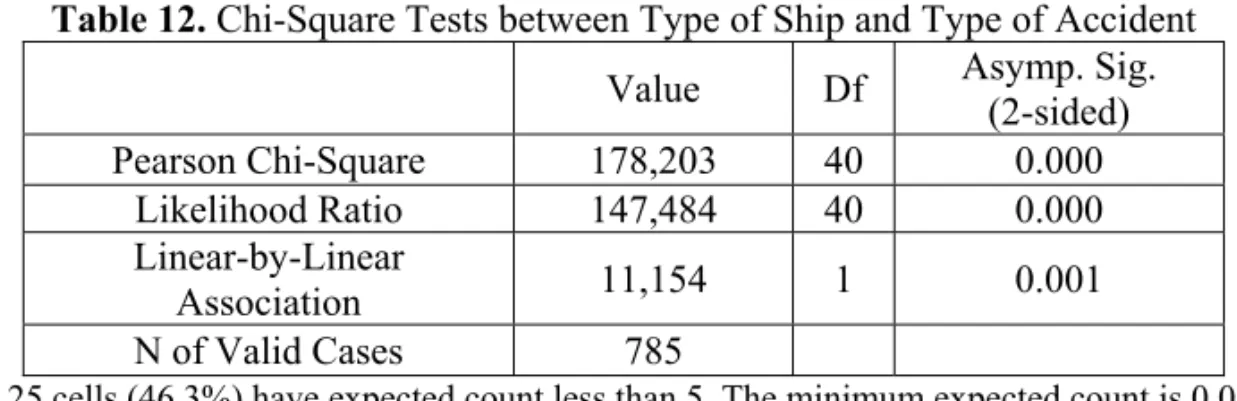
Table 12. Chi-Square Tests between Type of Ship and Type of Accident
Value Df Asymp. Sig.
(2-sided) Pearson Chi-Square 178,203 40 0.000 Likelihood Ratio 147,484 40 0.000 Linear-by-Linear Association 11,154 1 0.001 N of Valid Cases 785
a. 25 cells (46.3%) have expected count less than 5. The minimum expected count is 0.02 According to the result of Pearson Chi-Square Tests shown in Table 12, minimum expected count is less than 1 and 46.3% of expected counts are less than 5. Therefore, the type of ships are re-pooled as cargo ships (general cargo+dry bulk+refeer+container+Ro-Ro), tankers (tanker+liquid bulk), passenger ships (passenger+ship&boat+seabus+ferryboat)and others (boat+yatch+tugboat+research ship+others) and type of accidents are re-pooled as collision, grounding, contact, breakdown and others (fire/explosion etc.) to reduced 20% of expected frequencies that are less than 5.
Table 13. Chi-Square Tests Between Type of Ship and Type of Accident
(Re-Pooled)
a. 7 cells (23.3%) have expected count less than 5. The minimum expected count is 1.81.
According to the result of Pearson Chi-Square Tests shown in Table 13, minimum expected count is greather than 1 and 23.3% of expected counts are less than 5. Therefore, the type of ships are re-pooled as cargo ships (general cargo+dry bulk+refeer+container+Ro-Ro), tankers (tanker+liquid bulk) and others (boat+yatch+tugboat+research ship+others) to reduced 20% of expected frequencies that are less than 5.
Value df Asymp. Sig. (2-sided)
Pearson Chi-Square 93,016 20 0.000
Likelihood Ratio 90,008 20 0.000
Linear-by-Linear
Association 0,995 1 0.318
19
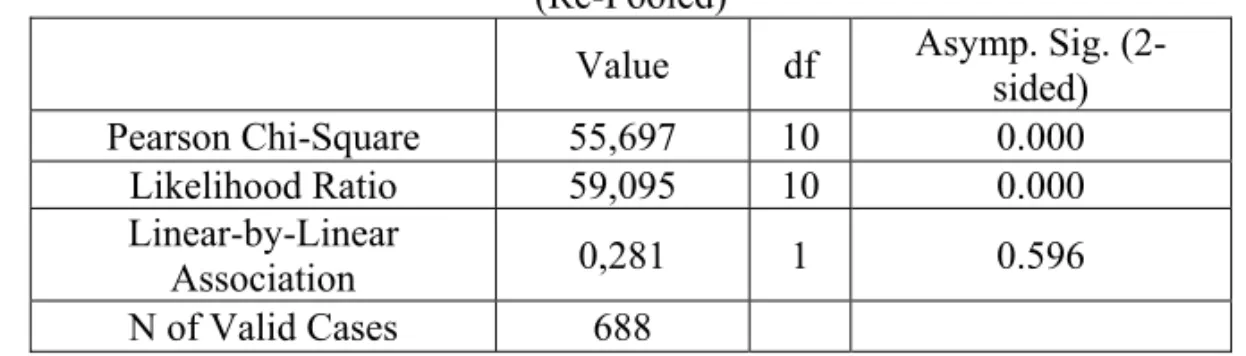
Table 14. Chi-Square Tests between Type of Ship and Type of Accident
(Re-Pooled)
Value df Asymp. Sig.
(2-sided) Pearson Chi-Square 55,697 10 0.000 Likelihood Ratio 59,095 10 0.000 Linear-by-Linear Association 0,281 1 0.596 N of Valid Cases 688
a. 3 cells (16.7%) have expected count less than 5. The minimum expected count is 1.15. Table 15. Cross Tab of Type of Ship Flags and Zones of Accident Types of ships/
Zones of accident Strait of İstanbul Zone I. Zone II. Zone III. Zone Total IV.
Unknown Count 5 4 11 0 4 24
% of
total 20.8% 16.7% 45.8% .0% 16.7% 100.0%
Turkish flag Count 52 178 92 48 31 401
% of
Total 13.0% 44.4% 22.9% 12.0% 7.7% 100.0%
European flag Count 11 36 44 27 15 133
% of
Total 8.3% 27.1% 33.1% 20.3% 11.3% 100.0%
Russian&Turkic
Rep. flag Count % of
Total
14
15.7% 33.7% 30 29.2% 26 12.4% 11 9.0% 8 100.0% 89
Asian&Africa flag Count 9 17 25 23 15 89
% of Total 10.1% 19.1% 28.1% 25.8% 16.9% 100.0% Cont. of America+Antique flag Count % of Total 5 10.2% 11 22.4% 14 28.6% 12 24.5% 7 14.3% 49 100.0% Total Count 96 276 212 121 80 785 % of Total 12.2% 35.2% 27.0% 15.4% 10.2% 100.0%
According to the result of Pearson Chi-Square Tests shown in Table 14, minimum expected count is greather than 1 and 16.7% of expected counts are less than 5. The Pearson Chi-Square test statistic is 55,697. The null hypothesis that there is not a relationship between type of ship and type of accident. The alternative hypothesis that there is a relationship type of ship and type of accident at the significance level at 5%.
The test result indicated that since the P-value (0.0000) is less than the significance level (α =0.05), the null hypothesis (H0) is rejected, alternative hypothesis (Hı) is accepted. Thus, I conclude that there is a statistical relationship between type of ship and type of accident.
20
Between the the years 1982-2010 Turkish flag vessels were involved in the most accidents with the frequency of 401, respectively European flag vessels with the frequency of 133 and Asian&Africian flag vessels and Russian&Turkic Republic flag vessels with the frequency of 89. Continent of America and Antique flag vessels were involved in the least accidents with the frequency of 49.
Table 16. Chi-Square Tests between Ship Flag and Zone of Accident
Value df Asymp. Sig. (2-sided)
Pearson Chi-Square 62,357 20 0.000
Likelihood Ratio 65,068 20 0.000
Linear-by-Linear Association 20,566 1 0.000
N of Valid Cases 785
a. 4 cells (13.3%) have expected count less than 5. The minimum expected count is 2.45.
The minimum expected count is greater than 1 (2,45) and 13,3% of expected counts are less than 5. Therefore I use the Pearson Chi-Square Test to determine whether there is a significant association between ship flag and and zone of accident. The Pearson Chi-Square test statistic is 62,357. The test result indicated that since the P-value (0.0000) is less than the significance level (α =0.05), the null hypothesis(H0)is rejected, alternative hypothesis (Hı) is accepted. Thus, I conclude that there is a statistical relationship between ship flag and and zone of accident.
5. CONCLUSION
The growing number of the ships and the transport of Caspian oil to world markets through the Strait of İstanbul will casue further increase in traffic density. The ships expecially tankers carrying dangerous cargo have become a serious threat to safety of navigation, human life, historical/cultural heritage and environment in the Strait of İstanbul.
Accidents, which may occur, especially from tanker traffic, could create hazard such as oil spill and cause the suspension of the Strait of İstanbul traffic. the Strait of İstanbul faced 785 ship accidents during the “right-side up” scheme period 1982-2010. This study will shed light on the studies concerning the accidents occured in the Strait of İstanbul. The findings of the paper can be summarized as:
First, the most number of accident occurred between the years 1982-1993 before the Maritime Traffic Regulations have been implemented. The least number of accident occurred after the implementation of the Vessel Traffic Services (VTS) in the years between 2004 and 2010. After the introduction of Vessel Traffic Services (VTS) (2004- ), there has been a significance improvement in safety of navigation and protection of marine environment.
21
Second, the collison was the most accident type occured in the Bosphorus and respectively grounding, fire/explosion, stranding, contact, foundering/capsizing and breakdown. One of the most important innovations in the 1972 COLREGs was the recognition given to traffic separation schemes - Rule 10 gives guidance in determining safe speed, the risk of collision and the conduct of vessels operating in or near traffic separation schemes. After the implementation of The Maritime Traffic Regulations and introduction of Traffic Separation Schemes (TSS) in 1994 and implementation of VTS in 31 December 2003 there has been a significance decrease the number of accidents in the Strait.
Third, the cargo ships (general cargo,dry bulk,refeer, container, Ro-Ro were involved in the most accidents and respectively the passenger ships, boats (boat, yatch, ugboat, research ship and others) and tankers and liquid bulk ships were involved an accident.
All type of ships such as cargo ships, tankers, liquid bulk ships, passenger ships and boats etc. were involved in the most collision. Cargo vessels and tankers should be encouraged to engage maritime pilot in order to reduce accidents.
Fourth, the Strait of İstanbul faced the most ship accidents in the First Zone (between Haydarpaşa-Eminönü and Ortaköy-Çengelköy) and respectively in the Second Zone (between Ortaköy-Çengelköy and Yeniköy-Paşabahçe). The least number of accident occurred in the Fourth Zone (Rumeli Kavağı-Kavak Burnu and Anadolu Feneri-Rumeli Feneri). The second zone is the narrowest zone. Therefore, necessary precautions such as navigational aids, escort tugs and pilotage services should be taken in the First and the Second Zones where most of the accidents occurred.
Fifth, the human error is the major cause of accidents and respectively current and bad wheather conditions, contact fishing nets and local traffic density. The vessels should be promoted to appoint maritime pilot in bad weather conditions, high current speed and the passage of the vessels with high tonnage to minimize human error.
Finally, The chi square (χ2) test was used for the years 1982-2010 when the right-side passage navigation system was adopted. The results of Chi Square analysis there is a statistical relationship between the non parametric variables as follows:
- type of the accident and reason of accident, - type of the accident and zone of accident, - type of ship and type of accident,
22
Protection of the Strait of İstanbul from accidents expecially collisions and oil spill and innocent passage is important for the people living in İstanbul, Black Sea countries, Turkic Republics and the international oil transporters. Therefore, further necessary precautions should be taken as soon as possible. Necessary precautions should be initiated regarding the following issues: improvement of navigation aids; more employed pilotage and towing services expecially for low standard cargo ships and tankers that pass directly through Strait of İstanbul; compulsory insurance for big ships; diversification of navigation equipments such as advanced the Global Positioning System (GPS), ECDIS (Electronic Chart Display and Information System; minimizing human errors; establishment of alternative dangerous cargo routes such as pipelines; ensuring environmental security; determination of accident black spots in the Strait of İstanbul and establishment of full equipped fire boats to increase navigation and environment safety in the Strait of İstanbul.
REFERENCES
AKTEN, N. (2003). The Strait of İstanbul (Strait of İstanbul): The Seaway Separating the Continents with its Dense Shipping Traffic, Turkish Journal of
Marine Sciences, Vol. 9, No. 3, pp. 241.
AKTEN, N. (2004). Analysis of Shipping Casualties in The Strait of İstanbul, The
Journal of Navigation, Vol. 57, No. 3, pp. 345-356.
AKTEN, N. (2006). Shipping Accidents: a Serious Threat for Marine Environment,
Journal of the Black Sea/Mediterranean Environment, Vol. 12, pp. 269-304.
AYDOĞDU, Y. V., YURTÖREN, C., PARK, J. and PARK, Y. (2012). Study on Local Traffic Management to Improve Marine Traffic Safety in the İstanbul Strait,
Journal of Navigation, Vol. 65, Issue 01, pp. 99-112.
BANIELA, S. I. and RIOS, J.V. (2011). Maritime Safety Standards and the Seriousness of Shipping Accidents, Journal of Navigation, Vol. 64, Issue 03, pp. 405- 518.
BAŞAR, E., KÖSE, E. and GÜNEROĞLU, A. (2006). Finding Risky Areas for Oil Spillage after Tanker Accidents at İstanbul Strait, International Journal of
Environment and Pollution, Vol 27, No.4, pp.388-400.
BAŞ, M. (1999). Türk Boğazları’nda Risk Analizi ile Güvenli Seyir Modeli, (The Risk Analysis at the Turkish Straits and Safety Navigation Model), PhD Thesis,
T.C.İstanbul Üniversitesi, Fen Bilimleri Enstitüsü, İstanbul, pp. 17, 146.
CHAPMAN, S.E. and AKTEN, N. (1998). Marine Casualties in the Turkish Straits - A Way Ahead, Seaways, The International Journal of the Nautical Institute, pp. 6-8.
23
CMS (United Nations UNEP/CMS), (2005). Convention on Migratory Species, <http://www.cms.int/news/index.htm> [Accessed: Oct, 26,.2005].
DEBNATH, A. K., CHIN, H.C., HAGUE, M. (2011). Modelling Port Water Collision Risk Using Traffic Conflicts, Journal of Navigation, Vol. 64, Issue 04, pp. 645, 652-654.
DENİZHABER (2009). <http://www.denizhaber.com/HABER/25258/3/kilavuz-kaptan-İstanbul-bogazi.html> [Accessed: May, 20, 2009].
ECE, N.J. (2007). İstanbul Boğazı: Deniz Kazaları ve Analizi (Strait of İstanbul:
Maritime Accidents&It’s Analysis), İstanbul: Deniz Kılavuzluk A.Ş. (DEKAŞ)
Publishes, pp. 105.
ECE, N.J., SÖZEN, A., AKTEN, N., EROL, S. (2007). Tricky Conduit for Safe of Navigation, Strait of İstanbul. European Journal of Navigation, Vol. 5, No. 1, pp.46-54.
ECE, N.J.(2008). Particularly Sensetive Areas and Strait of İstanbul, Conference on Coastal&Marine Areas of Turkey” organized by the Gazi University, pp. 150-180, Ankara (27-30 May 2008).
GOERLANDT, F.and KUJALA, P. (2011). Traffic Simulation Based Ship Collision Probability Modelling, Reliability Engineering & System Safety, Vol. 96, Issue 1, pp. 91–107.
İNCE, A.N. and TOPUZ, E. (2004). Modelling and Simulation for Safe and Efficient Navigation in Narrow Waterways, The Journal of Navigation, Vol. 57, Issue 01, pp. 53-71.
İSTİKBAL, C. (2006). Turkish Straits: Difficulties and The Importance of The Pilotage, Oral, N., Öztürk B. (Eds.), The Turkish Straits, Maritime Safety, Legal and Environmental Aspects, Turkish Marine Research Foundation (TÜDAV),
Publication No. 5, İstanbul, pp. 73-75.
KORNHAUSTER, A.L., CLARK, W.A. (1995). Quantitative Forecast of Vessel Casualties resulting from Additional Oil Tanker Traffic Through the Bosporus Report, ALK Associates Inc. Princeton, NJ, England, pp. 15-17, 3, 25-26, 38, 40, 42-45.
KÖSE, E., BAŞAR, E, DEMİRCİ, E., GÜNEROĞLU, A., ERKEBAY, Ş. (2003). Simulation of Maritime Traffic in İstanbul Strait, Simulation Modelling Practice
24
KUM, S., FUCHI, M., FURUSHO, M. (2006). Analysing of Maritime Accidents By Approaching Method for Minimizing Human Error, Proceedings of IAMU
AGA-7, Globalization&MET, Part 2, pp. 392-409.
KUM, S., FURUSHO, M., DURU, O., SATIR, T. (2007). Mental Workload of the VTS Operators by Utilising Heart Rate, TransNav, Vol .1, No. 2, pp.146-150. MONTEWKA, J., GOERLANDT, F., KUJALA, P. (2012). Determination of Collision Criteria and Causation Factors Appropriate to a Model for Estimating the Probability of Maritime Accidents, Ocean Engineering, Vol.40, pp. 50-60.
ORAL, N. (2006). The Turkish Straits and the IMO: A Brief History”, Oral, N., Öztürk, B. (Eds.) The Turkish Straits, Maritime Safety, Legal and Environmental
Aspects, Marine Research Foundation (Tüdav), Publication No.25, pp. 1- 29.
OTAY, E. and TAN, B. (1998). Stochastic Modeling of Tanker Traffic through
Narrow Waterways, Proc. 1stInternational Conference on Oil Spills in the
Mediterranean and Black Sea Regions, , İstanbul, pp. 85-96 (15-18 Sep. 1998).
OTAY, E.N., and ÖZKAN, Ş., (2003). Stochastic Prediction of Maritime Accidents in the Strait of İstanbul, Proceedings of the 3rd International
Conference on Oil Spills in the Mediterranean and Black Sea Regions, İstanbul,
pp. 92-104.
TAN, B. and OTAY, E. (1998). A Stochastic Model of Vessel Casualties Resulting from Oil Tanker Traffic through Narrow Waterways, 12th European Simulation
Multiconference, Manchester, UK, pp. 881-885.
TURKISH MARITIME PILOTS ASSOCIATION (2004), List of Casualties Which
Occured in the Strait of İstanbul During the Period 01/07/1994 to 31/08/2000, pp.
1-5.<http://www.turkishpilots.org.tr/DOCUMENTS> [Accessed: Jun, 17, 2004]. TURKISH MARITIME PILOTS ASSOCIATION (2004), List of Accidents
Occured in The Strait of İstanbul,1948-01.05.1982, pp.1-5.
<http://www.turkishpilots.org./CASUALTY/accidents.html> [Accessed: Dec, 16, 2004].
TURKISH MARITIME RESEARCH FOUNDATION (TÜDAV) (2003). Accident
Statistics for Strait of İstanbul.
TZANNATOS, E. (2010). Human Element and Accidents in Greek Shipping,
Journal of Navigation, Vol .63, Issue 1, pp.119-127.
ULUSÇU, Ö. S., ÖZBAŞ, B., ALTIOK, T., OR, İ. (2009). Risk Analysis of the Vessel Traffic in the Strait of İstanbul, Risk Analysis, Vol. 29, No.10, pp.1454-1455, 1471.
25
ULUSÇU, Ö. S., ÖZBAŞ, B., ALTIOK, T., OR, İ., YILMAZ, T. (2009). Transit Vessel Scheduling in the Strait of İstanbul, Journal of Navigation, Vol. 62, Issue 1, pp.59-77.
UNDERSECRETARIAT for MARITIME AFFAIRS (2000). The Report on Maritime Safety” II. National Conference, İstanbul, pp. 160-163, 190-191.
UNDERSECRETARIAT for MARITIME AFFAIRS (2004). Türk Boğazları Seyir
Güvenliği (Maritime Safety for Turkish Straits),
<http://www.denizce.com/bogazlar.asp 1-6> [Accessed: Aug 15, 2004].
UNDERSECRETARIAT for MARITIME AFFAIRS, (2008). Statistics of Strait of İstanbul , Ankara (10.08.2009).
<http://www.denizcilik.gov.tr/tr/istatistik/2008%20İstatistikleri.xls> [Accessed: Aug, 10.2009].
UNDERSECRETARIAT for MARITIME AFFAIRS, (2009). <http://www.denizcilik.gov.tr/dm/istatistikler/ResmiIstatistikler/istatistik/2009%20 istatistikleri. doc.> (Accessed: Dec, 30, 2009).
UNDERSECRETARIAT for MARITIME AFFAIRS, (2010). The Statistics on Accident Occured in the Strait of İstanbul,
<http://www.denizcilik.gov.tr/dm/istatistikler/DigerIstatistikler/2010> [Accessed: Jan, 15, 2011].
YAZICI, M. A., OTAY, E. N. (2009). A Navigation Safety Support Model for the Strait of İstanbul, Journal of Navigation, Vol 62, Issue 04, pp. 609-630.
YURTÖREN, C. (2004). A Study on Maritime Traffic Management in the Strait of İstanbul, PhD Thesis. Kobe University, Maritime & Transportation System Science.