REVIEW OF CO
2EMISSION AND REDUCING METHODS
IN MARITIME TRANSPORTATION
byKadir MERSIN a*, Irsad BAYIRHAN b, and Cem GAZIOGLU b a International Logistics and Transportation Department,
Istanbul Gelisim University, Istanbul, Turkey
b Department of Marine Environment,
Institute of Marine Sciences and Management, Istanbul University, Fatih, Istanbul, Turkey
Original scientific paper https://doi.org/10.2298/TSCI190722372M
Despite the lowest CO2 emission in terms of payload per unit mile, commercial
ma-rine fleet transport is responsible for approximately 1 billion tonnes of CO2
emis-sions per year and 2.7% of the total global CO2 emission. To keep the world’s
sur-face temperature below critical +2 °C, International Maritime Organization works with alternative methods on a ton / mile basis to reduce existing CO2 emissions. In
this study, these methods are analyzed and their advantages and disadvantages are discussed. The future of CO2 emissions was also investigated.
Key words: ship emissions, Beaufort scale, CO2 emission Introduction
According to the general agreement reached by the world’s leading meteorological experts, the surface temperature of the earth has increased by 0.6 °C in the last 100 years [1]. According to the work of the United Nations Framework Convention on Climate Change (UNFCCC), the average world surface temperature has increased by 0.74 °C since the late 1800s, and in 2100 it is between 1.8 °C and 4 °C unless the necessary measures are taken. It is estimated that there will be a larger increase than expected in any 100 year period [2, 3].
In the globalizing world economy, the need for transportation is constantly increasing, and as a result of the reliance on fossil fuels, the increases in GHG emissions bring about many environmental impacts such as global warming, climate change and ocean acidification. The most environmentally-friendly mode of transport of the transported unit cargo per ton of gas per ton is considered as shipping [4]. However, due to the fact that the global trade demand of up to 90% of the world trade has been carried by sea and the increasing global trade demand also increases the demand for maritime transport in the following years, the limitations and sanctions on the CO2 emissions from man-made GHG as well as other sectors are the necessity
to take control with the application has come to light.
Until 2050, if no emission control is applied and mitigation policies are not estab-lished, the IMO’s medium-term emission scenarios predict that in 2050, merchant-ship emis-sions would increase from 150-250% as a result of growth in world trade [5].
The future emission scenarios of the IPCC suggest that ship-based CO2 emissions will
be higher than twice the value of the existing one in 2050 if no measures are taken [6].
It is predicted that world trade will be accounted for 6% of total global CO2 emissions
by exceeding 1.4 millionnnes by 2020 and increasing ship-source CO2 emissions in line with
increasing transport capacities by 90% and increasing transport capacities [7]. As a result of the study conducted on a statistical approach on the fuel consumption and emissions of the interna-tional maritime trade fleet, total global anthropogenic emissions were reported to be 2.7% CO2,
11% NOx, and 2% SOx [8].
As stated in the United Nations report prepared in the 2007 Intergovernmental Panel on Climate Change in Paris, France, the UN report stated that the world will be a hotter place in 2100, increasing temperatures and their possible effects are listed [2]:
– +2.4 °C: Water shortage will start and in North America the sandstorms can destroy agri-culture. Sea levels will rise and 10 million people in Peru will suffer from water shortages. The coral reefs will disappear. The 30% of the species on the planet will be in danger of extinction.
– +5.4 °C: Sea 5 m and the sea level will be 70 meters. The world’s food stocks will run out. – +6.4 °C: Migrations begin. Hundreds of millions of people will fall on migration routes
in the hope of living inappropriate climatic conditions [2]. To reduce global warming, CO2 emissions from commercial vessels should be reduced urgently. Although the IMO
clearly defines the rules for sulfur oxides released from ship machinery, the rules for CO2 are still under development. The main reason is that the rules related to SOx and NOx are due to their negative effects on the health of the people living in the near en-vironment, ie in the coastal regions, but the rules on their emission the global environ-ment, such as CO2, are not prioritized. However, despite the fact that SO2 has remained
in the atmosphere for about 10 days and the global climate has responded and repaired it over many decades, CO2 has recovered itself over hundreds of years and the atmosphere
has become old. As the percentage of sulfur in the atmosphere is low, SO2 combined
with water in the rain descends to the earth as sulfuric acid (H2SO4). However, since
the CO2 content in the atmosphere is much higher than that of sulphide, there is a lot
more rain and land needed to reduce the amount of CO2 in the atmosphere as carbonic
acid (H2CO3) to the earth, in this context it is called as hundreds of years to clean the
atmosphere. In fact, considering that CO2 has been disposed of in this way, precautions
should be taken in the years before the rules regarding SOx and NOx, since CO2 has been
spreading much longer in terms of the period of self-repair of the atmosphere. Location of commercial ships
in world transportation
Increased number of vessels and growing capacities and emissions caused by sea transport. The company is active in changing the air quality and the global climate. Commercial vessels are one of the most important fuel consumer groups in the world with their high-pow-ered main machines and auxiliary machines and an average of 350 millionns of fuel is con-sumed [9].
Global climate change and GHG
The most important natural GHG are CO2, CH4, diazotmonoxide (N2O), and
The observed increase in anthropogenic GHG emissions in the atmosphere has been continuing since the industrial revolution. Especially, considering the accumulation and resi-dence time in the atmosphere, CO2 emerges among these GHG. Of the most important gases
causing greenhouse effect, CO2 is the most abundant and dominant. The level of accumulation
of CO2 and other GHG in the atmosphere has increased rapidly since the industrial revolution.
Increased GHG accumulation in the atmosphere has led to the use of fossil fuel, deforestation and other human activities. Economic growth and population growth have further accelerated this process [10].
The CO2 has reached the highest value of the last 420000 years and even the last
20 million years with a value of about 375 ppm (one part per million) [2]. In the case that the human-induced increases in CO2 emissions are maintained at the current rate, it is projected
that CO2 accumulation, which was about 280 ppm in the pre-industrial period, 368 ppm in
1998, 375 ppm in 2007, will reach 500 ppm by the end of the 21st century [2]. These increases
in GHG accumulations weaken the cooling efficiency of the earth through long-wave radia-tion, resulting in a positive radiative forcing to warm the earth further. This positive contri-bution the energy balance of the earth and the atmosphere system is called the strengthening greenhouse effect. This means that the natural greenhouse effect, which has been working since hundreds of millions of years with the help of natural GHG (H2O, CO2, CH4, N2O, and
O3) in the Earth’s atmosphere, in other words.
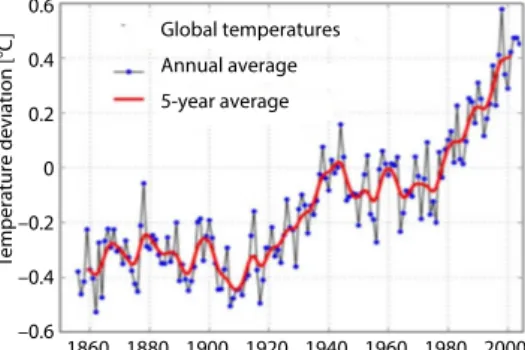
The magnitude of the global warming that may be caused by the strengthening greenhouse ef-fect depends on the extent of the increase in the accumulation of each GHG, the radiative prop-erties of these gases, the atmospheric life span and the accumulation of other GHG in the atmo-sphere. The average temperature of the earth’s surface near the atmosphere increased by 0.6 (±0.2) °C in the 20th century. The widespread
scientific view on climate change is that the rise in temperature over the last 50 years has notice-able effects on human life and is indicated in fig. 1.
Commercial ship emissions
According to IPCC data for 2007 [2], in-ternational sea transport is responsible for 2.7% of total global GHG. In response to the question of the question of which of the long-haul goods it transports for long distances on ships, the transportation of locally produced goods at short distances produces more CO2 emissions, the
re-sponse to the question is given by the fact that the long-distance transported sea transportation
produces less CO2 [11]. This is because the ratio of cargo per ton / km is much higher than that
of the airline or road, and in this context, the amount of CO2 per ton / km per unit cargo is the
lowest in maritime transport and is shown in fig. 2. To illustrate the situation that arises as a result of the literature screening.
Figure 1. Global temperature values, between 1860 to 2000, http://data.giss.nasa.gov
Figure 2. The comparison of the CO2 amount carried for one kilometer carriage of one ton cargo in different transport modes (gram carbon), http://www.worldshipping.org Te m p e ra tu re d e v ia ti o n [ °C ] Global temperatures Annual average 5-year average 0.6 0.4 0.2 0 –0.2 –0.4 –0.6 1860 1880 1900 1920 1940 1960 1980 2000 0 100 200 300 400 500 470 59 21 10 Plane Truck Train Ship (10.000 DWT container)
According to a study by the wine industry, the CO2 emissions during the transfer of a
bottle of French wine sold in a restaurant in New York are less than that of a bottle of wine from California [12]. Similarly, studies on white paper trade for the World Economic Forum have also revealed that the amount of CO2 emitted by a container from China to Europe is equal to
a distance of 200 km in Europe [11]. According to the data of the Swedish Transport Office, a flying Boeing 747-400 airplanes produce 540 g of CO2 per ton / km, while an 8000 Dwt vessel
produces 15 g of CO2 per ton/km of CO2 [13].
Factors regulating ship-based CO2 emissions Alternative fuels
The fuels used in ships are mostly low quality HFO due to their cost reasons and these heavy fuels should be used with heating up to 140 °C and the remaining part of the unexposed fuel should be disposed of as well [14, 15].
The average sulfur content of these fuels is 2.5%. On the other hand, marine fuels con-taining 0.5% sulfur-concon-taining marine diesel fuel or 0.1% sulfur are cleaner fuels. Switching to fuels with a lower sulfur ratio results in lower CO2 emissions.
The IMO’s work on this issue has shown that switching from heavy fuels to marine diesel or gaseous fuels and reducing CO2 emissions by 4-5% in fuel per tonnnage [16]. Due
to its low carbon content, liquefied natural gas (LNG) can be used as an alternative clean fuel. The main component of natural gas, which is abundant in nature, is CH4 and, if used as fuel, it
produces higher energy per unit of carbon compared to petroleum-derived diesel fuels. Natural gas, on the other hand, is a type of fuel that will significantly reduce SOx and NOx emissions. As it does not contain sulfur, it is less than 90% in NOx emissions and particulate matter emissions are almost absent [1]. The carbon content and emission comparisons of the fuel types are given in tab. 1.
Table 1. Carbon amounts in different fuel types [17]
Fuel type Reference Carbon content Diesel ISO8217 Grades DMX 0.875
LFO ISO8217 Grades RMD 0.860 HFO ISO8217 Grades RME 0.850 LPG PropaneButane 0.8190.827
LNG 0.750
However, both the storage of the liquefied form of natural gas on the ships and the ar-rangement of the main machine according to the LNG fuel type and propulsion system instead of the diesel increase the cost. This means storage and storage in insulated cylindrical tanks for storage purposes. Since it can be stored three times more than liquid fuels, it does not seem to be widely used due to technical and safety standards. It has been reported that the use of potential LNG will reduce CO2 emissions by around 25% [1].
Although nuclear propulsion systems are technically feasible, they are not eligible for commercial vessels. Since the carbon in the biofuels is derived from the decomposition of the CO2 in the air, it is preferable to use biofuels instead of fossil fuels in order to prevent the
increase of CO2 in the atmosphere, since the burning of biofuels does not cause an increase in
the net CO2 in the world atmosphere. Due to the inadequacies to be produced in high quantities
because it is also used for human nutritional requirements. In addition, the technical infrastruc-ture for the storage of ships is not yet ready for the first generation of biofuels [1].
Low speed cruising
In the maritime sector, especially in container ships, reducing the speed of navigation has been used as an application frequently used in ships in recent years. When the speed of a ship increases, the water resistance value of the boat increases, and on the contrary, the water resistance value decreases at low speeds, and even a small amount of speed reduction at certain rates contributes greatly to this. fuel economy and energy economy [5]. The CO2 emissions
from ships are directly proportional to fuel consumption.
In general, the high service speed has both advantages and disadvantages. The first advantage is the amount of cargo transported annually. For example, the distance between a ship operating between Algeciras-Barcelona-Valencia-Marseille-Genoa-Gioia Tauro-Istanbul is 4994 miles. The length of a ship with a capacity of 10000 tons at 15 knots is approximately 13 days. Assuming that loading and unloading operations at the ports take one day, the transport time of 10000 tons of cargo will be 24 days in total. This means that approximately 152083.33 tons of cargo are transported annually. If the ship had moved at 20 knots, the service time would have been 21 days in total, meaning 173809.52 tons of cargo would be transported a year.
High-speed fuel consumption also leads to increased CO2 emissions. As a result, speed
is reduced, which results in lower speeds, less energy and fuel consumption, and therefore, less CO2 emissions. The IMO’s work in the world maritime trade fleet has reduced this rate by 10%
and reduced emissions by 23.3% on ships in maritime transport [16]. Reducing ship speed re-duces CO2 emissions. Hapag Lloyd, the world famous ship line, showed a 50% reduction in fuel
consumption with a 20% speed drop on its ships, ie a 5-knot slowdown [16].
Since the amount of cargo to be transported on a certain route with the reduction of the cruising speed will result in fewer cruises per year as a result of the slow moving of the vessels, the low-speed course results in the
operation of additional ships in that rotation. However, this does not mean slow speed, so low consumption. A ship that runs below the optimum speed consumes more fuel than the expected amount of fuel. Possible negative consequences of low-speed operation include vibration increase and problems of accumula-tion in combusaccumula-tion chambers and exhaust sys-tems [18].
Weather routing
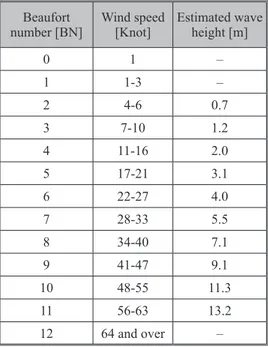
The weather conditions associated with wind and waves as well as the associated cur-rent affect the energy spent on ship dispatch. For this reason, many numerical methods have been developed for the estimation of wind power [19]. One of the methods used among these methods is the Beaufort wind scale. Wave height and wind speed are classified as 0-12. Table 2 shows the Beaufort scale.
Table 2. Beaufort scale
Beaufort
number [BN] Wind speed [Knot] Estimated wave height [m]
0 1 – 1 1-3 – 2 4-6 0.7 3 7-10 1.2 4 11-16 2.0 5 17-21 3.1 6 22-27 4.0 7 28-33 5.5 8 34-40 7.1 9 41-47 9.1 10 48-55 11.3 11 56-63 13.2 12 64 and over –
Let BN is Beaufort number. Townsin and Kwon [18] developed the aforementioned formula for the waves coming from the front:
6.5 0.726 2 3 100% 0.7 217.34e 22. BN BN BN υ υ − = + ∇ ∆
For ballast ships, the formula is (CB = 0.75, 0.80, and 0.85):
6. 2/3 5 100% 0.7 2.7 BN BN υ υ = + ∇ ∆
For full ships (CB = 0.75, 0.80, and 0.85):
6.5 2/3 100% 0.5 2.7 BN BN υ υ = + ∇ ∆
This formula applies to vessels with a displacement of more than 20000 m3 for
con-tainer ships. Here, Δυ speed change, ∇ is the displacement volume of the ship [20].The CB is the coefficient of coefficient is the block coefficient.
Conclusion
According to 2007 data, transportation constitutes 3.3% of total global CO2 emissions
and 1046 millionns of CO2 emissions [21]. Only sea transport is responsible for 2.7% of total
global CO2 emissions with 870 millionns of CO2 emissions [22]. It is estimated that, if no
mea-sures are taken, the CO2 emissions from sea transport will increase to 1475 millionns in 2020
and account for 6% of total global CO2 emissions, despite the fact that there is the greenest
transportation mode and the lowest CO2 emission per unit load per unit [7]. In addition, if other
sectors carry out their own improvements to keep the surface temperature of the earth below +2 °C below the critical temperature of 50%, sea transport is responsible for approximately 12-18% of global CO2 emissions as of 2050 [5]. It aimed to reduce the GHG emissions from
inter-national transport to at least 40% of its value in 1990 by 2020 and to reduce it to values below at least 80% by 2050 [2]. The IMO’s work also predicts that it is possible to increase efficiency and reduce CO2 emissions by 25-75% per tonne/mile depending on the ship type and operation
with the implementation of all measures [5].
During the journey of a ship between two harbors, the amount of CO2 emissions
emitted by the fuel produced by its main machine and auxiliary machines against the sea and air resistance that it is exposed to can be found with certain formulas. It can also be calculated for a continuing process under many other applications, such as taking into ac-count all other external factors between the start of an expedition, the change of ship speed, change of trim and draft, switching to LFO in berthing maneuvers, and port operations. The amount of CO2 released from a ship can also be measured by the carbon content of the fuel
consumed on that ship. Approximately 3.17 ton CO2 is emitted from the burning of one ton
of ship fuel [21]. Acknowledgment
The authors would like to thank Dr. Harun Topaloglu for his invaluable help on this study.
References
[1] ***, IMO, The WMD World Maritime Day 2009, Proceedings, Climate Change: A Challenge for IMO Too, International Maritime Organization, Vol. Background, No. 3, London, pp. 21-25, 2009
[2] Solomon, S., et al., Climate Change 2007 – The Physical Science Basis: Working Group I Contribution the Fourth Assessment Report of the IPCC, Vol. 4. Cambridge Yniversity Press, Cambridge, UK, 2007 [3] Allen, N. M., et al., Framing and Context, in: Global Warming of 1.5 °C, An IPCC Special Report on the
Impacts of Global Warming, in IPCC, 1st ed., (Eds. P. R. S. Masson-Delmotte et al.), Switzerland,
Inter-governmental Panel on Climate Change, 2018, pp. 51-83
[4] ***, ICS, Shipping, World Trade and the Reduction of CO2 Proceedings, Emissions, in COP 18 DOHA
2012, 2012, pp. 1-6.
[5] ***, IMO MEPC 59/4, Prevention of Air Pollution from Ships – Second IMO GHG Study 2009, London, 2009
[6] Eide, M. S., Endresen, Assessment of Measures to Reduce Future CO2 Emissions from Shipping, Res.
Innov., 2010
[7] ***, IMO MEPC 63/23/10, Guidelines On Survey and Certificaiton Of The Energy Efficiency Design Index (EEDI), London, 2012
[8] Endresen, et al., Emission from International Sea Transportation and Environmental Impact, Journal
Geophys. Res. Atmos., 108 (2003), D17
[9] Talay, A. A., et al., Analysis of Effects of Methods Applied to Increase the Efficiency on Ships for Reduc-ing CO2 Emissions, Journal ETA Marit. Sci, 2 (2014), 1, pp. 61-74
[10] Chu Van, T., et al., Global Impacts of Recent IMO Regulations on Marine Fuel Oil Refining Processes and Ship Emissions, Transp. Res. Part D Transp. Environ., 70 (2019), Apr., pp. 123-134
[11] ***, World Shipping Council, Liner Shipping And Carbon Emissions Policy, 2009 [Online], Available: http://www.worldshipping.org/pdf/liner_shipping_carbon_emissions_policy_presentation.pdf
[12] Colman, T., Paster, P., Red, White and Green: The Cost of Carbon in the Global Wine Trade, 2007 [13] ***, IMO, The IMO World Maritime Day, IMO’s Response To Current Environmental Challanges,
Lon-don, 2007
[14] Buhaug, et al., Updated Study on Greenhouse Gas Emissions from Ships: Phase I Report, Int. Marit. Organ., London, UK, Vol. 1, 2008
[15] Buhaug, et al., Second Imo GHG Study 2009, Int. Marit. Organ., London, UK, Vol. 20, 2009
[16] ***, IMO MEPC 61/5/16, Reduction of GHG Emissions From Ships, Further Details on the United States Proposal to Reduce Greenhouse Gas Emissions From International Shipping, London, 2010
[17] ***, IMO MEPC.1 / Circ.681, Interim Guıdelines on the Method of Calculation of the Energy Efficiency Design Index For New Ships, London, 2009
[18] Townsin, R. L., Kwon, Y. J., Approximate Formulae for the Speed Loss Due to Added Resistance in Wind and Waves, 1983
[19] Haddara, M. R., Soares, C. G., Wind Loads on Marine Structures, Mar. Struct., 12 (1999), 3, pp. 199-209 [20] Rawson, K. J., Basic Ship Theory, Vol. 1, Elsevier, Amsterdam, 2001
[21] Faber, J., et al., Going Slow to Reduce Emissions, in: Can the Current Surplus of Maritime Transport
Capacity be Turned into an Opportunity to Reduce GHG Emissions, Seas Risk, Brussels, 2010
[22] ***, IMO MEPC, MEPC 59 Activities on Control of GHG Emissions from Ships Engaged in Internation-al Trade, Proceedings, 2nd Second IMO GHG Study 2009, In the Conference of the Parties Serving as the
Meeting of the Parties to the Kyoto Protocol, 2009
Paper submitted: July 22, 2019 Paper revised: September 7, 2019 Paper accepted: September 10, 2019
© 2019 Society of Thermal Engineers of Serbia Published by the Vinča Institute of Nuclear Sciences, Belgrade, Serbia. This is an open access article distributed under the CC BY-NC-ND 4.0 terms and conditions
![Table 1. Carbon amounts in different fuel types [17]](https://thumb-eu.123doks.com/thumbv2/9libnet/3603495.20689/4.892.244.652.722.865/table-carbon-amounts-different-fuel-types.webp)