MACHINE LEARNING TECHNIQUES IN
BREAST CANCER DETECTION
İNCİ ZAİM GÖKBAY
MACHINE LEARNING TECHNIQUES IN
BREAST CANCER DETECTION
A THESIS SUBMITTED TO THE GRADUATE SCHOOL
OF
THE BAHÇEŞEHİR UNIVERSITY BY
İNCİ ZAİM GÖKBAY
IN PARTIAL FULFILLMENT OF THE REQUIREMENTS FOR THE DEGREE OF MASTER OF SCIENCE
IN
THE DEPARTMENT OF ELECTRICAL AND ELECTRONICS ENGINEERING
Approval of the Graduate School of The Bahçeşehir University
________________
Director
I certify that this thesis satisfies all the requirements as a thesis for the degree of Master of Science
___________________
Head of Department
This is to certify that we have read this thesis and that in our opinion it is fully adequate, in scope and quality, as a thesis for the degree of Master of Science.
_________________
Prof.Dr. Nizamettin AYDIN
Supervisor
Examining Committee Members
Prof. Dr. Nizamettin AYDIN _____________________ ... _____________________ ... _____________________
ABSTRACT
MACHINE LEARNING TECHNIQUES IN
BREAST CANCER DETECTION
Zaim Gökbay, İnci
M.S. Department of Electrical and Electronics Engineering Supervisor: Prof. Dr. Nizamettin AYDIN
August 2007, 41 pages
In recent years there is a considerable increase in breast cancer cases. Although various studies have been done to examine the reasons of this increase, an exact solution has not been found. The mortality of breast cancer is also very high with regard to the other cancer types. Breast cancer incidence is 7.32 per 100.000 in Turkey. Also in Turkey, deaths due to breast cancer constitute 24.1% of all carcinoma cases reported among women in Turkey. In the United States (91.6 per 100.000), breast cancer incidence is relatively high when compared with Turkey.
Early diagnosis saves lives in breast cancer. There are different guidelines for finding breast cancer early in women without symptoms such as breast self-exam (BSE), clinical breast exam, breast awareness and imaging tests (mammograms, MRI, Breast ultrasound, PET scan, CT scan etc.), and biopsy. Among many research, screening mammography is recommended as the most reliable method for early detection of breast cancer. Radiologists carefully search each image for any visual sign of abnormality. However, it could be difficult for radiologists to detect some lesions on mammograms, because abnormalities are often embedded in and camouflaged by varying densities of breast tissue structures. To make easier detection, image processing techniques are being improved.
In this study, I propose a system to detect malignant masses on mammograms. I investigated the behavior of Median at different scales. After median filter was applied, suspicious regions were segmented by means of an adaptive threshold.
Key words: image processing, image segmentation, mammography, breast cancer, tumor detection
ÖZET
MEME KANSERİNDE OTOMATİK ÖĞRENME TEKNİKLERİ
Zaim Gökbay, İnci
Yüksek Lisans, Elektrik-Elektronik Mühendisliği Bölümü Tez Yöneticisi: Prof. Dr. Nizamettin AYDIN
Ağustos 2007 , 41 sayfa
Son yıllarda meme kanseri vakalarında önemli ölçüde artış gözlemlenmektedir. Bu artışın sebeplerini incelemek için birçok araştırma yapılmasına rağmen kesin bir sonuç bulunamamıştır. Meme kanserinin ölüm oranı diğer kanser tiplenine göre daha yüksektir. Türkiye’de meme kanserinin görülme oranı 100.000’de 7.32’dir. Aynı zamanda Türkiye’de kadınlar arasındaki kanser ölümlerinin %24.1’i meme kanserindendir. Amerika Birleşik Devletleri’nde (91.6/100.000) ise meme kanserinin görülme oranı Türkiye’deki oranla karşılaştırıldığında oldukça yüksektir.
Erken teşhis meme kanserinde hayat kurtarmaktadır. Kadınlarda meme kanserinin semptomlara yol açmadan erken teşhisi için kişisel meme testi, klinik meme testi, görüntüleme testleri(mammagromlar, manyetik resonans görüntüleme, meme ultrasonu, PET scan metodu, CT scan metodu vs.) ve biyopsi gibi farklı tanı metodları vardır. Pek çok yöntem arasında, mamografi taraması meme kanserinin erken teşhisinde önerilen güvenilir bir yöntemdir. Radyoloji uzmanları her imgeyi dikkatle inceleyerek anormal görüntü bulguları ararlar. Ancak, radyoloji uzmanı için bazı lezyonları mamografide bulmak zor olabilir, çünkü anormallikler çoğunlukla içe gömülü ya da meme içinde bulunan değişken doku yapıları tarafından kamufle edilmiştir. Bulguyu kolay hale getirmek için, görüntüleme yöntemleri geliştirilmektedir.
Bu çalışmada, kötü huylu kütleleri mamografi görüntüleri üzerinde inceleyen bir system amaçlanmıştır. Farklı ölçeklerde kullanılan median filtre davranışları incelenmiştir. Median filter uygulamasından sonra,şüpheli bölgeler uyarlamalı eşik değeri ile bölüklenmiştir.
Anahtar Kelimeler: görüntü işleme, görüntü bölütleme, mamografi, meme kanseri, tümör algılama
ACKNOWLEDGMENTS
This work would not have been possible without the support and encouragement of Assoc. Prof. Dr. Zafer AKŞİT whom totally changed my vision and my colleague and friend, Mr. Fatih KALELİ, and Prof. Dr. Osman Nuri UÇAN, under whose co-supervision I chose this topic and began the thesis. Prof. Dr. Nizamettin AYDIN, my supervisior has been abundantly helpful, and has helped me in numerous ways.
I would also like to thank the Prof. Dr. İlhami Kovanlıkaya, Dr.M.Halit YILDIRIM and Gökçe YALÇIN who have supported me during this research.
I cannot end without thanking, my husband, on whose constant
encouragement and love. His unflinching courage and conviction will always inspire me, It is to him that I dedicate this work.
TABLE OF CONTENTS
ABSTRACT ... IV TABLE OF CONTENTS... VIII LIST OF FIGURES ... IX CHAPTER 1... 1 1.1 INTRODUCTION ... 1 CHAPTER 2... 4 2.1. INTRODUCTION... 4 2.2. CANCER... 4
2.2.1.THE RISK FACTORS THAT YOU CAN NOT CHANGE... 7
2.2.2.THE RISK FACTORS THAT DEPEND ON LIFE STYLES... 9
2.2.3.UNCERTAIN RISK FACTORS...10
CHAPTER 3...11
3.1. INTRODUCTION ...11
3.2 WHAT IS MEDICAL IMAGING? ...11
3.2.1.PROJECTION RADIOGRAPHY...12
3.2.2.FLUOROSCOPY...15
3.2.3.COMPUTER TOMOGRAPHY (CTSCANNING) ...15
3.2.4.ULTRASOUND...17
3.2.4.MAMMOGRAPHY...19
CHAPTER 4...20
4.1. INTRODUCTION...20
4.2. MATERIAL AND METHODS ...22
4.2.1.DATABASE...22
4.2.2.MEDIAN FILTER...24
4.2.3.OTSUTRESHOLDING METHOD...27
4.2.4.MORPHOLOGICAL CLOSING...31
4.2.5.SUSPECT REGION SEGMENTATION...32
CHAPTER 5...34
5.1 CONCLUSION...34
5.2 FUTURE WORKS ...35
REFERENCES...36
LIST OF FIGURES
Figure 2.1. Invasive and Noninvasive Cancerous Cells... 5
Figure 3.1. Breast Roentgenogram ...12
Figure3.2. Wilhelm Conrad Röntgen ...13
Figure 3.3. A Sample Fluoroscopy...15
Figure 3.4. A Sample Of Computer Tomography...16
Figure 3.6. Scanning Property ...17
Figure 3.5. CT slice through the mid-abdomen showing multiple ...17
Normal-appearing organs, which are labeled. ...17
Figure 3.6. A fetus image ...18
Figure 3.7. Ultrasound...18
Figure 3.9.The image of micro calcifications in digital mammography ...19
Figure 3.10. Mammography Device...19
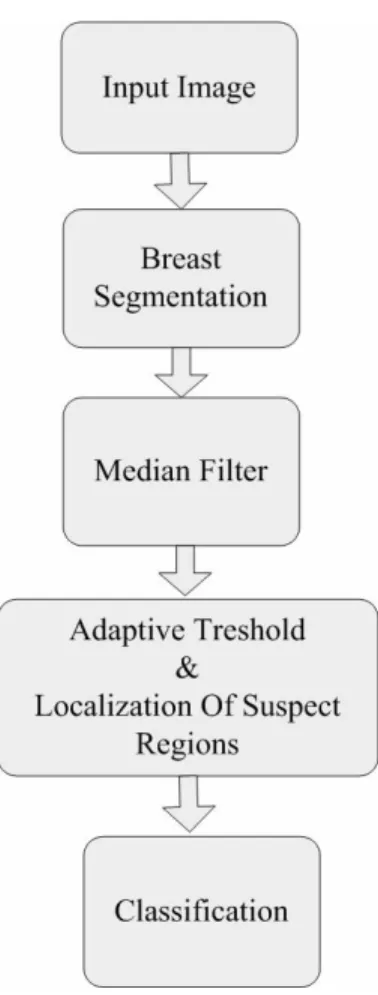
Figure 4. 1. Flow chart of the mass detection algorithm ...22
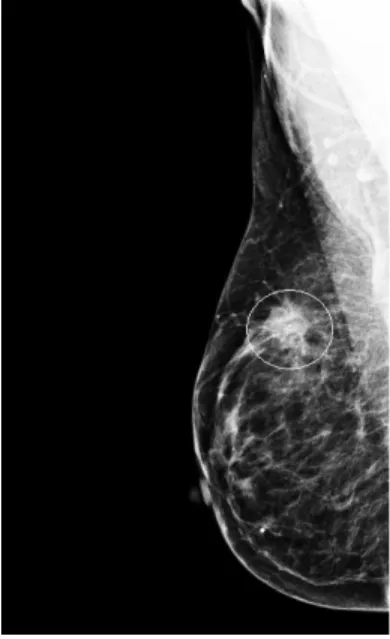
Figure 4.1. Right craniocaudal mammogram with the smallest bounding box (circle) containing the entire lesion considered as ground truth for the evaluation of the detection algorithm. ...23
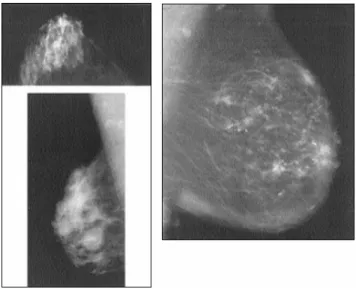
Figure. 4. 2. (a) Left craniocaudal mammogram with a malignant mass, (b) enhanced image after the application of the median filter, (c) binary image with the suspect regions after thresholding, (d) image after morphological closing (e) contours of the detected suspect regions after morphological operations, area tests were applied...24
Figure 4.3. Enhanced image after the application of the median filter, (a) filter size 25 x 25, (b) filter size 45x 45, (c) filter size 55 x 55, (d) filter size 85 x 85, (e) filter size 100 x 100...26
Figure 4.3. Enhanced image after the application of the median filter, (a) filter size 25 x 25, (b) filter
size 45x 45, (c) filter size 55 x 55, (d) filter size 85 x 85, (e) filter size 100 x 100...27
Figure 4.1. Statistical Test Curve for Filter Size Detection ...27
Figure 4.4. (a) Otsu Threshold level applied image, (b) Morphological closing applied after Otsu Threshold level application, (c) Automatical Threshold level applied image, (b) Morphological closing applied after Automatical Threshold level application...31
In Figure 4.6. (a) Morphological closing applied (b) Morphological closing not applied ...32
Figure 4.7. Results for micro-calsifications ...33
Figure 4.8. Results for non-masses ...33
LIST OF ABBREVIATIONS
ROI Region of Interests
CAD Computer Aided Detection
CT Computer Tomography
DICOM Digital Imaging and Communications in Medicine
LCIS Lobular Carcinoma in Situ
CHAPTER 1
1.1 Introduction
There is a considerable increase in the number of breast cancer cases in recent years. It is reported in [1] that breast cancer was the second one among the most diagnosed cancers. It is also stated that breast cancer was the most prevalent cancer in the world by the year 2002. The mortality of breast cancer is also very high with regard to the other cancer types.
Cancer begins with the uncontrolled division of a cell and results in a visible mass named tumour. Tumour can be benign or malignant. Malignant tumour grows rapidly and invades its surrounding tissues through causing their damage. Breast cancer is a malignant tissue beginning to grow in the breast. The abnormalities like existence of a breast mass, change in shape and dimension of breast, differences in the colour of breast skin, breast aches, etc., are the symptoms of breast cancer. Cancer diagnosis is performed based on the non-molecular criterions like tissue type, pathological properties and clinical location [2]. As for the other cancer types, early diagnosis in breast cancer can be life saving.
Currently, screening mammography is recommended as the most reliable method for early detection of breast cancer. Radiologists carefully search each image for any visual sign of abnormality. However, it could be difficult for radiologists to detect some lesions on mammograms, because abnormalities are often embedded in and camouflaged by varying densities of breast tissue structures. Indeed, estimates indicate that between 10 to 30 percent of breast cancers are missed by radiologists during routine screening [2].
The use of machine learning tools in medical diagnosis is increasing gradually. This is mainly because the effectiveness of classification and recognition systems has improved in a great deal to help medical experts in diagnosing diseases. Such a disease is breast cancer, which is a very common type of cancer among woman. As the incidence of this disease has increased significantly in the recent years, machine learning applications to this problem have also took a great attention as well as medical consideration.
Breast cancer outcomes have improved during the last decade with development of more effective diagnostic techniques and improvements in treatment methodologies. Main factor in this trend is the early detection and accurate diagnosis of this disease. The long-term survival rate for women in whom breast cancer has not metastasized has increased, with the majority of women surviving many years after diagnosis and treatment [3]. There is no doubt that evaluation of data taken from patient and decisions of experts are the most important factors in diagnosis. But, expert systems and different artificial intelligence techniques for classification also help experts in a great deal. Classification systems, helping possible errors that can be done because of fatigued or inexperienced expert to be minimized, provide medical data to be examined in shorter time and in more detail.
Thus, several research works have tried to develop computer aided diagnosis tools and to increase the efficiency and effectiveness of screening procedures by using a computer system, as a “second opinion", to aid the radiologist by indicating locations of suspicious abnormalities in mammograms, leaving the final decision regarding the likelihood of the presence of a cancer and patient management to the Radiologist [3-7] .
The aim of this research is to analyze digitized mammograms by applying computer image processing techniques, extract ROIs and classify them as masses or non-masses. Using the intensity values of pixels in mammograms I investigated the behavior of the median filter to detect malignant masses in digitized mammograms when using regions of support of different sizes. The optimal scale was determined and selected to develop my algorithm. Once the images were processed, an adaptive threshold was applied to select and segment potential lesions. Afterward, true masses and normal regions were differentiated using features based on the median filter output, together with gray level, texture, and morphological features.
All the images include the locations of any abnormalities that may be present. The existing data in the collection consists of the location of the abnormality (like the centre of a circle surrounding the tumor), its radius, breast position (left or right), type of breast tissues (fatty, fatty-glandular and dense) and tumor type if it exists (benign or malign).
CHAPTER 2
2.1. Introduction
This chapter deals with the most common form of cancer in females, Breast Cancer. It’s one of the oldest known forms of cancer tumors. Although the term cancer was not used when it was discovered in Egypt dates back to approximately 1600 BC [2]. The Edwin Smith Papyrus, or writing, describes 8 cases of tumors or ulcers of the breast that were treated by cauterization, with a tool called "the fire drill." The writing says about the disease, "There is no treatment." The French surgeon Jean Louis Petit (1674-1750) and later the Scottish surgeon Benjamin Bell (1749-1806) were the first to remove the lymph glands, breast tissue, and underlying chest muscle[1-9]. Their successful work was carried on by William Stewart Halsted who started performing mastectomies in 1882 [1-9]. He became known for his Halsted radical mastectomy, a surgical procedure that remained popular up to the 1970's and was performed on Betty Ford [1-9].
2.2. Cancer
Like the bodies of all animals, the human body, consists of systems that consist of organs that consist of tissues that consist of cells and connective tissue [2-9]. In a healthy body, cells divide rapidly to form organs and growth until the person becomes an adult. After the growing is occurred, cells do not divide to form a new constitution. The main mission of cells in the most parts of the body only to repair injuries, to replace dying cells. In contrary cancer is an illness characterized by a population of cells that grow and divide without respect to normal limits. These cells
destroy adjacent tissues, and may spread to distant anatomic sites through a process called metastasis.
In other words, cancer occurs when a cell in a part of body begins to grow out of control. After this uncontrollable growth, instead of dying, they also outlive normal cells and continue to form new abnormal cells. Cancer cells get into the bloodstream or lymph vessels of our body. This process is called metastasis. By metastasis, cancer cells can spread another organ and forming new uncontrolled cells. Even for example a breast cancer spread all parts of the body its still called the breast cancer. As cancer types changes their behaving changes also [3].
Every cancer type has different grow rate and they respond to different treatments.
Figure 2.1. Invasive and Noninvasive Cancerous Cells
For early stage cancer the term Carcinoma in situ (in SIGH-to) is used. In early stage the cancer is limited to the place where it started. For example in breast cancer, it means that the cancer is confined to the ducts or the lobules, depending on where it started. It has not gone into the fatty tissues in the breast nor spread to other organs in the body [1-6].
Second and the most common type of noninvasive breast cancer is called Ductal carcinoma in situ (DCIS). It means that the cancer is bounded to the ducts. It has not spread through the walls of the ducts into the fatty tissue of the breast. In this stage nearly all women with cancer can be cured. Mammogram is the best way to find DCIS early [1-6].
The condition Lobular carcinoma in situ (LCIS) begins in the milk-making glands but does not go through the wall of the lobules. Having LCIS increases a woman's risk of getting cancer later although not a true cancer. For this reason, women with LCIS should be followed by the screening guidelines for breast cancer [1-6].
The most common breast cancer is Infiltrating (invasive) ductal carcinoma (IDC). It starts in a milk passage or duct, breaks through the wall of the duct, and invades the fatty tissue of the breast. From there it can spread to other parts of the body. IDC is the most common type of breast cancer. It accounts for about 80% of invasive breast cancers [1-6].
The cancer starts in the milk glands or lobules is called Infiltrating (invasive) lobular carcinoma (ILC). It can spread to other parts of the body. About 10% of invasive breast cancers are of this type [1-6].
The cause of breast cancer is not known exactly, but some certain risk factors are known and linked to the disease. A risk factor is anything that increases a person's chance of getting a disease such as cancer. Different cancers have different risk factors. Some risk factors, such as smoking, can be controlled.
Others, like a person's age or family history, can not be changed. But having a risk factor, or even several, doesn’t mean that a person will get the disease. There are three types of risk factors.
1. The Risk Factors that you can not change 2. The Risk Factors that depend on Life styles 3. Uncertain Risk Factors
2.2.1. The Risk Factors that Can Not Be Changed
This kind of risk factors can be divided in to two categories. First category depends on physical condition of body such as; gender, age, race, menstrual periods, genetic risk factors, family history and personal history of cancer. The second category depends on life conditions such as earlier breast radiation, earlier abnormal biopsy and treatment with DES.
Gender Factor: While men can also get the disease, simply being a woman is the main risk for breast cancer. Breast cancer is 100 times more common in women than men [1].
Age Factor: Nearly 8 out of 10 breast cancers are found in women over age 50. This statistical data shows that as women gets older risk goes up [1].
Genetic risk factors: The most common gene changes are those of the BRCA1 and BRCA2 genes. Women with these gene changes have up to an 80% chance of getting breast cancer during their lifetimes [1].
Family history: Having a mother, sister, or daughter or also a close relative from mother’s or father’s side with breast cancer about doubles a woman’s risk [1].
Personal history of breast cancer: A woman with cancer in one breast has a greater chance of getting a new cancer in the other breast or in another part of the same breast (recurrence) [1-3].
Race: White women are slightly more likely to get breast cancer than are African-American women. But African African-American women are more likely to die of this cancer. Many experts now believe that the main reason for this is because they have faster growing tumors. Asian, Hispanic, and American Indian women have a lower risk of getting breast cancer [1-5].
Earlier abnormal breast biopsy: Certain types of abnormal biopsy results can be linked to a slightly higher risk of breast cancer [1].
Earlier breast radiation: Women who have had radiation treatment to the chest area earlier in life have a greatly increased risk of breast cancer [1-5].
Menstrual periods: Women who began having periods early (before 12 years of age) or who went through the change of life (menopause) after the age of 55 have a slightly increased risk of breast cancer [1-5].
Treatment with DES: In the past, some pregnant women were given the drug DES (diethylstilbestrol) because it was thought to lower their chances of losing the baby. Recent studies have shown that these women have a slightly increased risk of getting breast cancer[1-5].
2.2.2. The Risk Factors that depend on Way of Living
Not having children: Who had their first child after age 30, or women who have had not had children have a slightly higher risk of breast cancer. Being pregnant more than once and at an early age reduces breast cancer risk [1].
Birth control pills: It is still not clear what part birth control pills might play in breast cancer risk. Studies have found that women now using birth control pills have a slightly greater risk of breast cancer. Women who stopped using the pill more than 10 years ago do not seem to have any increased risk [1].
Hormone replacement therapy (HRT): It has become clear that long-term use of combined HRT (estrogens together with progesterone) after menopause increases the risk of breast cancer as well as the risk of heart disease, blood clots, and strokes [1].
Breast-feeding and pregnancy: Some studies have shown that breast-feeding slightly lowers breast cancer risk, especially if the breast-feeding lasts 1½ to 2 years [1].
Alcohol: Use of alcohol is clearly linked to a slightly increased risk of getting breast cancer. Women who have 1 drink a day have a very small increased risk. Those who have 2 to 5 drinks daily have about 1½ times the risk of women who drink no alcohol [1-6].
Diet: Being overweight is linked to a higher risk of breast cancer, especially for women after change of life and if the weight gain took place during adulthood. Also, the risk seems to be higher if the extra fat is in the waist area [1-6].
2.2.3. Uncertain Risk Factors
A lot of research is being done to learn how the environment might affect breast cancer risk [1]. While a direct link between these risks and breast cancer has not been found studies suggest stopping them [1-3]. For example, smoking affects your overall health and increases the risk for many other cancers. Underarm antiperspirants can cause breast cancer. Also under wire bras can cause breast cancer. Silicone breast implants can cause scar tissue to form in the breast. But several studies have found that this does not increase breast cancer risk [1-6]. If you have breast implants, you might need a special x-ray picture during mammography [1]. A few recent studies have suggested that women who work at night (nurses on the night shift, for example) have a higher risk of breast cancer [1-3]. But those have not yet been proven. Also, a recent study suggested women who took antibiotics may have a slightly higher risk of breast cancer [1-6].
CHAPTER 3
3.1. Introduction
This chapter deals with the importance of medical imaging systems and early detection of critical illnesses. Today, early detection of critical illnesses such as cancer is playing very important role for saving lives. Detecting such cases at their most curable stage brings more success for treatments. For example, Ultrasound scans can detect dangerous abdominal aneurysms before they burst. Computer Tomography scans can detect 80 percent of lung cancer at its initial and most treatable stage. Mammography identifies breast cancer one to three years before a lump can be felt, early detection reduces the risk of death in women 50 to 69 years of age by 30 percent; in women in their 40s, the risk can drop by 17 percent.
First step of all this growing technology stand on x-ray beams. X-rays are primarily used for diagnostic radiography and crystallography. X-rays are a form of ionizing radiation and as such can be dangerous. In many languages it is called Röentgen radiation after the investigator of the radiation, Wilhelm Röentgen.
In this chapter a short history of X-Rays will be given and characteristics will be examined. Growth and nowadays technologies will be investigated briefly.
3.2 What is Medical Imaging?
Medical Imaging is a process which doctors use for diagnosis and treatments. It’s also called as Clinical Imaging. The medical specialist directing medical imaging is a
The technical aspects of medical imaging are known as radiography and are carried out by the radiographer or radiologic technologist. There are many imaging technologies for different parts of body. For example to examine bones or the lungs the most common technology is projection radiography. Fluoroscopy is used to examine real-time imaging of structures in motion.
Ultrasound scans can detect dangerous abdominal aneurysms before they burst. Computer Tomography scans can detect 80 percent of lung cancer at its initial and most treatable stage. Mammography identifies breast cancer.
3.2.1. Projection Radiography
Projection Radiography is mostly used for imaging the body part which has intensity. Bones or lungs can be given as a good example. For this type of medical imaging the parts which are going to be scanned should have different intensities from each others. To examine whether there exist an inflammation on the lung doctors use projection radiography.
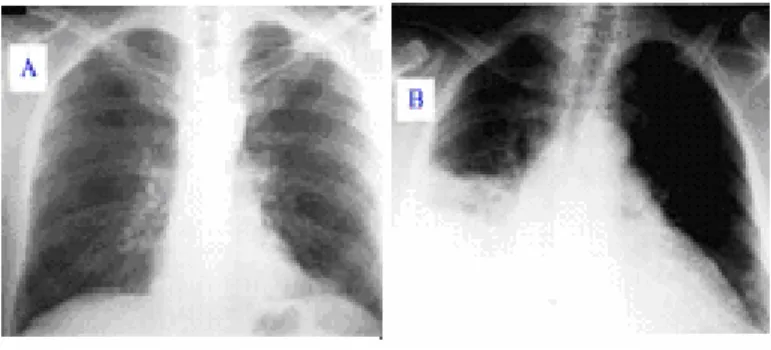
Figure 3.1. Breast Roentgenogram
Figure 1 illustrates of two roentgenograms Image A is a healthy chest but Image B is Q fever pneumonia, an animal disease that can be transmitted to humans caused by the strictly intracellular, gram negative bacterium Coxiella burnetii which proceeds asymptomatic and self-limiting in 60% of the cases.
X-Ray belongs to an electromagnetic radiation family which consists of also light. While light can not pass through human body, X, Gamma and Cosmic rays can. Since 1824 many researchers such as Physicist Johann Hittorf and Wilhelm Conrad Röntgen investigated X-ray beams and their characteristics.
Figure3.2. Wilhelm Conrad Röntgen
X-ray machines work by applying controlled voltage, current, and time to the X-ray tube, which results in a beam of X-rays. Because of the following properties X-rays are used in clinical medicine:
1. Penetration: Actually this is the main reason. From the same family light, day light can not penetrate because of its high level energy; X-rays penetrate the human body and reach roentgen films.
2. Photographic Effect: As light does X-rays affect the photographic films and create images. On the film there is AgBr molecules.
The basic of photographic effect depends on damaging the property of these molecules by photons. The photon is the elementary particle responsible for electromagnetic interactions and light.
3. Fluorescent Effect: Some chemical materials emits fluorescent when they are exposed to x-rays
The body image is obtained by a special film called roentgen film. The roentgen film is covered by AgBr molecules. When the x-ray beams penetrate the human body the photons defect the AgBr molecule on the film. The more intensive parts absorb more electrons so we see bones white on the film. Less intensive parts like lungs, vessels seem to be gray.
In diagnosing some conditions such as a broken bone the roentgen gives a straight forward result. However in some diseases, such as cancer the patients and doctors will not be so lucky, like cancer. The human body has three-dimension but a roentgenogram is a two-three-dimensional film.
This means some organs intensiveness can be the same. In roentgenogram those organs will collapse because of dimension problem and diagnosis will become impossible. For this reason a new technology; Digital roentgen technology, also called Computer Tomography (CT) was introduced.
3.2.2. Fluoroscopy
Fluoroscopy is a special application of X-ray imaging. A fluorescent screen or image intensifier tube is connected to a closed-circuit television system, which allows real-time imaging of structures in motion or augmented with a radio contrast agent.
Radio contrast agents are administered, often swallowed or injected into the body of the patient, to help delineate anatomy such as the blood vessels, the genitourinary system or the gastrointestinal tract.
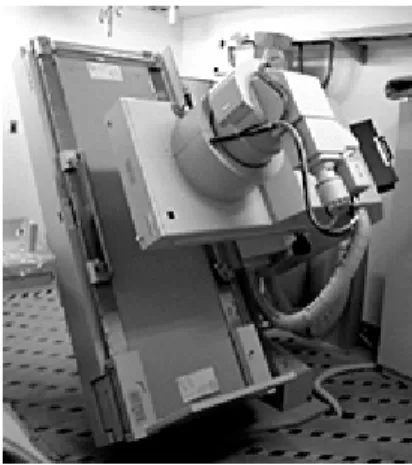
Figure 3.3. A Sample Fluoroscopy
3.2.3. Computer Tomography (CT Scanning)
Computer Tomography is used to take slice image of any part of the body. The word tomography comes from TOMO- slice and Graph means image, simply means slice image of body. Computer tomography uses the very fast x-ray beams. It uses x-rays in conjunction with computing algorithms to image the soft tissues of the body. We can have three-dimensional view of the body parts such as veins and arteries. CT generates more detailed images than x-rays. It provides higher resolution for the
It is composed of three parts; 1. Gantry
2. Cabinets
3. Image processing and operator computer
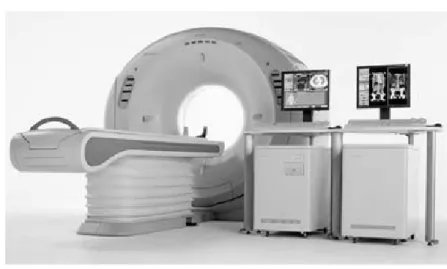
Figure 3.4. A Sample Of Computer Tomography
GANTRY is a big rotatable ring. Gantry has geometry just like a ring. In one side of this ring there is a big cathode X-ray tube and just at the opposite there exists detectors to detect the rays coming from x-ray tube. Gantry rotates with a constant speed and sends a constant period of rays to detectors and sends signals to cabinets to process the image.
Cabinets provide relationship between the image processor computers and the gantry. Image processing computers processes images.
Figure 3.6. Scanning Property
Figure 3.5. CT slice through the mid-abdomen showing multiple Normal-appearing organs, which are labeled.
3.2.4. Ultrasound
Ultrasound is an ultrasound-based (high-frequency sound waves) medical imaging technique. It is a diagnostic medical imaging technique.
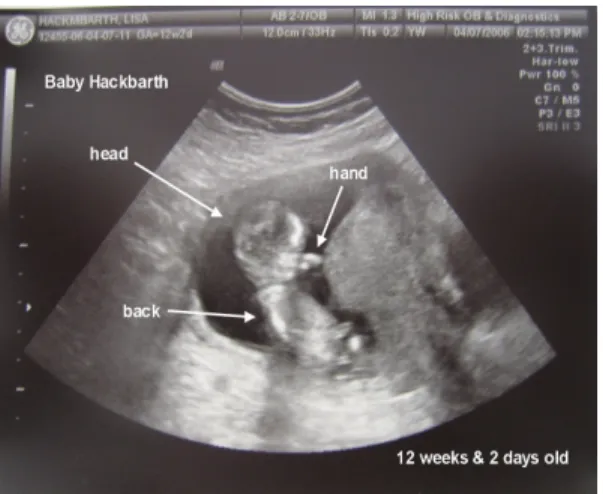
Ultrasound is used to visualize soft tissue structures in the body such as muscles, tendons, and many internal sizes, structure and any pathological lesions. They are also used to visualize fetus during pregnancy.
Figure 3.6. A fetus image
The use of ultrasound in medical imaging has developed mostly within the last 30 years. The first ultrasound images were static and two dimensional (2D), but with modern-day ultrasonography 3D reconstructions can be observed in real-time; effectively becoming 4D. Because ultrasound does not utilize ionizing radiation, unlike x-rays, nuclear medicine, MRI, and CT scans, it is generally considered safer.
3.2.4. Mammography
The most used technology for early detection of breast cancer is mammography. Mammography plays a big role in early diagnosis. It can detect the differences inside the breast before the patient or the doctors realize. Also mammography has been proven to reduce mortality from breast cancer. No other imaging technique has been shown to reduce risk, but self-breast examination (SBE) and physician examination are essential parts of regular breast care.
Figure 3.9.The image of micro calcifications in digital mammography
CHAPTER 4
4.1. Introduction
Computer-aided diagnosis (CAD) has become a part of the routine clinical work for detection of breast cancer on mammograms at many screening sites and hospitals [10–35] . CAD is beginning to be applied widely in the detection and differential diagnosis of many different types of abnormalities in medical images obtained in various examinations by use of different imaging modalities. In fact, CAD has become one of the major research subjects in medical imaging and diagnostic radiology [22–35]. CAD programs have been developed in mammography, with different success, for the detection of either mass lesions or calcification clusters. Mass detection programs generally provide lower performance than those developed to detect microcalcifications. Mass detection poses a difficult challenge because masses vary strongly in size, shape, and density. For these reasons, multiscale studies have been proposed in the literature [36]. Different approaches have been applied for mass detection. In some studies, researchers subtract left image from right one (bilateral subtraction). Their aim was to find asymmetries [37–39]. However, most CAD programs for mass detection use only a single mammogram. Researchers have applied a number of very different processing techniques to prompt masses on mammograms. Li et al. [40] extracted suspicious areas by adaptive thresholding followed by a modified Markov random field model-based method.
Petrick et al. [31] identified potential mass regions with a density weighted contrast enhancement segmentation combined with an object-based region growing technique. They merged morphological and texture features in a linear discriminant analysis classifier to discriminate suspicious regions as either mass or normal breast
segmenting potential masses. A rule-based multilayer topographic feature analysis was then utilized to classify suspect regions.
Some investigators have developed mass detection algorithms based on the analysis of gradient orientation maps. Karssemeijer et al. [43] proposed a statistical analysis of a map of pixel orientations to detect stellate patterns. Guido et al. [46] followed the same approach to detect all type of masses at different scales. Kobatake et al. [44,45] developed an iris filter to detect malignant masses on mammograms. The filter was intended to enhance malignant tumors with very weak contrast to their background; features extracted from the border of the enhanced areas were used to eliminate false positive (FP) detections. Usually, image processing techniques as tumor mass enhancing filters can be applied using different scales [46,45]. In the literature, it has been shown that detection methods have worse performance when the scale is chosen suboptimal [36].
In my thesis, I used the median filter to enhance the tumor-mass lesions. Median filters are the most common ones, for certain types of random noise, they provide excellent noise-reduction capabilities, with less blurring than linear smoothing filters of similar size. I investigated the behavior of the median filter to detect malignant masses in digitized mammograms when using regions of support of different sizes. The optimal scale was determined and selected to develop my CAD algorithm. Once the images were processed, an adaptive threshold was applied to select and segment potential lesions. Afterward, true masses and normal regions were differentiated using features based on the median filter output, together with gray level, texture, and morphological features. The block diagram of the mass detection scheme is represented in Figure. 4.1.
Figure 4. 1. Flow chart of the mass detection algorithm
4.2. Material and Methods
4.2.1. Database
The mammograms used in my study were selected from the files of patients who had undergone biopsy at the hospitals of the health district of Yeditepe University Hospital, Turkey. The selection criterion used by the radiologists was that a biopsy proven malignant mass existed on the mammograms. We selected 10 malignant cases. Therefore, the total number of masses in my database was 150. The location of all biopsy-proven masses was marked by a radiologist.
They were then localized on the digitized images and stored in a “truth” file in the computer by defining the smallest bounding box (circle) containing the entire lesion (Fig. 4.1). Moreover, a set of 12 benign (normal) cases was also collected.
Figure 4.1. Right craniocaudal mammogram with the smallest bounding box (circle) containing the entire lesion considered as ground truth for the evaluation of the detection algorithm.
Database contains very detailed, intensive DICOM files. An intensity image is a data matrix whose values have been scaled to represent intensities. To make better image processing I changed the format to gray format. I converted an arbitrary array of class double to an array of class double scaled to the range [0, 1] by using MATLAB function mat2gray(f).
4.2.2. Median Filter
In medical imaging, penetration of X-ray beams is very important. In breast cancer when the mammogram of breast is taken cancerous cells can be seen white, because masses are characteristic radiopacities of homogeneous nature. Usually, they have a convex shape. Therefore, a mass would appear in a map of gradient orientations as a circular region with many gradients toward the center.
(a) (b) (c) (d) (e)
Figure. 4. 2. (a) Left craniocaudal mammogram with a malignant mass, (b) enhanced image after the application of the median filter, (c) binary image with the suspect regions after thresholding, (d) image after morphological closing (e) contours of the detected suspect regions
after morphological operations, area tests were applied.
Then, it might be expected that the analysis of the gradient-orientation map will be a good method for mass detection. Different authors have proposed gradient-based methods to detect masses in mammograms [23], [24] and [28]. Among them, in my application I used median filter to detect masses in mammograms. The median filter is a non-linear digital filtering technique, often used to remove noise from images or other signals. I prefer to use median filter to remove the patient effected noise. It is the best known order-statistics filter. As its name means, replaces the value of a pixel
by the median value of the gray levels in the neighborhood of that pixel. The original value of the pixel is included in the computation of the median:
( , ) { ( , )} ) , ( g s t median y x f xy S t s ∈ = ( Eq.4.1.)
The median,ξ , of a set of values is such that half the values in the set are less than or equal to ξ, and half are greater than or equal toξ. In order to perform median filtering at a point image, first values of the pixel in question and its neighbours should be sorted. Their median should be determined. This value should be assigned to that pixel. For example, in a 3 x 3 neighborhood the median is the 5th largest value, in a 5 x 5 neighborhood the 13th is the largest value. If there exists same values in a neighborhood, all same values are grouped. Suppose that a 3 x 3 neighborhood has values [10, 20, 20, 15, 25, 20, 20, 20, 100] these values are sorted as [10, 15, 20, 20, 20, 20, 20, 25, 100]. The median result will be 20. The main function of median filters is to force points which distinct gray levels to be more like their neighbors. Isolated clusters of pixels that are dark or light wih respect to their neighbors, and whose are is less than 2/2
n , are eliminated by an n x n median filter. Large clusters
are afected considerably less.
Although masses are considered as homogeneous, tissue inside the breast imposed without integration and the presence of different structures the appearance of masses in a mammogram is not always simple. Original image is shown in Figure 4.1.1. it can be clearly seen that DICOM image is very detailed. Images could contain artifacts, microcalcifications, but also to different structures superimposed when a mammogram is made. Main problem is to pick the masses from the normal tissue. After median filter is applied image becomes blurred so masses became more certain.
To obtain the best filter size, I tested 7 different filter sizes to obtain the best result [25 x 25, 35 x 35, 45 x 45, 55 x 55, 75 x75, 85 x 85, and 100 x 100]. As I expected until 55 x 55 I could not obtain a significant result.
In Figure 4.2. sharp differences between filter results can be seen clearly. But it was very difficult to conclude that more blurred picture will give the best result.
(a) (b) (c) (d) (e)
Figure 4.3. Enhanced image after the application of the median filter, (a) filter size 25 x 25, (b) filter size 45x 45, (c) filter size 55 x 55, (d) filter size 85 x 85, (e) filter size 100 x 100.
To find best filter size I fixed Otsu threshold value and performed a hypothesis test and obtained a statistical curve for satisfaction results. In Figure 4.3. results performed after Otsu threshold and in Table 4.1. statistical curve can be seen.
arithmetric mean arithmetric mean
(a) (b) (c) (d) (e)
Figure 4.3. Enhanced image after the application of the median filter, (a) filter size 25 x 25, (b) filter size 45x 45, (c) filter size 55 x 55, (d) filter size 85 x 85, (e) filter size 100 x 100.
Im _ 1 Im _ 3 Im _ 5 Im _ 7 Im _ 9 Im _ 1 1 Im _ 1 3 25 x 25 90 x 90 0 0.5 1 1.5 2 Satisfaction Image Number/10 Filter Size Filter Size Detection
25 x 25 45 x 45 55 x 55 75 x 75 90 x 90 100 x 100
Figure 4.1. Statistical Test Curve for Filter Size Detection
4.2.3. OTSU Tresholding Method
Potential masses were extracted from the background using a threshold value enhanced to the image. Thresholding is an important technique in image segmentation and machine vision applications.
Otsu Thresholding Method
The basic idea of automatic thresholding is to automatically select an optimal gray-level threshold value for separating objects of interest in an image from the background based on their gray-level distribution.
Automatic thresholding techniques can be roughly categorized into global thresholding and local thresholding. Global thresholding selects a single threshold value from the histogram of the entire image. Local thresholding uses localized gray-level information to choose multiple threshold values; each is optimized for a small region in the image. Global thresholding is simpler and easier to implement but its result relies on good (uniform) illumination. Local thresholding methods can deal with non-uniform illumination but they are complicated and slow. For automated visual inspection applications, where non-uniform illumination is usually not an issue due to controlled lighting conditions, global thresholding is commonly used for its simplicity and speed.
Among the global thresholding techniques, the Sahoo et al. (1988) study concluded that the Otsu method (Otsu, 1979) was one of the better threshold selection methods for general real world images with respect to uniformity and shape measures. This method selects threshold values that maximize between-class variances of the histogram. The Otsu method is optimal for thresholding large objects from the background. In other words, it is good for thresholding a histogram with bimodal or multimodal distribution.
The Otsu method, however, fails if the histogram is unimodal or close to unimodal. Because defect detection applications range from no defect to small and large defects, the gray-level distributions range from unimodal to bimodal. As a result, to
successfully detect defects in the automatic visual inspection applications with the Otsu method, I needed to revise the method so that it will useful with my dataset.
An image can be represented by a 2D gray-level intensity function f(x, y). The value of f(x, y) is the gray-level, ranging from 0 to L − 1, where L is the number of distinct gray-levels. Let the number of pixels with gray-level i be ni and n be the total number of pixels in a given image, the probability of occurrence of gray-level i is defined as:
n n p i
i = ( Eq.4.2.)
The average gray-level of the entire image is computed as:
∑
− = = iL01 iT ip
µ ( Eq.4.3.)
In the case of single thresholding, the pixels of an image are divided into two classes
C1 = {0,1, … , t} and C2 = {t + 1, t + 2, … , L−1}, where t is the threshold value. C1 and C2 are normally corresponding to the foreground (objects of interest) and the background. The probabilities of the two classes are:
∑
∑
− + = = = = 0 2 11 1( ) () L t i i t i pi and t p t ω ω ( Eq.4.4.)The mean gray-level values of the two classes can be computed as:
∑
∑
− = = = = = 0 1 2 11 2 1( ) / () ( ) / () L t i i t i ipi t and t ip t t ω µ ω µ ( Eq.4.5.)Using discriminant analysis, Otsu (1979) showed that the optimal threshold t* can be determined by maximizing the between-class variance; that is:
{
2( )}
t
where the between-class variance σB is defined as: 2 2 2 2 1 1 2
(
)
(
)(
(
)
)
(
)(
(
)
)
T T Bt
ω
t
µ
t
µ
ω
t
µ
t
µ
σ
=
−
+
−
( Eq.4.7.)An equivalent, but simpler formulation for the Otsu method is given in Liao et al. (2001). The simplified formula for obtaining optimal threshold t* is computed as follows:
{
2}
2 2 2 1 1 0 ) ( ) ( ) ( ) (t t t t tArgMax
L t µ ω µ ω + = < ≤ ∗ ( Eq.4.8.)The Otsu method described here can be easily extended to multilevel thresholding of an image (Otsu, 1979 and Liao et al., 2001). For M − 1 threshold, which divides the image pixels into M classes, C1 ~ CM, the optimal thresholds ∗−
∗ ∗ ∗ 1 3 2 1,t ,t ,....,tM t are
chosen by maximizing the between-class variance as follows:
=
∑
= < < ≤ ∗ − ∗ ∗ ∗ − M k k k L t t M t t t t t tArgMax
M 1 2 ... 0 1 3 2 1 , , ..., () ( ) 1 1 µ ω ( Eq.4.9.)The Otsu method works well when the images to be thresholded have clear peaks and valleys—in other words, it works for images whose histograms show clear bimodal or multimodal distributions. I my application I faced with such problem. When Otsu threshold level is directly applied, after morphological closing operation, instead of non-mass area, mass area is eliminated from image. I could not be able to find the correct area as result. To prevent this, I search for the brightest pixel value for each mass. I realized the center pixel value of nearly 80% mass is between 0.600 and 0.675. Than I set a fixed critical value. After filtering operation is done program automatically search the brightest pixel value in breast.
If the brightest pixel value is smaller than critical value, Otsu threshold level is used if bigger than program automatically takes critical value as threshold level.
(a) (b) (c) (d)
Figure 4.4. (a) Otsu Threshold level applied image, (b) Morphological closing applied after Otsu Threshold level application, (c) Automatical Threshold level applied image, (b) Morphological
closing applied after Automatical Threshold level application.
4.2.4. Morphological Closing
Morphological processes were applied to eliminate non mass regions. A closing operation was done to obtain solid, well-defined suspicious mass shapes. Closing operation tends to smooth sections of contours and generally fuses narrow breaks and long thin gulfs, eliminates small holes, and fills gaps in the contour.
The closing set of A by B is simply the dilation of A by B, is defined as:
A•B=( ⊕A B)-B ( Eq.4.9.) which in simple words, says that the closing of A by B is simply the dilation of A by B, followed by the erosion of the result by B.
(a) (b)
In Figure 4.6. (a) Morphological closing applied (b) Morphological closing not applied
4.2.5. Suspect Region Segmentation
The suspect regions surviving the above steps were subjected to an area test. A threshold value was selected in such a way that any true region in the training set was eliminated. Many regions were eliminated by this method since the threshold together with the morphological operations gave very small regions spread evenly throughout the image Figure 4.2.(d) An eccentricity test was also applied.
The eccentricity was estimated as the ratio between the diameter of the corresponding circular region with the same area and the longest axis of the suspect region. Regions with an eccentricity value below 0.38 were eliminated.
This value was selected in such a way that any true lesion was eliminated in the training set. Final representation of program is shown in Figure 4.7. , Figure 4.8 and Figure 4.9
Representation
Original
Figure 4.7. Results for micro-calsifications
Original Representation
Figure 4.8. Results for non-masses
CHAPTER 5
5.1 Conclusion
Breast cancer is one of the leading causes of cancer related mortality among women. A key factor in this trend is the early detection and accurate diagnosis of this disease. The long-term survival rate for women in whom breast cancer has not metastasized has increased, with the majority of women surviving many years after diagnosis and treatment . The experiments on a real mammogram database showed that the definition of the region used to calculate the median filter is an important parameter in the detection of malignant lesions. I propose program to detect malignant masses in digitized mammograms. To enhance rounded convex objects the system uses median filter. This filter is very important in image processing; it can not only remove noise in image, but also preserve detail in image.
I investigated the behavior of the median filter at different scales to detect masses on mammograms. The optimum size to detect masses on mammograms was selected. Gray level information was added to the output of the median filter to improve enhancing of mass regions. Suspicious regions were segmented using an adaptive threshold level in the enhanced image.
The program was developed and evaluated using two completely independent data sets. Performance was evaluated using free response observer characteristic methodology. The scheme was evaluated in a test set consisting on 100 images from 10 malignant cases and 20 normal cases. Results suggest that the proposed method could help radiologists as a second reader in mammographic screening.
5.2 Future Works
In this study, basic and an easy technique to segment a mammogram image is presented. This work could help radiologists as a second reader in mammographic screening. With a project as large and varied as this one, there are numerous areas where new techniques can be tried and incremental improvements can be made. The basic problem with my study was limited case set. If an extensive clinical case set could be available system could be turned to a CAD system with including feature extracting methods, a neural network system and also a reporting algorithm.
In feature extraction method, suspect regions could be segmented in the detection phase were characterized using five types of features: filter features, gray level features, texture features, contour-related features and morphological features. All this data set could be trained in a neural network system to conclude on result.
Patient’s statistical risk factor features such as age, race, having/not having children, breast feeding, using drugs, family and personal history, genetic risk factors, radiation, hormone therapy, using alcohol could also be used for printing a detailed report about the patient’s risk of being breast cancer if no detection is done with image processing method.
References:
[1] http://www.cancer.gov/cancerinfo/ere-workshop-report [2] http://radyoloji.uludag.edu.tr/001.htm [4] http://en.wikipedia.org/wiki/Breast_cancer [5]http://www.cancer.org/docroot/CRI/content/CRI_2_6x_the_history_of_cancer_72 .asp?sitearea=CRI [6] http://www.saglik.gov.tr/extras/birimler/ksdb/2.doc [7] http://marr.bsee.swin.edu.au/lectures/het408/het408.html [8] http://www.cancer.org/downloads/STT/CAFF2005BrF.pdf [9] http://www.atonet.org.tr/turkce/bulten/bulten.php3?sira=501 [10] http://www.ttb.org.tr/kutuphane/cernobil_06.pdf[11] J.E. Tyczynski, F. Bray, D.M. Parkin, Breast cancer in Europe, European Network of Cancer Registries (ENCR), International Agency for Research on Cancer (IARC), vol. 2, December 2002.
[12] H.C. Burrell, D.M. Sibbering, A.R. Wilson, S.E. Pinder, A.J. Evans, L.J. Yeoman, C.W. Elston, I.O. Ellis, R.W. Blamey and J.F. Robertson, Screening interval breast cancers: mammographic features and prognosis factors, Radiology 199 (1996), pp. 811–817.
[13] R. Birdwell, D. Ikeda, K. O’Shaughnessy and E. Sickles, Mammographic characteristics of 115 missed cancers later detected with screening mammography and the potential utility of computer-aided detection, Radiology 219 (2001), pp. 192– 202.
[14] E.L. Thurfjell, K.A. Lernevall and A.A.S. Taube, Benefit of independent double reading in a population-based mammography screening program, Radiology 191 (1994), pp. 241–244.
[15] L. Tabar and P.B. Dean, Teaching Atlas of Mammography, Georg. Thieme, New York (1985).
[16] G.M. te Brake and N. Karssemeijer, Single and multiscale detection of masses in digital mammograms, IEEE Trans. Med. Imaging 18 (1999), pp. 628–639.
[17] A.J. Méndez, P.G. Tahoces, M.J. Lado, M. Souto and J.J. Vidal, Computer-aided diagnosis: automatic detection of malignant masses in digitized mammograms,
[18] A.J. Méndez, P.G. Tahoces, C. Varela, M.J. Lado, M. Souto, J.J. Vidal, Improvement of a mammographic CAD system for mass detection, in: J. Crespo, V. Maojo, F. Martín (Eds.), Medical Data Analysis, Lecture Notes in Computer Science, Springer, Berlin, 2001, pp. 181–185.
[19] F.F. Yin, M.L. Giger, K. Doi, C.J. Vyborny and R.A. Schmidt, Computerized detection of masses in digital mammograms: automated alignment of breast images and its effect on bilateral-substraction technique, Med. Phys. 21 (1994), pp. 445–452. [20] H.D. Li, M. Kallergi, L.P. Clarke, V.K. Jain and R.A. Clark, Markov random field for tumor detection in digital mammography, IEEE Trans. Med. Imaging 14 (1995), pp. 565–576.
[21] N. Petrick, H.P. Chan, B. Sahiner and M. Helvie, Combined adaptive enhancement and region-growing segmentation of breast masses on digitized mammograms, Med. Phys. 26 (1999) (8), pp. 1642–1654.
[22] B. Zheng, Y.H. Chang and D. Gur, Computerized detection of masses in digitized mammograms using single image segmentation and a multi-layer topographic feature analysis, Acad. Radiol. 2 (1995), pp. 959–966.
[23] N. Karssemeijer, Detection of stellate distortions in mammograms using scale space operators. In: Y. Bizais, C. Barrilot and R.D. Paola, Editors, Information
Processing in Medical Imaging, Kluwer, Dordrecht (1995), pp. 335–346.
[24] H. Kobatake, M. Murakami, H. Takeo and S. Nawano, Computerized detection of malignant tumors on digital mammograms, IEEE Trans. Med. Imaging 8 (1999), pp. 369–378.
[25] H. Kobatake and S. Hashimoto, Convergence index filter for vector fields, IEEE
Trans. Image Process. 8 (1999) (8), pp. 1029–1038.
[26] R.M. Nishikawa, M.L. Giger, K. Doi, C.J. Vyborny and R.A. Schmidt, Computer-aided detection of clustered microcalcifications: an improved method for grouping detected signals, Med. Phys. 20 (1993) (6), pp. 1661–1666.
[27] A.J. Méndez, P.G. Tahoces, M.J. Lado, M. Souto, J. Correa and J.J. Vidal, Automatic detection of breast border and nipple in digital mammograms, Comput.
Methods Programs Biomed. 49 (1996), pp. 253–262.
[28] W.P. Kegelmeyer Jr., J.M. Pruneda, P.D. Bourland, A. Hillis, M.W. Riggs and M.L. Nipper, Computer-aided mammographic screening for spiculated lesions,
Radiology 191 (1994), pp. 331–337.
[29] C. Varela, P.G. Tahoces, A.J. Méndez, M. Souto and J.J. Vidal, A set of texture features to differentiate between mass and normal breast tissue on digital mammograms. In: K. Doi, H. MacMahon, M.L. Giger and K.R. Hoffman, Editors,
[30] G.M. te Brake, N. Karssemeijer and J.H.C.L. Hendriks, An automatic method to discriminate malignant masses from normal tissue in digital mammograms, Phys.
Med. Biol. 45 (2000), pp. 2843–2857.
[31] M. Amadasun and R. King, Textural features corresponding to textural properties, IEEE Trans. Syst. Man Cybern. 19 (1989), pp. 1264–1274.
[32] D.E. Rumelhart, G.E. Hinton and R.J. Williams, Learning internal representations by error propagation, Parallel Distributed Processing vol. 1, MIT Press, Cambridge, MA (1986), pp. 318–362.
[33] C.E. Metz, B. Herman and J. Shen, Maximum-likelihood estimation of receiver operating characteristic curve (ROC) curves from continuously-distributed data,
Statist. Med. 17 (1998), pp. 1033–1053.
[34] C.E. Metz, ROC methodology in radiographic imaging, Invest. Radiol. 21 (1986), pp. 720–733.
[35] A.J. Méndez, M. Souto, P.G. Tahoces and J.J. Vidal, Computer aided diagnosis for breast masses detection on a telemammography system, Comput. Med. Imaging
Graph. 27 (2003), pp. 497–502.
[36] N.R. Mudigonda, R.M. Rangayyan and J.E. Desautels, Detection of breast masses in mammograms by density slicing and texture flow-field analysis, IEEE
Trans. Med. Imaging 20 (2001) (12), pp. 1215–1227.
[37] R.M. Nishikawa, M.L. Giger, K. Doi, C.E. Metz, F.F. Yin, C.J. Vyborny and R.A. Schmidt, Effect of case selection on the performance of computer-aided detection schemes, Med. Phys. 21 (1994), pp. 265–269.
[38] R. Campanini, D. Dongiovanni, E. Iampieri, N. Lanconelli, M. Masotti, G. Palermo, A. Riccardi and M. Roffilli, A novel featureless approach to mass detection in digital mammograms based on support vector machines, Phys. Med. Biol. 49 (2004) (6), pp. 961–975.
[40] T.W. Freer, M.J. Ulissey, Screening mammography with computer-aided detection: prospective study of 12,860 patients in a community breast center,
Radiology (2001); pp. 220:781-6.
[41] D.Gur, J.H. Sumkin, H.E. Rockette, M. Ganott, C. Hakim, L. Hardesty, et al, Changes in breast cancer detection and mammography recall rate after the introduction of a computer-aided detection system, J Natl Cancer Inst (2004), pp. 96:185–90.
[42] R.L. Birdwell, P. Bandodkar, D.M. Ikeda, Computer-aided detection with screening mammography in a university hospital setting, Radiology (2005) pp.236:451–7.
[43] T.E. Cupples, J.E. Cunningham, J.C. Reynolds, Impact of computer aided detection in a regional screening mammography program. AJR (2005), pp.185:944– 50.
[44] M.J. Morton, D.H. Whaley, K.R. Brandt, K.K. Amrami, Screening mammograms: interpretation with computer-aided detection-prospective evaluation.
Radiology (2006), pp.239:375–83.
[45] J.C.Dean, C.C. Ilvento, Improved cancer detection using computer-aided detection with diagnostic and screening mammography: prospective study of 104 cancers, AJR (2006), pp.187:20–8.
[46] S.V. Destounis, P. DiNitto, Logan-YoungW, E. Bonaccio , M.L. Zuley, K.M. Willison, Can computer-aided detection with double reading of screening
mammograms help decrease the false-negative rate? Initial experience,
Radiology (2004) pp:232:578–84.
[47] S.A.Butler, R.J. Gabbay , D.A. Kass, D.E. Siedler, K.F. O’Shaughnessy, R.A. Castellino, Computer-aided detection in diagnostic mammography: detection of clinically unsuspected cancers, AJR (2004), pp.183:1511– 5.
[48] R.M. Nishikawa, R.C. Haldemann, J. Papaioannou, M.L. Giger ,P. Lu, R.A. Schmidt, et al, Initial experience with a prototype clinical “intelligent”
mammography workstation for computer-aided diagnosis, Proc SPIE (1995) pp.2434:65–71.
[49] R.A.Schmidt, R.M. Nishikawa, R.B. Osnis, K. Schreibman, M.L. Giger, K. Doi, Computerized detection of lesions missed by mammography, In: Doi K,
Giger ML, Nishikawa RM, Schmidt RA, editors. Digital mammography. Amsterdam: Elsevier Science (1996), pp. 105–10.
[50] L.J. Warren-Burhenne, S.A.Wood, C.J. D’Orsi, et al. Potential contribution of computer-aided detection to the sensitivity of screening mammography,
Radiology (2000), pp. 215:554–62.
[51] M.L. Giger, Z. Huo, M.A. Kupinski, C.J. Vyborny, Computer-aided diagnosis in mammography, In: Fitzpatrick JM, Sonka M, editors. The handbook of
medical imaging. Medical imaging processing and analysis, vol. 2. SPIE; (2000), pp. 915–1004.
[52] M.L. Giger, Computerized analysis of images in the detection and diagnosis of breast cancer Seminars in Ultrasound, CT MRI (2004), pp:25: 411–8.
[53] B.J. Erickson, B. Bartholmai, Computer-aided detection and diagnosis at the start of the third millennium. J Dig Imaging (2002), pp.15:59–68.
[55] R.M. Summers, Road maps for advancement of radiologic computer-aided detection in the 21st century, Radiology (2003), pp.229:11–3.
[56] H. Abe, H. MacMahon, J. Shiraishi, Q. Li, R. Engelmann, K. Doi, Computeraided diagnosis in chest radiography. Seminars in Ultrasound, CT and
MRI (2004), pp. 25:432–7.
[57] Q. Li, F. Li, S.G. Armato III, K. Suzuki, J. Shiraishi , H. Abe, et al, Computer-aided diagnosis in thoracic CT. Seminars in Ultrasound, CT
MRI (2005), pp.26:357–63.
[58] H. Yoshida, A.H. Dachman, Computer-aided diagnosis for CT colonography,
Seminars in Ultrasound, CT MRI (2004), pp.25:404–10.
[59] K. Doi, M.L. Giger, H. MacMahon, et al, Computer-aided diagnosis: development of automated schemes for quantitative analysis of radiographic
images, Seminars in Ultrasound. CT MRI (1992), pp.13:140–52.
[60] K. Doi, H. MacMahon, M.L. Giger, K.R. Hoffmann, Computer aided diagnosis in medical imaging. Amsterdam: Elsevier (1999), pp. 3–560.
[61] K. Doi, H. MacMahon, S. Katsuragawa, R.M. Nishikawa, Y. Jiang, Computeraided diagnosis in radiology: potential and pitfalls, European J Radiology 1999;31:97–109.
[62] K. Doi, Overview on research and development of computer-aided diagnostic schemes. Semin Ultrasound, CT MRI (2004), pp.25:404–10.
[63] K. Doi, Current status and future potential of computer-aided diagnosis in medical imaging, Br J Rad, Special Issue (2005), pp.78:S3–19.
[64] K. Doi, Diagnostic imaging over the last 50 years: research and development in medical imaging science and technology, Phys Med Biol (2006), pp.51:R5–27. [65] G.M. te Brake, N. Karssemeijer, Single and multiscale detection of masses in digital mammograms, IEEE Trans. Med. Imaging 18 (1999),pp. 628–639.
VITA
İnci Zaim Gökbay was born in İstanbul. She received his B.S. degree in Electronics Engineering from the Işık University in 2002. Since 2005 she has been a research assistant in the Department of Electrical and Electronics Engineering. Her main areas of interest are Biomedical Instruments, Hospital Clinical Engineering and Medical Imaging.