BAŞKENT UNIVERSITY
INSTITUTE OF SCIENCE AND ENGINEERING
MICROFLUIDIC BIOSENSORS FOR POINT OF CARE
APPLICATIONS USING ELECTRICAL IMPEDANCE
ANALYSIS AND PORTABLE LENSLESS WIDE-FIELD
MICROSCOPY IMAGING
MEHMET YÜKSEKKAYA
DOCTOR OF PHILOSOPHY THESIS 2017
MICROFLUIDIC BIOSENSORS FOR POINT OF CARE
APPLICATIONS USING ELECTRICAL IMPEDANCE
ANALYSIS AND PORTABLE LENSLESS WIDE-FIELD
MICROSCOPY IMAGING
YERİNDE BAKIM UYGULAMALARI İÇİN ELEKTRİKSEL
EMPEDANS ANALİZİ VE TAŞINABİLİR LENS
GEREKTİRMEYEN GENİŞ ALAN MİKROSKOBİK
GÖRÜNTÜLEME KULLANAN MİKROAKIŞKAN
BİYOSENSÖRLER
MEHMET YÜKSEKKAYA
Thesis submitted
in partial fulfillment of the requirements for the Degree of Doctor of Philosophy
in Department of Electrical-Electronics Engineering at Başkent University
This thesis, titled: “MICROFLUIDIC BIOSENSORS FOR POINT OF CARE APPLICATIONS USING ELECTRICAL IMPEDANCE ANALYSIS AND PORTABLE LENSLESS WIDE-FIELD MICROSCOPY IMAGING”, has been approved in partial fulfilment of the requirements for the degree of DOCTOR OF PHILOSOPHY in ELECTRICAL-ELECTRONICS ENGINEERING, by our jury, on 19/6/2017.
Chairman (Advisor) : Prof. Dr. Mustafa Kocakulak
Member : Assoc. Prof. Dr. İsmail Cengiz Koçum
Member : Assoc. Prof. Dr. Memed DUMAN
Member : Assoc. Prof. Dr. Halil Murat Aydın
Member : Assist. Prof. Dr. Derya Yılmaz
APPROVAL ….../….../…..
Prof. Dr. Murat Emin AKATA Director
BAŞKENT ÜNİVERSİTESİ FEN BİLİMLERİ ENSTİTÜSÜ DOKTORA TEZ ÇALIŞMASI ORİJİNALLİK RAPORU
Tarih: 22 /06 / 2017 Öğrencinin Adı, Soyadı: Mehmet Yüksekkaya
Öğrencinin Numarası: 21020021
Anabilim Dalı: Elektrik-Elektronik Mühendisliği Programı: Doktora
Danışmanın Unvanı/Adı, Soyadı: Prof. Dr. Mustafa Kocakulak
Tez Başlığı: Microfluidic Biosensors for Point of Care Applications Using Electrical Impedance Analysis and Portable Lensless Wide-Field Microscopy Imaging
Yukarıda başlığı belirtilen Doktora tez çalışmamın; Giriş, Ana Bölümler, Sonuç ve Ekler Bölümünden oluşan, toplam 187 sayfalık kısmına ilişkin, 22/06/2017 tarihinde şahsım/tez danışmanım tarafından Turnitin adlı intihal tespit programından aşağıda belirtilen filtrelemeler uygulanarak alınmış olan orijinallik raporuna göre, tezimin benzerlik oranı %8’dir.
Uygulanan filtrelemeler: 1. Kaynakça hariç 2. Alıntılar hariç
3. Beş (5) kelimeden daha az örtüşme içeren metin kısımları hariç
“Başkent Üniversitesi Enstitüleri Tez Çalışması Orijinallik Raporu Alınması ve Kullanılması Usul ve Esaslarını” inceledim ve bu uygulama esaslarında belirtilen azami benzerlik oranlarına tez çalışmamın herhangi bir intihal içermediğini; aksinin tespit edileceği muhtemel durumda doğabilecek her türlü hukuki sorumluluğu kabul ettiğimi ve yukarıda vermiş olduğum bilgilerin doğru olduğunu beyan ederim.
Öğrenci İmzası:
Onay 22/06/2017
ACKNOWLEDGEMENTS
First of all, I would like to thank to my thesis advisor Dr. Mustafa Kocakulak for his advices, guidance and patience. He supported me and gave me the opportunity to be independent in my thesis research. About the Ph. D. study he always encouraged me and put me to the right track.
I am eternally grateful to Dr. Utkan Demirci, for giving me the opportunity to join and carry out this thesis work in his laboratory, Bio-Acoustic-MEMS in Medicine (BAMM) Laboratory (Harvard Medical School, Boston, MA, USA). Dr. Demirci shaped my thesis work and he was like a second advisor for me.
I am also grateful to my supervisors in BAMM LABs, Dr. Waseem Asghar, Dr. Hadi Shafiee and Dr. Fatih İnci they taught me a lot about bioengineering concepts, thanks for their fruitful discussions and advices. I appreciate all the help that I have received from the rest of the group, who are also my friends, Dr. Sinan Güven, Michael Zhang, Muntasir Jahangir, Magesh Sadasivam, Jake Rochman, Mert Keser and Adhithi Rajagopalan. Working in Dr. Demirci’s BAMM LABs was an invaluable experience also I enjoyed the time I spent in his laboratory.
I would like to thank to my Ph.D. candidacy committee members, Dr. İ. Cengiz Koçum and Dr. Derya Yılmaz, they were always ready to help. Also I would like to acknowledge to Dr. Halil Murat Aydın and Memed Duman for accepting to be the jury members for evaluating this thesis.
I appreciate my undergraduate teacher Dr. Mustafa Karaman who first introduced and encouraged me to be a researcher.
I am grateful to all my Rectors Dr. Mehmet Haberal and Dr. Ali Haberal, Dean Dr. Berna Dengiz, Chairman Dr. Ö. Faruk Elaldı and Director of the Institute Dr. M. Emin Akata in Başkent University for supporting my Ph.D. education.
My research visit to BAMM LABs was funded by TUBITAK (The Scientific and Technological Research Council of Turkey) and supported by Başkent University, I am grateful for their support.
Finally and most importantly, to my family, my father İbrahim, my mother Ayşe Özten, my sister Zekiye Ruken, my brother Barış, my nieces Ayşe Pelin and Dicle and my nephew İbrahim Özgür, they are the real supporters, they have loved me unconditionally, they gave me the opportunity to take the best education and I dedicate this doctoral degree to them. I am forever grateful to my family.
ABSTRACT
MICROFLUIDIC BIOSENSORS FOR POINT OF CARE APPLICATIONS USING ELECTRICAL IMPEDANCE ANALYSIS AND PORTABLE LENSLESS WIDE-FIELD MICROSCOPY IMAGING
Mehmet Yüksekkaya
Başkent University, Institute of Science and Engineering, Department of Electrical-Electronics Engineering
Diagnosis and treatment monitoring near patient or point of care (POC) is an essential need. POC tests can be robust, accurate, cost effective, user friendly, specific, deliverable and sensitive according to current needs. POC tests can result faster diagnosis and optimize treatment follow up, they are also crucial for infectious diseases.
HIV/AIDS is a global issue with 36 Million infected person. Most of them are living in developing countries with limited health care resources, there is an urgent need for POC diagnosis and treatment monitoring of HIV/AIDS.
In this thesis first a flexible polymer based microfluidic biosensor using electrical impedance detection for POC HIV-1 virus load diagnosis is developed, second, a microfluidic biosensor and POC diagnosis system using lensless wide-field microscopy imaging for POC CD4+T cell counting is developed for HIV/AIDS monitoring and finally a biopreservation method for increasing the shelf life of POC CD4+T cell counting biosensor at room temperature is engineered.
POC HIV virus load diagnosis biosensor using electrical impedance analysis is able to diagnosis 106 - 108 copies/mL of HIV-1 virus load, it is practical and cost effective, and its electrical model is analyzed in detail.
POC CD4+T cell count system is able to specifically capture and automatically count CD4+T cells in whole blood with the developed novel cell detection and counting algorithm. A lensless wide-field microscope system integrated with a microfluidic cell capturing chip is developed and cell images to be counted are obtained using this microscope.
POC CD4+T cell count biosensor is engineered to increase its shelf life. Biopreservation of multilayer immuno-functionalized surfaces inside a microfluidic chip has been developed using trehalose as a biopreservation agent. That biopreserved biosensors are stored in room temperature and used for tests up two 6 months. Their cell capture accuracy, specificity and precision are almost over 90% and sensitivity is average.
KEYWORDS: Microfluidic biosensor, HIV/AIDS diagnosis, impedance spectroscopy, lensless wide-field microscopy, image processing, biopreservation of microfluidic chips.
Advisor: Prof. Dr. Mustafa Kocakulak, Başkent University, Department of Biomedical Engineering.
ÖZ
YERİNDE BAKIM UYGULAMALARI İÇİN ELEKTRİKSEL EMPEDANS ANALİZİ VE TAŞINABİLİR LENS GEREKTİRMEYEN GENİŞ ALAN MİKROSKOBİK GÖRÜNTÜLEME KULLANAN MİKROAKIŞKAN BİYOSENSÖRLER
Mehmet Yüksekkaya
Başkent Üniversitesi, Fen Bilimleri Enstitüsü, Elektrik-Elektronik Mühendisliği Anabilim Dalı
Hasta başı ve yerinde bakım günümüzde önemli bir ihtiyaçtır. Yerinde bakım testleri mevcut ihtiyaçlara göre sağlam, doğru, düşük maliyetli, kullanıcı dostu, özgül, duyarlı ve iletilebilir olabilir. Yerinde bakım testleri ile hızlı tanı konabilir ve tedavi takibi en iyileştirilebilir, bu testlerin kullanımı bulaşıcı hastalıklar için de çok önemlidir.
HIV/AIDS küresel bir sorundur, dünyada 36 milyon HIV pozitif kişi vardır. Enfeksiyona sahip kişilerin büyük bir çoğunluğu yeterli sağlık bakım olanakları bulunmayan gelişmekte olan ülkelerdedirler. Bu nedenle HIV/AIDS teşhisi ve tedavisinin takibi için pratik, uygun maliyeti ve efektif yerinde bakım testlerine ihtiyaç vardır.
Bu tez çalışmasında ilk olarak, yerinde HIV-1 virüs yükü teşhisi için elektriksel empedans analizi kullanan esnek polimer tabanlı bir mikroakışkan biyosensör geliştirilmiştir. İkinci olarak, yerinde HIV/AIDS takibi için lens gerektirmeyen geniş alan mikroskobik görüntüleme kullanan CD4+T hücrelerinin sayımını yapabilen mikroakışkan biyosensör geliştirilmiştir, son olarak bu sensörlerin oda sıcaklığında saklanabilmesi ve nakliye edilebilmesi ve raf ömrünün arttırılması için bir biyokoruma yöntemi geliştirilmiştir.
İlk çalışmada, tasarlanan biyosensör, elektriksel empedans analizi kullanarak 106 - 108 kopya/mL HIV-1 virüs yükü teşhisi yapabilmektedir. Esnek polimer tabanlı olduğu için basit ve uygun maliyetlidir. Elektriksel modeli detaylı incelenmiştir. İkinci çalışmada, tasarlanan biyosensör, mikroakışkan çip kullanarak kandaki CD4+T hücrelerini yakalar ve lens gerektirmeyen geniş alan mikroskobik görüntüleme kullanarak otomatik sayar. Belirtilen mikroskobik görüntüleme sistemi
uygulanmış ve yeni ve özgün bir hücre belirleme ve sayma algoritması tasarlanmıştır.
Üçüncü çalışmada, ikinci çalışmada tasarlanan mikroakışkan biyosensörün oda sıcaklığında raf ömrü arttırılmıştır. Biyokoruma ajanı olarak trehalose kullanan mikroakışkan kanallar için çoklu tabaka organik yüzey kimyası biyokoruma yöntemi geliştirilmiştir. Bu biyokorunmuş biyosensör 6 ay boyunca test edilmiştir ve hücre yakalama performansları, doğruluk, özgüllük ve hassaslık için yaklaşık %90 oranındadır ve duyarlılık için ortalamadır.
ANAHTAR SÖZCÜKLER: Mikroakışkan biyosensör, HIV/AIDS teşhisi, empedans spektroskopisi, lens gerektirmeyen geniş alan mikroskopi, görüntü işleme, mikroakışkan çiplerin biyokorunması.
Danışman: Prof. Dr. Mustafa Kocakulak, Başkent Üniversitesi, Biyomedikal Mühendisliği Bölümü.
CONTENTS
ABSTRACT ... i
ÖZ ... iii
CONTENTS ... v
LIST OF FIGURES ... ix
LIST OF TABLES ...xxvii
LIST OF ABBREVIATIONS ... xxix
1 INTRODUCTION ... 1 1.1 Thesis Scope ... 1 1.1.1 Motivation ... 1 1.1.2 Objectives ... 2 1.1.3 Walkthrough ... 2 1.1.4 Publications ... 3
1.2 Point of Care Test ... 4
1.3 Biosensor ... 12
1.3.1 Microfluidics based biosensors ... 13
1.3.2 Paper based microfluidic biosensors ... 15
1.4 Surface Functionalization for Cell and Virus Capturing ... 17
1.5 Multilayer Immuno-functionalized Surface Stabilization ... 18
2 HIV – AIDS... 21
2.1 HIV Prevalence... 22
2.2 Structure of HIV-1 ... 23
2.3 HIV Entry into CD4+T Cell ... 24
2.4 Significance of gp-120 ... 26
2.5 HIV/AIDS Diagnosis ... 26
3 IMPEDANCE SPECTROSCOPY ... 29
3.1 Electrochemical Cell ... 29
3.2 Electrical Equivalent Modelling of Electrochemical Cell ... 30
3.2.1 Design of an electrochemical cell ... 30
3.2.2 Equivalent circuit elements ... 31
3.2.2.1 Double layer capacitance ... 32
3.2.2.2 Constant phase element ... 33
3.2.2.3 Charge transfer resistance ... 33
3.2.2.4 Warburg impedance ... 35
3.3 Electrical Equivalent Model of Electrochemical Cell for an Electrode .. 35 v
3.4 Electrical Equivalent Circuit Model for a Full Electrode Electrochemical
Cell System with Two Identical Electrodes ... 40
3.5 Capacitance of Coplanar Electrode System ... 42
3.6 Electrochemical Impedance Spectroscopy Based Biosensors ... 45
4 FLUORESCENCE AND LENSLESS WIDE-FIELD MICROSCOPY ... 48
4.1 Fluorescence Microscopy ... 48
4.2 Lensless Wide-field Microscopy (Shadow Imaging) Principle ... 49
4.3 Image Processing for Object Counting ... 51
4.3.1 Contrast stretching ... 52
4.3.2 Correlation ... 54
4.3.3 Thresholding ... 55
4.3.4 Neighborhood pixel detection ... 56
5 FLEXIBLE POLYMER BASED MICROFLUIDIC BIOSENSOR USING ELECTRICAL IMPEDANCE DETECTION FOR POC HIV VIRUS LOAD DIAGNOSIS ... 57
5.1 Materials and Methods ... 57
5.1.1 Flexible polymer based microfluidic chip development ... 58
5.1.1.1 Electrode layer... 58
5.1.1.2 Channel layer ... 60
5.1.1.3 Inlet layer ... 61
5.1.2 HIV capturing and lysation ... 63
5.1.2.1 Magnetic bead surface functionalization ... 65
5.1.2.2 HIV capturing ... 66
5.1.2.3 HIV lysate sample preparation... 67
5.1.3 Electrical Impedance spectroscopy analysis ... 68
5.1.3.1 Electrical Impedance spectroscopy analysis setup... 68
5.1.3.2 Representation methods of impedance results ... 69
5.2 Experiments and Results ... 70
5.2.1 Electrical equivalent model for flexible polymer based microfluidic chip ... 71
5.2.2 Impedance measurements ... 71
5.2.2.1 Impedance measurement for empty channel ... 71
5.2.2.2 Impedance measurement for DI pure water ... 77
5.2.2.3 Impedance measurements for solutions with already known conductivities ... 79
5.2.2.4 Impedance measurements for HIV lysate in PBS ... 84
5.2.2.5 Time dependency test of the method ... 88 vi
5.2.2.6 Lower concentration of virus diagnosis test using the method ... 90
5.2.2.7 Specificity test of the method ... 92
5.2.2.8 Impedance measurements for HIV lysate in plasma ... 97
5.2.2.9 Impedance measurements for HIV lysate in blood ... 100
5.3 Conclusion ... 103
6 MICROFLUIDIC BIOSENSOR USING LENSLESS WIDE FIELD MICROSCOPY IMAGING FOR POC CD4+T CELL COUNTING ... 106
6.1 Materials and Methods ... 106
6.1.1 Microfluidic chip development ... 106
6.1.1.1 Bottom glass layer ... 107
6.1.1.2 Channel layer ... 107
6.1.1.3 Inlet and outlet layer ... 108
6.1.2 Microfluidic channel surface functionalization for cell capture ... 110
6.1.2.1 Bottom layer glass surface functionalization ... 112
6.1.2.2 CD4+T cell capturing ... 115
6.1.3 Obtaining initial amount of CD4+T cells... 116
6.1.4 Counting cells inside channels under microscope ... 119
6.1.4.1 Staining of CD4+T cells ... 120
6.1.4.2 Manual counting of cells ... 121
6.1.4.3 Performance Evaluation of CD4+T Cells Counting ... 121
6.1.5 Counting cells inside channels using lensless wide-field microscopy system ... 123
6.1.5.1 Lensless wide-field microscopy system development ... 123
6.1.6 Cell counting program ... 129
6.1.6.1 Sample image taken by the system ... 129
6.1.6.2 First program: Obtaining averaged model cell image ... 132
6.1.6.3 Adaptive linear histogram stretching ... 134
6.1.6.4 Averaged model cell image ... 138
6.1.6.5 Second program: Cell detection using correlation ... 140
6.1.7 Automatic counting of cells ... 146
6.2 Experiments and Results ... 146
6.2.1 Testing the microfluidic chip ... 146
6.2.2 Optimizing surface functionalization ... 148
6.2.3 Cell capturing performance ... 149
6.2.4 Cell counting under microscope ... 152 vii
6.2.5 Cell counting using lensless wide-field microscopy system and cell
counting program ... 155
6.3 Conclusion ... 160
7 ENGINEERING A METHOD FOR INCREASING SHELF LIFE AT ROOM TEMPERATURE OF A MICROFLUIDIC POC BIOSENSOR ... 162
7.1 Materials and Methods ... 162
7.1.1 Functionalized groups stabilization method ... 162
7.1.2 Microfluidic chip drying methods... 163
7.1.3 Microfluidic chip preservation method ... 168
7.2 Experiments and Results ... 170
7.2.1 Performance of microfluidic chip drying methods ... 170
7.2.2 Cell capturing performance of stabilized microfluidic chips ... 172
7.3 Conclusion ... 175
8 CONCLUSION AND DISCUSSION ... 177
REFERENCES ... 180
APPENDIX ... 193
LIST OF FIGURES
Figure 1.1 Some commercially available POCT technologies. a) Alere INRatio® 2 PT/INR Monitoring System is used for anticoagulation monitoring and management by measuring Prothrombin Time/International Normalized Ratio (PT/INR) [2]. b) The Clearview® Malaria Combo is a method for testing, the presence of plasmodium falciparum, plasmodium vivax, plasmodium malariae and plasmodium ovale antigens in whole blood [3]. c) Alere Determine™ HIV 1/2 Ag/Ab Combo is used to detect free non immuno-complexed HIV p24 antigen (Ag), and antibodies (Ab) for HIV-1 and HIV-2 in human serum, plasma or whole blood (Alere Inc.) [4]. d) Accu-Chek® Aviva is a compact blood glucose meter (Copyright © F. Hoffmann-La Roche Ltd.) [5]. e) Astute140® Meter and NephroCheck® test card are for detecting biomarkers of acute kidney injury (AKI), TIMP-2 and IGFBP-7 (Astute Medical, Inc.) [6]. f) BD Veritor™ System is and influenza test for detection of Flu A+B (Becton Dickinson and Company. © 2015 BD) [7]. ... 4 Figure 1.2 Conventional laboratory testing versus point of care testing. a) Ordered
test added on the system, b) sample collected by specialist, c) sampled labeled and sent to the laboratory, d) test performed by specialist, e) results reported and archived, f) results send to the patient and clinicians and g) simple point of care test in which the results obtained instantly. 6 Figure 1.3 The infrastructure and operation requirements for a microfluidics
biological test using a) a research purpose testing device, b) POCT device and c) Central laboratory test device. d) Radar charts compares the instrument cost, size, weight, multiplexing ability, required test time, specialist expertise and cost for the test. [16], [17] ... 7 Figure 1.4 General trend in biological tests (Adopted from [19]) ... 8 Figure 1.5 Components of a biosensor. ... 12 Figure 1.6 The process for traditional labs and microfluidics lab-on-a-chip device.
(influenced form [40]) ... 14 ix
Figure 1.7 An example of microfluidic a lab-on-a-chip device for DNA analysis, it is integrated the microfluidics and electronics. [43] ... 15 Figure 1.8 An example of a paper based bioassay by Martinez et al. [50] a) The
Waterman ink absorbs by capillary action to the photolithography patterned channels in a chromatography paper. b) The assays are filled with reagents, the square is protein test, the circular on the left is glucose test and the other circular on the top is control well. c) As a negative control an artificial urine used. d) The positive assay used with glucose and protein (bovine serum albumin) in an artificial urine solution. e) Colorimetric assay results for different concentrations of glucose and protein. ... 16 Figure 1.9 An example of a printed flexible plastic microchip. Silver electrodes are
patterned using screen printing and channel is formed using a double sided adhesive (DSA) tape. [49] ... 17 Figure 1.10 Scanning electron microscope (SEM) images of two examples of affinity
chromatography based capturing. In both, surfaces are functionalized by sample specific antibody. a) HIV’s are immobilized in glass surface. [53] b) Breast cancer cell is immobilized on graphene oxide surface. [54] ... 18 Figure 2.1 A scanning electron microscope (SEM) image of an HIV infected
lymphocyte (red). After culturing of virus and lymphocyte, virus reproduce itself and the HIV-1 virions (green) are budding from the lymphocyte. (Center for Disease Control and Prevention (CDC), Public Health Image Library (PHIL), ID#:10000) [91] ... 21 Figure 2.2 Adult HIV Prevalence by countries in 2007. (Adopted from [100]) ... 23 Figure 2.3 The structural representation of HIV virion. (Splettstoesser, Thomas
(www.scistyle.com) ) [103] ... 24 Figure 2.4 HIV-1 entry into CD4 T cells and its life cycle (National Institute of Allergy
and Infectious Diseases (NIAID)) [108] ... 25 x
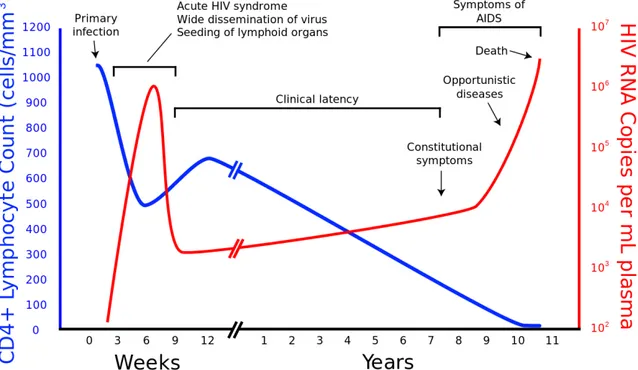
Figure 2.5 Diagnostic markers of HIV. Their levels in blood according to time, start by infection. The timing of the efficiency of the tests from first to fourth generation tests and nucleic acid amplification test (NAAT). (adopted from [109] and [110]) ... 26 Figure 2.6 The relation of HIV viral load and CD4+T cell count according to the
progress of infection. [111]... 27 Figure 3.1 Simple two electrode electrical impedance measurement system for
solutions, VAC is AC voltage source A is an ampere meter. ... 29 Figure 3.2 Example of a two parallel electrode system for calculation of resistance
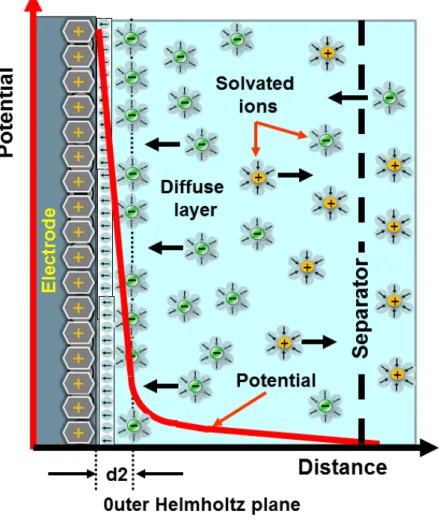
(Equation (3.1)) and capacitance (Equation (3.2)), l is the distance between parallel electrodes, and A is the area of the electrodes. ... 30 Figure 3.3 Different electrode configurations, a) forward looking electrode, b) co-planar electrodes, c) Interdigitated electrodes. ... 31 Figure 3.4 Electrode in contact with an electrolyte. Electrical double layer (Helmholtz
plane), and a diffuse layer formation. [124] ... 34 Figure 3.5 The electrode electrolyte interface, ion behaviors and its equivalent
electrical circuit model. This electrical equivalent model for an electrode is called Randles electrical equivalent circuit model. CDL is the double layer capacitance, RCT is the charge transfer resistance, ZW is the Warburg impedance and Rsol is the bulk resistance. ... 36 Figure 3.6 Bode plot of impedance magnitude against frequency for Randles
electrical equivalent circuit model. ... 38 Figure 3.7 Bode plot of impedance phase against frequency for Randles electrical
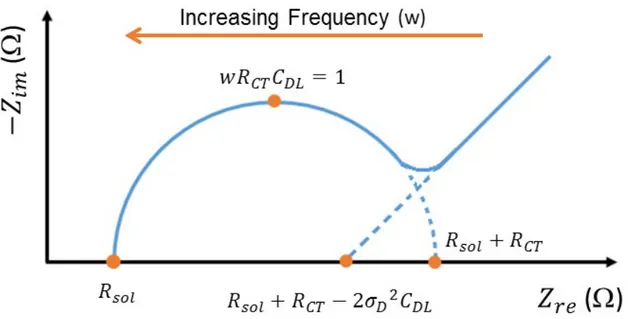
equivalent circuit model. ... 39 Figure 3.8 Nyquist plot of Randles electrical equivalent circuit model’s frequency
response. Zre is real impedance and Zim is imaginary impedance... 39 Figure 3.9 Randles electrical equivalent circuit model for each interface component
in an electrochemical cell with CPE constant phase element instead of xi
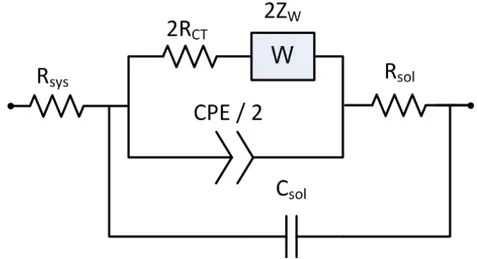
CDL double layer capacitance. RCT is the charge transfer resistance, ZW is the Warburg impedance and Rsol is the bulk resistance. ... 40 Figure 3.10 Electrical equivalent circuit model for a full electrode electrochemical
cell system with two identical electrodes. The circuit model composed of two Randles equivalent circuits. CPE is constant phase element, RCT is the charge transfer resistance, ZW is the Warburg impedance, Rsol is the bulk resistance, Csol is the bulk capacitance and Rsys is the ohmic resistance of the electrical wiring. ... 41 Figure 3.11 A simplified electrical equivalent circuit model representation for full
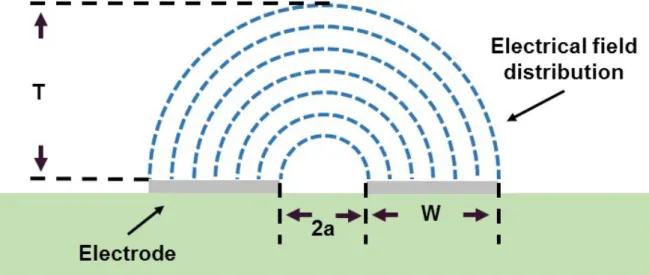
electrode electrochemical cell system with two identical electrodes. . 41 Figure 3.12 The geometry and capacitances for coplanar electrode system. The
cross section of electrochemical cell system is shown. The gap between electrodes and width of electrode are 2a and W respectively. The height of top material, inside solution, and bottom material are hTM, hIN, and hBM respectively. The capacitance of top material, inside solution, and bottom material are CTM, CIN, and CBM respectively. ... 43 Figure 3.13 Electrical field distribution for coplanar electrodes, T is the field
penetration depth. ... 44 Figure 3.14 Electrical field distribution for coplanar electrodes, when channel height
is lower than the electrode width (W). ... 45 Figure 4.1 Principle of fluorescence microscopy. [152] ... 49 Figure 4.2 A simplified demonstration of lensless wide-field microscopy (Shadow
imaging) principle. ... 50 Figure 4.3 a) A raw shadow images of cells and b) its histogram. ... 52 Figure 4.4 Piecewise linear transformation function used for contrast stretching. 53 Figure 4.5 a) Contrast stretched image of the image given in Figure 4.3 a). b)
Histogram of the contrast stretch image. The transformation is applied xii
using the piecewise contrast stretching transformation function given in Figure 4.4. ... 53 Figure 4.6 Cross correlation example. a) Image with objects in it, b) image of the
similar object, c) 3D plot of cross correlation results where peaks indicates the center of the objects in image and d) the 2D plot of cross correlation results. x, y Axis are the spatial coordinates of image, z axis in c) and color bar in d) indicates the cross correlation result with an arbitrary unit. ... 54 Figure 4.7 Piecewise linear transformation function used for thresholding with a
threshold value of 150. ... 55 Figure 5.1 The three layers of flexible polymer based microfluidic chip (FFchip).
From to bottom to top: the electrode layer, channel layer and inlet layer. ... 58 Figure 5.2 The CAD design of mask for screen printing of electrodes. ... 59 Figure 5.3 The screen printing process for fabricating electrode layer. a) Placing the
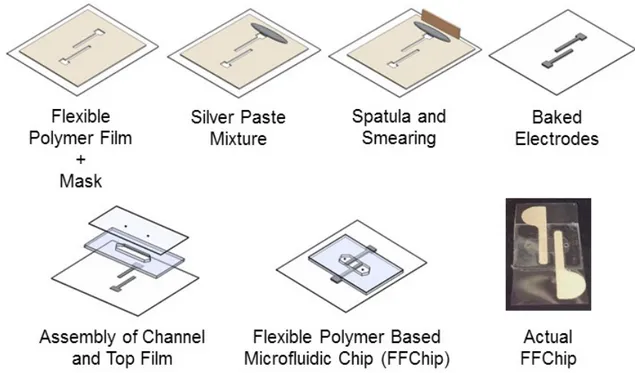
mask on the flexible polymer film, b) dropping some silver paste mixture, c) spreading the paste, d) after spreading the open spaces in the mask is filled with paste. ... 59 Figure 5.4 The CAD design of channel. ... 60 Figure 5.5 The CAD design of inlet layer. ... 61 Figure 5.6 The fabrication process of flexible polymer based microfluidic chip
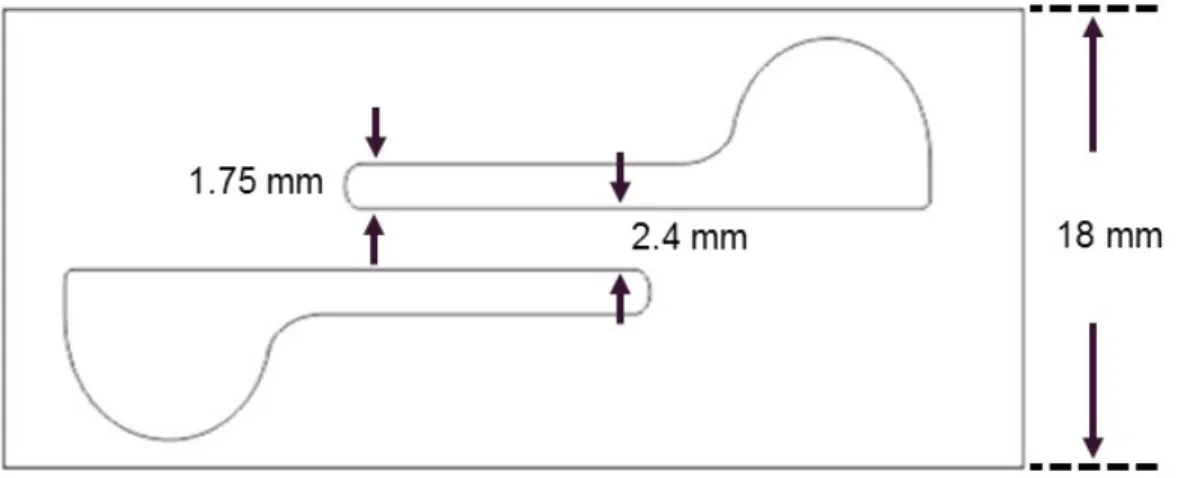
(FFChip). ... 62 Figure 5.7 The flexible polymer based microfluidic chip (FFChip). ... 62 Figure 5.8 The actual dimensions for lateral cross section of FFChip shown in Figure
5.7 after laser cutting of layers and drying of electrodes. ... 63
Figure 5.9 The model representation of a) Streptavidin coated magnetic bead, b) streptavidin on the surface of the bead, c) Biotinylated anti-gp120 antibody, and d) Human immunodeficiency virus (HIV). ... 64 Figure 5.10 Washing steps of magnetic beads. a) Bead are in the solution ready to
wash, b) tube is stand to the magnetic separator, beads are get together close to magnet, c) solution is pipetted out, d) tube without solution but with beads only, e) tube is removed from the magnetic separator and new solution is pipetted in to the tube, f) new solution and beads are mixed together and g) mixed final solution... 65 Figure 5.11 The anti gp120 antibody conjugation to streptavidin-coated magnetic
bead. a) Incubation of magnetic beads with antibodies, b) The avidin + biotin binding, c) conjugated antibody. ... 66 Figure 5.12 HIV capturing, a) the magnetic beads are suspended in HIV media
culture for incubation, b) the viral envelope protein gp120 binding with anti gp120 antibody which is conjugated on the magnetic bead surface, c) Magnetics bead with immobilized HIV on its surface. ... 67 Figure 5.13 The HIV lysate preparation and injection to FFChip. a) Magnetic beads
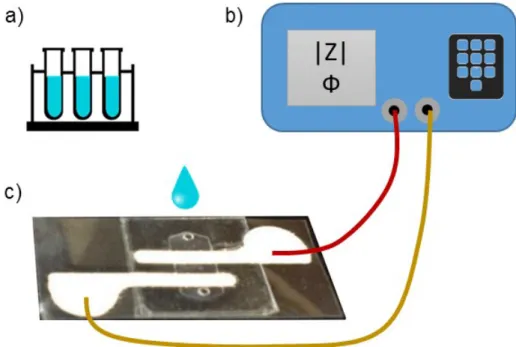
with immobilized HIV in biological model sample is washed 3 times with nonconductive 20% glycerol solution in DI pure water, b) lysation of HIV by suspending the beads in 1% Triton x-100 and incubating for 5 min, c) separation of lysate from beads using magnetic separator and d) injection of lysate in FFChip for impedance spectroscopy measurements. ... 68 Figure 5.14 Electrical impedance measurement setup for FFChip. a) Solutions, b)
LCR meter, c) FFChip. ... 69 Figure 5.15 Coplanar electrode configuration and its electrical equivalent circuit
representation for flexible polymer based microfluidic chip. ... 71 Figure 5.16 Impedance magnitude spectra of FFChips with empty channel for a
frequency range between 100 Hz and 1 MHz. ... 72 xiv
Figure 5.17 Impedance phase spectra of FFChips with empty channel for a frequency range between 100 Hz and 1 MHz. ... 73 Figure 5.18 Capacitance spectra calculated using the impedance magnitude and
phase data of FFChips with empty channel when the equivalent circuit model is just a resistor parallel to a capacitor. ... 73 Figure 5.19 Impedance magnitude spectra of DI pure water for a frequency range
between 100 Hz and 1 MHz. ... 77 Figure 5.20 Impedance phase spectra of DI pure water for a frequency range
between 100 Hz and 1 MHz. ... 78 Figure 5.21 Nyquist plot of impedance value of DI pure water for a frequency range
between 100 Hz and 1 MHz. ... 78 Figure 5.22 Conductivity values for solutions with different PBS concentration. .. 79 Figure 5.23 Resistivity values for solutions with different PBS concentration. ... 80 Figure 5.24 Impedance magnitude spectra of control and solutions with different
PBS concentration for a frequency range between 100 Hz and 1 MHz. ... 80 Figure 5.25 Impedance phase spectra of control and solutions with different PBS
concentration for a frequency range between 100 Hz and 1 MHz. .... 81 Figure 5.26 Nyquist plot of impedance value of control and solutions with different
PBS concentration for a frequency range between 100 Hz and 1 MHz. ... 81 Figure 5.27 Impedance magnitude values of control and solutions with different PBS
concentration at 1 kHz. Error bars are STD of the mean of impedance magnitude (n=3)... 82 Figure 5.28 Normalized impedance magnitude values of solutions with different PBS
concentration to the mean of impedance magnitude of control at 1 kHz.
Error bars are STD of the mean of normalized impedance magnitude (n=3). ... 83 Figure 5.29 Repeatability of normalized impedance magnitude measurements of
control and solutions with different PBS concentration at 1 kHz. Error bars are STD of the mean of normalized impedance magnitude (n=3). ... 83 Figure 5.30 Impedance magnitude spectra of control and lysed HIV subtypes (A, B,
C, D, E, G and Panel) for a frequency range between 100 Hz and 1 MHz. ... 84 Figure 5.31 Impedance phase spectra of control and lysed HIV subtypes (A, B, C,
D, E, G and Panel) for a frequency range between 100 Hz and 1 MHz. ... 85 Figure 5.32 Nyquist plot of impedance value of control and lysed HIV subtypes (A,
B, C, D, E, G and Panel) for a frequency range between 100 Hz and 1 MHz. ... 86 Figure 5.33 Impedance magnitude values of control and lysed HIV subtypes (A, B,
C, D, E, G and Panel) at 1 kHz. Error bars are STD of the mean of impedance magnitude (n=3). ... 86 Figure 5.34 Normalized impedance magnitude values of lysed HIV subtypes (A, B,
C, D, E, G and Panel) to the mean of impedance magnitude of control at 1 kHz. Error bars are STD of the mean of normalized impedance magnitude (n=3)... 87 Figure 5.35 Repeatability of normalized impedance magnitude measurements of
control and lysed HIV subtypes (A, B, C, D, E, G and Panel) at 1 kHz. Error bars are STD of the mean of repeatability (n=3). ... 88 Figure 5.36 Impedance magnitude spectra of control at different time interval after
prepared (0, 20, 40, 60 and 80 min). ... 89
Figure 5.37 Impedance magnitude values of control at different time interval after prepared (0, 20, 40, 60 and 80 min) at 1 kHz. Error bars are STD of the mean of impedance magnitude (n=3). ... 89 Figure 5.38 Impedance magnitude values of control and lysed HIV subtype D with
a concentration of 2.9 × 10⁶ copies/mL at 1 kHz. Error bars are STD of the mean of impedance magnitude (n=3). ... 90 Figure 5.39 Normalized impedance magnitude values of lysed HIV subtype D with
a concentration of 2.9 × 10⁶ copies/mL to the mean of impedance magnitude of control at 1 kHz. Error bars are STD of the mean of normalized impedance magnitude (n=3). ... 91 Figure 5.40 Repeatability of normalized impedance magnitude measurements of
control and HIV subtype D with a concentration of 2.9 × 10⁶ copies/mL at 1 kHz. Error bars are STD of the mean of repeatability (n = 3). ... 92 Figure 5.41 Impedance magnitude spectra of control, HIV subtype A, EBV and HIV
subtype A + EBV, for a frequency range between 100 Hz and 1 MHz. ... 93 Figure 5.42 Impedance phase spectra of control, HIV subtype A, EBV and HIV
subtype A + EBV, for a frequency range between 100 Hz and 1 MHz. ... 94 Figure 5.43 Nyquist plot of impedance value of control, HIV subtype A, EBV and
HIV subtype A + EBV, for a frequency range between 100 Hz and 1 MHz. ... 94 Figure 5.44 Impedance magnitude values of control, HIV subtype A, EBV and HIV
subtype A + EBV, at 1 kHz. Error bars are STD of the mean of impedance magnitude (n=3). ... 95 Figure 5.45 Normalized impedance magnitude values of HIV subtype A, EBV, and
HIV subtype A + EBV, to the mean of impedance magnitude of control at 1 kHz. Error bars are STD of the mean of normalized impedance magnitude (n=3)... 96
Figure 5.46 Repeatability of normalized impedance magnitude measurements of control, HIV subtype A, EBV and HIV subtype A + EBV, at 1 kHz. Error bars are STD of the mean of repeatability (n=3). ... 96 Figure 5.47 Impedance magnitude spectra of control and lysed HIV subtype C
spiked in plasma, for a frequency range between 100 Hz and 1 MHz. ... 98 Figure 5.48 Impedance magnitude values of control and lysed HIV subtype C spiked
in plasma, at 1 kHz. Error bars are STD of the mean of impedance magnitude (n=3)... 99 Figure 5.49 Normalized impedance magnitude values of lysed HIV subtype C spiked
in plasma to the mean of impedance magnitude of control at 1 kHz. Error bars are STD of the mean of normalized impedance magnitude (n=3). ... 99 Figure 5.50 Repeatability of normalized impedance magnitude measurements of
control and lysed HIV subtype C spiked in plasma at 1 kHz. Error bars are STD of the mean of repeatability (n=3). ... 100 Figure 5.51 Impedance magnitude spectra of control and lysed HIV subtype C
spiked in whole blood, for a frequency range between 100 Hz and 1 MHz. ... 101 Figure 5.52 Impedance magnitude values of control and lysed HIV subtype C spiked
in whole blood, at 1 kHz. Error bars are STD of the mean of impedance magnitude (n=3)... 101 Figure 5.53 Normalized impedance magnitude values of lysed HIV subtype C spiked
in whole blood to the mean of impedance magnitude of control at 1 kHz. Error bars are STD of the mean of normalized impedance magnitude (n=3). ... 102 Figure 5.54 Repeatability of normalized impedance magnitude measurements of
control and lysed HIV subtype C spiked in whole blood at 1 kHz. Error bars are STD of the mean of repeatability (n=3). ... 103
Figure 6.1 The three layers of microfluidic chip. From to bottom to top: the glass layer, channel layer and inlet layer. ... 107 Figure 6.2 The CAD design of a channel. ... 107 Figure 6.3 The CAD design of channel layer (3 channels together). ... 108 Figure 6.4 The CAD design of inlet and outlet layer. ... 109 Figure 6.5 3D schematic of channel with physical dimensions. ... 109 Figure 6.6 Actual image of microfluidic chip. First and second channels are filled
with green and yellow food dye respectively and third channel is filled with whole blood. ... 110 Figure 6.7 The model representation of materials from top left to bottom right, Sulfur
(S), Silicon (Si), Oxygen (O), Nitrogen (N), Carbon (C), Hydrogen (H), N-g-Maleimidobutyryloxy succinimide ester (GMBS), Neutravidin, Biotinylated Anti-CD4 Antibody, Hydroxyl group, 4’-6-diamidino-2-phenylindole (DAPI), (3-Mercaptopropyl) trimethoxysilane (3-MPS), lyophilized bovine serum albumin (BSA), Trehalose and CD4+T cell. ... 111 Figure 6.8 Surface functionalization after cleaning of glass slide. a) Plasma
treatment, b) hydroxyl (OH) groups are formed, and c) covalent binding of 3-MPS. ... 112 Figure 6.9 Surface functionalization after covalent binding of 3-MPS. a) GMBS
binding, b) Neutravidin binding, and c) biotinylated anti-CD4 antibody conjugation to Neutravidin. ... 113 Figure 6.10 Surface functionalization after conjugation of biotinylated anti-CD4
antibody. a) BSA blocking, b) final groups of functionalization on glass slide. ... 114 Figure 6.11 Whole blood incubation in channels of microfluidic chips. ... 115
Figure 6.12 CD4+T cell capturing. a) Whole blood is pipetted into channel. b) CD4 antigen on the surface of the cell is bind to the anti-CD4 antibody conjugated to the surface of glass slide. ... 116 Figure 6.13 Cells in hemocytometer used for obtaining initial white blood cell and
CD4+T cell count. Neubauer hemocytometer is used. There are 48 bright field images with 100x magnification. ... 118 Figure 6.14 DAPI stained cells in hemocytometer used for obtaining initial white
blood cell and CD4+T cells concentration. Neubauer hemocytometer is used. There are 48 UV fluorescent images with 100x magnification.119 Figure 6.15 Staining of captured and fixed cells on glass slide. a) DAPI and AF-488
conjugated anti-CD4 antibody stains are pipetted to the channels b) after staining. ... 120 Figure 6.16 LED light source for lensless wide-field microscope. The LED has its
heat sink. ... 124 Figure 6.17 10 MP monochrome CMOS camera used as an image sensor for
lensless wide-field microscope, a) view of sensor side, b) back side, and c) sensor stand horizontal. ... 124 Figure 6.18 CAD design for image sensor stand. Colored parts are engraved on
3mm PMMA. Black lines are cut trough. ... 125 Figure 6.19 Parts of light way a) lens tube b) tube to LED adaptor, c) tube to box
adaptor... 125 Figure 6.20 CAD design of box part of light way. One side is open for sensor stand
and the cross side has an open circle for lens tube connection where the light will shine. ... 126 Figure 6.21 Laser cutter used in that thesis work. VLS2.3, Universal Laser Systems
Inc. ... 126 Figure 6.22 Image sensor stand with mounted image sensor. ... 127
Figure 6.23 lensless wide-field microscopy system. ... 127 Figure 6.24 Sample in a microfluidic channel on top of image sensor. Whole blood
is in the channel in order to show the coverage of sensor area and channel. ... 128 Figure 6.25 lensless wide-field shadow imaging principle for counting of captured
CD4+T cells. ... 128 Figure 6.26 Sample image taken by the lensless wide-field microscopy system. The
image is a part of a channel in the microfluidic chip. In this channel CD4+T cells are captured. In order to image whole channel 5 of this 6.4 mm × 4.6 mm images are required. This image is 3840 × 2748 pixels (10MP) with a pixel size 1.67 μm ×1.67 μm. Two straight lines are the edges of the channel. On the top and bottom of the right side there are the shadow of pen markings. ... 129 Figure 6.27 Sample image of captured CD4+T cells taken by the lensless wide-field
microscopy system. Wide field image of the part of a channel includes inside and some outside part of the channel shown Figure 6.26. The outside part of channel in that image is cropped and only inside of part the channel is shown in b). A small portion from that image is zoomed and shown in figure a), where shadow images of cells are visible. The image in a) is the 1 to 40 portion of the wide-field image in Figure 6.26. ... 130 Figure 6.28 Histogram of above image in Figure 6.27 b). ... 131 Figure 6.29 a) Sample image for a single cell, b) histogram of that image. ... 131 Figure 6.30 Sample cell images for averaging to give a shadow model for a cell. ... 132 Figure 6.31 Continued of Figure 6.30. From left to right, first image is the square
33x33 pixel image of a cell, second one is the round shape extracted form of the cell image, and third is the histogram of round shape. Total 30 images. ... 133
Figure 6.32 Pixel value statistics of single cell images given in Figure 6.30 and Figure 6.31. Minimum is the average of minimum pixel values of images. Maximum is the average of maximum pixel values of images. Mean is mean of the expected value of histogram pixel values to total pixel count in an image. Error bars are standard deviations of minimum, mean and maximum values. ... 134 Figure 6.33 Contrast centering algorithm. ... 135 Figure 6.34 Histogram (contrast) stretching algorithm. ... 136 Figure 6.35 Adaptive histogram stretching of a single cell. a) A sample image of a
single cell, b) histogram of that image, c) contrast centered image, d) histogram of contrast centered image, e) histogram stretched image, f) histogram of final image. ... 137 Figure 6.36 a) Averaged model cell image, b) histogram of that image. ... 138 Figure 6.37 2D colored representation of averaged model cell image. The axes are
row and column index of pixels and color bar defines the gray color codes. ... 138 Figure 6.38 3D colored representation of averaged model cell image. The x and y
axis’s are row and column index of pixels and z and color bar defines the gray color codes. ... 139 Figure 6.39 Pixel value statistics of the averaged model cell. ... 139 Figure 6.40 Sample image of cells to be counted. ... 140 Figure 6.41 Sample image of cells to be counted. ... 141 Figure 6.42 Adaptive histogram stretching for image to be counted. a) A sample
image, b) histogram of that image, c) contrast centered image, d) histogram of contrast centered image, e) histogram stretched image, f) histogram of final image. ... 142
Figure 6.43 3D representation of cross correlation result of sample image and averaged model cell. x and y axis are the pixel index values for sample image and z and color bar indicates the cross correlation output value, arbitrary unit. ... 143 Figure 6.44 2D representation of cross correlation result of sample image and
averaged model cell. x and y axis are the pixel index values for sample image and z and color bar indicates the cross correlation output value, arbitrary unit. ... 144 Figure 6.45 Thresholding output of cross correlation white objects indicate the cells.
The image is a binary image. ... 144 Figure 6.46 The pixels in white objects are grouped together and numbered. The
colors codes are given to differentiate each group of pixels. Each group of pixels are corresponds to a cell. ... 145 Figure 6.47 Counted cells and sample image to be counted are overlapped. .... 145 Figure 6.48 Washing test of channels, a) the microfluidic chip channels filled with
yellow and green food dye and blood from top to bottom. b), c) and d) are first, second and third washing steps respectively. For each washing step 50 μL of PBS is used. ... 147 Figure 6.49 Washing test of channels, a) the microfluidic chip channels filled with
yellow and green food dye and blood from top to bottom. b), c) and d) are first, second and third washing steps respectively. For each washing step 100 μL of PBS is used. ... 148 Figure 6.50 A captured CD4+T cell in a channel, image taken by a high quality 3D
fluorescence microscope. Blue indicates the nucleus and green stains outside wall of the cell. The images are for different angles, one side of the cell is flat because this side is attached to the functionalized surface of the glass slide. (1000x magnification, UV and GFP fluorescent light for different zoom levels, overlapped to give 3D image) ... 149
Figure 6.51 A captured CD4+T cell in a channel image taken by fluorescence microscope. Blue indicates the nucleus and green stains outside wall of the cell. a) Bright field image of a cell, b) UV and c) GFP fluorescence image for same cell, d) merge of all 3 images. (1000x magnification) ... 150 Figure 6.52 CD4+T cells and some WBC in a channel, 100x magnified images. a)
Bright field, b) UV filter, c) GFP filter. ... 151 Figure 6.53 A sample image of captured CD4+T cells ate the edge of a channel.
Image taken by fluorescence microscope with UV filter. The nucleus of the cell are visible. The edge also very visible, DSA seems to be visible at UV filter. ... 152 Figure 6.54 Bright field and fluorescence microscope images taken for manual cell
counting for a channel. Each group of image is for the same channel and is composed of 31 x 7 = 217 (100x magnified) images. a) Bright field, b) UV filter, c) GFP filter. ... 153 Figure 6.55 CD4+T cell capture performance evaluation results for freshly prepared
samples, error bars are standard deviation results. ... 154 Figure 6.56 Full channel images gathered using lensless wide-field microscopy
system. a) Connected images, b) they are cropped to get only the channel, c) the active area where the manual and automatic cell count is applied, is highlighted. ... 155 Figure 6.57 Examples of empirically defining threshold process. 3 different location
inside a channel is used for detecting cells. 1) Original image, 2), 3), and 4) are showing detected cells (red) for different threshold values of 750 (a.u.), 1000 (a.u.) and 1250 (a.u.), respectively. Cell counts are given in Table 6.4. ... 156 Figure 6.58 Examples of empirically defining threshold process. 3 different location
inside a channel is used for detecting cells. 1) Original image, 2), 3), and 4) are showing detected cells (red) for different threshold values of 750
(a.u.), 1000 (a.u.) and 1250 (a.u.), respectively. Cell counts are given in Table 6.4. ... 157 Figure 6.59 One out of five part of a channel is counted using proposed algorithm.
920 cells (red) are counted when threshold was 1000 (a.u.). ... 159 Figure 7.1 Functional groups stabilization, a) trehalose injection to channels b) after
drying of DI water trehalose crystallization... 163 Figure 7.2 Microfluidic chip drying by heating experiment set up. Slide warmer is
used as a heather. Thermometer is placed in order to measure exact temperature on the surface. ... 164 Figure 7.3 Drying chips images for the method of heating at 37⁰C. a) Chip image at
second hour of heating b) the areas showing the dry and wet parts of channels. c) Chip image at fourth hour of heating d) the areas showing the dry and wet parts of channels. Black is dry, white is wet. ... 165 Figure 7.4 The desiccator for drying of chips using vacuum... 166 Figure 7.5 The vacuum oven for drying of chips, vacuum pressure is set to 600
mmHg and temperature is set to 37⁰C. ... 166 Figure 7.6 Drying chips images for the method of heating at 37⁰C and vacuuming
with a pressure of -600 mmHg together and just vacuuming. a) Chip image at second hour of heating and vacuuming together b) the areas showing the dry and wet parts of channels. c) Chip image at fourth hour of just vacuuming d) the areas showing the dry and wet parts of channels. Black is dry, white is wet. ... 167 Figure 7.7 Benchtop centrifuge used for removing excessive fluid inside the
channels. a) Side view and b) top view of chip inside the centrifuge and c) chamber is closed for centrifuging. ... 168 Figure 7.8 Vacuum sealer, vacuuming and sealing a bag with a chip and a bag of
drying agent. ... 169
Figure 7.9 A functionalized chip, vacuum sealed with a bag of drying agent, ready for storing. ... 169 Figure 7.10 Drying the channels by heating. Dried channel area according to time,
error bars are standard deviation results (n=3). ... 170 Figure 7.11 Drying the channels by vacuuming. Dried channel area according to
time, error bars are standard deviation results (n=3). ... 171 Figure 7.12 Drying the channels by heating and vacuuming together. Dried channel
area according to time, error bars are standard deviation results (n=3). ... 171 Figure 7.13 Drying the centrifuged channels by heating and vacuuming together.
The excessive amount of fluid is already removed from the channel by centrifuging. Dried channel area according to time, error bars are standard deviation results (n=3)... 172 Figure 7.14 CD4+T cell capture shelf life performance evaluation results of accuracy
for stabilized samples over time. Error bars are standard deviation results. ... 173 Figure 7.15 CD4+T cell capture shelf life performance evaluation results of
specificity for stabilized samples over time. Error bars are standard deviation results. ... 173 Figure 7.16 CD4+T cell capture shelf life performance evaluation results of
sensitivity for stabilized samples over time. Error bars are standard deviation results. ... 174 Figure 7.17 CD4+T cell capture shelf life performance evaluation results of precision
for stabilized samples over time. Error bars are standard deviation results. ... 174
LIST OF TABLES
Table 1.1 Examples of used, not common, emerging and expectations of POC Tests. ... 9 Table 1.2 Advantages of POCT [20-22] ... 10 Table 1.3 Economic Outcomes of POCT [21, 22] ... 10 Table 1.4 The ideal rapid test: ASSURED criteria. [25] ... 11 Table 2.1 Summary of HIV/AIDS prevalence statistics 2015. [89, 94] ... 23 Table 3.1 The equivalent circuits’ elements for a bio electrochemical system, phase
angles and frequency dependence are also given. α is representing the behavior of the CPE (Adopted from [113, 117]) ... 32 Table 5.1 The repeatability conditions. [161] ... 70 Table 5.2 The parameters for capacitance value of coplanar electrode system. .. 74 Table 5.3 Material cost for FFChip biosensor. ... 104 Table 6.1 Binary classification test for CD4+T cell counting performance. ... 122 Table 6.2 Binary classification test for CD4+T cell counting performance for a
sample channel. Green and blue stained cells are counted from microscope images and initial WBC and CD4+T cells pipetted inside the channel are obtained. Other values in the table can be calculated from those values. ... 153 Table 6.3 CD4+T cell counting performance results for the sample channel. .... 154 Table 6.4 Manual and automatic cell count from lensless wide-field microscope
images in Figure 6.57 and Figure 6.58. Different threshold values are tested in terms of detection performance. Actual cell count is performed by user and cells are counted manually. ... 158 Table 6.5 Automatic cell count using the developed algorithm from lensless wide-field microscope images of captured CD4+T cells in developed
microfluidic chips channel. Actual cell count is the manual count of blue stained cells under fluorescence microscope. ... 160
LIST OF ABBREVIATIONS
µPAD Microfluidic paper-based analytical device 3-MPS (3-Mercaptopropyl) trimethoxysilane
AC Alternative current
AF Alexa Fluor
AIDS Acquired immune deficiency syndrome
ART Antiretroviral therapy
ASSURED Affordable, sensitive, specific, user friendly, robust/rapid, equipment free and deliverable
BSA Bovine serum albumin
CAD Computer aided design
CCD Charge-coupled device
CMOS Complementary metal oxide semiconductor
CPE Constant phase element
DAPI diamidino-2-phenylindole
DI Deionized water
DMSO dimethyl sulfoxide
DNA Deoxyribonucleic acid
DSA Double sided adhesive
EBV Epstein-Barr virus
EIS Electrochemical impedance spectroscopy
FFChip Flexible polymer based microfluidic chip
GFP Green Fluorescent Protein
GMBS N-g-Maleimidobutyryloxy succinimide ester
HIV Human immunodeficiency virus
INR International normalized ratio
LED Light-emitting diode
LOC Lab-on-a-chip
MEMS Micro electro mechanical systems
MEMS Microelectromechanical systems
min Minutes
NAAT Nucleic acid amplification test
OH Hydroxyl
PBS Phosphate buffered saline
PFA Paraformaldehyde
PMMA Poly(methyl methacrylate)
POC Point of care
POCT Point of care testing
RNA Ribonucleic acid
rpm Revolutions per minute
SEM Scanning electron microscope
SEM Scanning electron microscope
USFDA United States Food and Drug Administration
UV Ultraviolet
WBC White blood cell
WHO World Health Organization
1 INTRODUCTION
This section defines the scope of the thesis and gives some introductory concepts used in the thesis.
1.1 Thesis Scope
Scope of thesis presents 4 main parts, motivation, objectives, walkthrough and publications.
1.1.1 Motivation
Infectious diseases are one of the leading causes of death. Millions of people every year die because of infectious diseases. Human immunodeficiency virus (HIV) / Acquired immune deficiency syndrome (AIDS) is an infectious disease and It has caused 35 million total dead globally, only in 2015 1.1 million people died because of AIDS and related diseases. Diagnostics is a crucial tool for preventing, treating and monitoring infection and infection related diseases. Efficient, fast, reliable, cost effective and deliverable diagnosis of HIV/AIDS is essential worldwide.
Traditional trend for diagnostics uses centralized laboratory tests. Centralized laboratories are in clinics and they need infrastructure, moreover centralized laboratory tests require many progression steps since they are slow. After the development on microfluidics, bioengineering, and nanotechnology complex tests can be done in small sized, mobile and easy to use devices at point of care (POC), those devices are called Lab-on-a-chip (LOC). Point of care test (POCT) can be fast, cost effective, easy to use and easy to access.
There is a crucial need on HIV/AIDS POC diagnosis, current approaches use HIV antibody as a target molecule. This approach is a symptom based, indirect detection approach. POC HIV virus load quantification is still on research and development level. A POC for HIV virus load detection can diagnose HIV in very early stage. HIV infects CD4+T cells, and in order to monitor AIDS progression CD4+T cell count is mainly used. Counting of those cells is expensive, slow and needs centralized laboratory infrastructure. A POC CD4+T counting test which can be fast, cost effective, reliable and deliverable, is also crucial.
LOC devices requires receptors and usually those receptors have degradable organic molecules. Due to having degradable molecules there should be a shelf life and obligatory storage conditions of the LOC devices. There are many research on designing POC LOC devices but few of them are interested in the storage and shelf life conditions of devices. POC HIV/AIDS diagnosis LOC tests should have a certain shelf life and can be delivered to the POC easily without requirement to be stored in low temperatures.
1.1.2 Objectives
The objectives of this PhD study are three fold:
First, the development of a flexible polymer based microfluidic biosensor using electrical impedance detection for POC HIV virus load diagnosis. It is composed of, the production of a flexible polymer based microfluidic chip for electrical impedance detection, functionalization of magnetic beads for HIV capturing, construction of impedance detection system, analysis of impedance data and testing the performance of the biosensor.
Second, the development of a microfluidic biosensor and POC diagnosis system using lensless wide field microscopy imaging for POC CD4+T cell count. It is composed of, the production of a microfluidic biosensor with functionalized surface for selective capturing of CD4+T cells, implementing a POC platform for imaging of cells, developing an image processing algorithm for automatic counting of cells and testing the performance of the system.
Third, to engineering a method for increasing shelf life at room temperature of a microfluidic POC biosensor. It is composed of, the engineering and development of a method to stabilize the multilayer immuno-functionalized surface of a microfluidic chip and testing the performance of the efficiency of the method for 6 months. 1.1.3 Walkthrough
In Chapter 1, the background information of POCT, microfluidics and paper based biosensor, surface functionalization for cell and virus capturing, and functionalized group stabilization are presented.
In Chapter 2, the mechanism, diagnosis and treatment follow up of HIV/AIDS are reviewed.
In Chapter 3, and Chapter 4 the background information for impedance spectroscopy and cell microscopy techniques used in this work are explained respectively.
In Chapter 5, development, tests and performance analysis of “Flexible polymer based microfluidic biosensor using electrical impedance detection for POC HIV virus load diagnosis” is explained.
In Chapter 6, development, tests and performance analysis of “Microfluidic biosensor using lensless wide field microscopy imaging for POC CD4+T cell counting” is explained.
In Chapter 7, development, tests and performance analysis of “Engineering a method for increasing shelf life at room temperature of a microfluidic POC biosensor” is explained.
In Chapter 8, the results are discussed. Potential developments of thesis work is explained.
1.1.4 Publications
a. H. Shafiee, W. Asghar, F. Inci, M. Yuksekkaya, M. Jahangir, M. H. Zhang, et al., "Paper and flexible substrates as materials for biosensing platforms to detect multiple biotargets," Scientific Reports, volume 5, page 8719, 2015. (SCI)
b. W. Asghar, M. Yuksekkaya, H. Shafiee, M. Zhang, M. O. Ozen, F. Inci, et al., "Engineering long shelf life multi-layer biologically active surfaces on microfluidic devices for point of care applications," Scientific Reports, volume 6, page 21163, 2016. (SCI), (First two authors contributed equally to this work)
1.2 Point of Care Test
Diagnostics in health care are important tools globally. They influence more than 70% of health care decisions. Diagnostics provide proper and well-timed care to patients, satisfy the safety of blood banking, help to obtain significant data for public health and are crucial to limit health care spending. [1] One of the rising diagnostic technology is point of care (POC) technology. It allows cost effective and fast results also it does not require dedicated laboratory environment.
Figure 1.1 Some commercially available POCT technologies. a) Alere INRatio® 2 PT/INR Monitoring System is used for anticoagulation monitoring and management by measuring Prothrombin Time/International Normalized Ratio (PT/INR) [2]. b) The Clearview® Malaria Combo is a method for testing, the presence of plasmodium falciparum, plasmodium vivax, plasmodium malariae and plasmodium ovale antigens in whole blood [3]. c) Alere Determine™ HIV 1/2 Ag/Ab Combo is used to detect free non immuno-complexed HIV p24 antigen (Ag), and antibodies (Ab) for HIV-1 and HIV-2 in human serum, plasma or whole blood (Alere Inc.) [4]. d) Accu-Chek® Aviva is a compact blood glucose meter (Copyright © F. Hoffmann-La Roche Ltd.) [5]. e) Astute140® Meter and NephroCheck® test card are for detecting biomarkers of acute kidney injury (AKI), TIMP-2 and IGFBP-7 (Astute Medical, Inc.) [6]. f) BD Veritor™ System is and influenza test for detection of Flu A+B (Becton Dickinson and Company. © 2015 BD) [7].
Point-of-Care Testing (POCT) is defined as medical tests performed at or near the patient. POCT does not need dedicated space so there is no need for a specific medical laboratory. POCT instruments are usually hand-carried, bench top or portable cart devices which can perform immediate test with minimum complexity. They can be transported to the location of patient or they can be used as an immediate and simple testing device in operating room or intensive care unit. [8] The synonyms for POCT are bedside testing, near-patient testing, alternate-site testing and extra laboratory testing. [9]
Although the name and concepts seem new, bedside testing like urine test has been used for a long time. In last few years because of technological developments in micromachining, bioengineering and nanotechnology many diagnostic tests can be performed as POCT. [10] Some examples of currently commercial available tests are depicted in Figure 1.1.
The main purpose of POCT is to obtain the test result immediately. Immediate results can improve the efficiency of treatment and by the immediate results rapid precautions can be applied. This can guide for efficient and low cost health care. [10] POCT helps to reduce patient acuteness, morbidity, criticalness, and mortality. In life threatening emergency situations POCT can save life. POCT is effective because it helps fast diagnosis, and because diagnosis is fast the appropriate treatment can be applied faster, also monitoring of treatment can be effective and changes in treatment can be applied faster and patients and physicians are more satisfies because there is event based evidence of diagnosis and treatment monitoring. [11]
Conventional laboratory tests require many steps: first ordered test should be filed, second the sample should be obtained by the specialist in a sample collection room, third samples should be labeled and sent to the laboratory, fourth test should be applied by another specialist at a specific laboratory center, fifth results should be filed and added to archive system finally the test results are forwarded to the clinicians and patient. The progress is time and money consuming. POCT is an alternative to all of these steps. In Figure 1.2 this process is descried.
Figure 1.2 Conventional laboratory testing versus point of care testing. a) Ordered test added on the system, b) sample collected by specialist, c) sampled labeled and sent to the laboratory, d) test performed by specialist, e) results reported and archived, f) results send to the patient and clinicians and g) simple point of care test in which the results obtained instantly.
Recently support and attention on using diagnostic technologies are increased. There are three main factors for that. First is the rise of antibiotic resistance and pandemic diseases. Second scientific and technological advances on genome sequencing and antigen screening which allows unraveling of pathogenesis on a molecular level and identifies pathogen and disease biomarkers. Third the development on microfluidics, bioengineering and nanotechnology led to bring solutions for sample processing, increased assay performance and analyte detection. These factors also led to the development of POC [12-15]. They become accurate and sensitive. [1]
POCT can be divided in to two main types: hand-carried and bench top or portable cart devices. The blood gas and electrolyte analyzers are common examples for bench top or portable cart devices, these devices are like the smaller versions laboratory analyzers whereas urine albumin, blood glucose and coagulation test analyzers are examples for hand-carried devices. They are usually micro-fabricated with a simple look but they are complex systems. Some of them have the ability to do electrochemical test, optical test and immunoassay analyses. [10]
Figure 1.3 The infrastructure and operation requirements for a microfluidics biological test using a) a research purpose testing device, b) POCT device and c) Central laboratory test device. d) Radar charts compares the instrument cost, size, weight, multiplexing ability, required test time, specialist expertise and cost for the test. [16], [17]
Samples for POCT can be urine, blood, eye drop, saliva and other bodily fluids. The targets in those samples can be proteins, drugs, cells, pathogens, nucleic acids, gases and metabolites. [18]
The microfluidics biological tests are first applied as research purpose then central laboratory and POCT devices are developed. They need different requirements which are illustrated in Figure 1.3. The radar charts shows that for POCT devices, the overall requirements are lower compared to research purpose testing devices and central laboratory test devices. For POCT devices the instrument cost, test cost, expertise required for the test, time required for test results, weight and size are lower.
According to the developments in micromachining, bioengineering and nanotechnology the POC tests become highly adequate as biological test. In both developed and developing countries the trend is obtaining fast and accurate results by simple and cost efficient tests that can be applied by non-specialist in the location of patient. This general trend is depicted in Figure 1.4.
Figure 1.4 General trend in biological tests (Adopted from [19])
The technological advances bring new POC tests. By new POC tests patient-doctor counseling can be more effective. Due to immediate test results, rapid evidence based diagnosis can be possible and treatment can be prescribed immediately. So patient care process can be optimized and outcomes becomes higher. [19]
According the general trend in biological tests POCT research are growing. Some of the common, available but not common, emerging and future expectations of POC tests are shown in Table 1.1.
Because of the advantages, there is a significant increase in the development of POC tests. The advantages of POC tests are shown in Table 1.2. The most important advantage of the POCT is the faster test results which leads to faster decision and advising faster treatment plan. POCT are faster because of the reasons described in Figure 1.2, the sample does not need to transport and approval of the test is at the location of the patient. For the treatment follow up tests are needed in order to determine the efficiency of the treatment, therefore faster test results bring optimized treatment follow up.
Table 1.1 Examples of used, not common, emerging and expectations of POC Tests.
Common Use Available but not Common
(not usually practical) Emerging Future Expectations
Blood gas analysis D dimer for thromboem-bolism Transcutaneous
bilirubin White blood cell count Parathyroid hormone Electrolytes Drug / toxicology Influenza antigen Complete blood count Growth hormone Activated
clotting time for high dose heparin monitoring Coagulation for hemostasis assessment (TEG) Micro albumin creatinine Coagulation for transfusion algorithms Adrenocortico-tropic Hormone (ACTH)
Pregnancy Heparin Hemoglobin A1c HIV virus Gastrin
Occult blood INR HIV antibody and antigen CD4+T cells count Sepsis markers
Hemoglobin Cardiac markers Lipids Stroke markers
Bacterial
pharyngitis Magnesium Helicobacter pylori DNA testing
Lactate Other bacteria Microbiology
ABO typing,
crossmatch Basic metabolic panel
Usually POC tests requires less amount of sample compared to traditional laboratory tests because most of the tests require 25-125 mL volume of whole blood sample but for POCT the devices are usually microfluidics so 40-100μL volume of sample is enough.
POC tests are user friendly because they do not require expertise to use, maintenance, and usually they use disposable test strips/cartridges. Fast diagnosis, fast assigning of treatment plan brings patient appreciation. Immediate reports and results makes communication with patient easier. Those are some of the factors which increase patient and clinician satisfaction. [20-22]
Table 1.2 Advantages of POCT [20-22] Faster test results
Faster treatment prescription Optimized treatment follow up Less precious sample volume User friendly devices
Economic advantages
Patient and clinician satisfaction
In addition to many clinical and general health care outcomes POCT has many economical outcomes which are listed in Table 1.3. The economic outcomes are obvious if patient spend less time in clinic which can be satisfied by fast diagnosis and fast treatment follow up. When diagnosis is fast misusing of drugs are reduced. Fast healing and less spending time in clinics results in efficient use of workforce and patients will not be idle for longer time. The overall impacts are improved health quality and health care. [21, 22]
Table 1.3 Economic Outcomes of POCT [21, 22] Short length of stay for diagnosis in clinic
Early discharge from clinic
Less clinic visit for diagnosis and treatment follow up Less misusing of drugs
Reduced need for clinic facilities and clinicians Improved health care
There is a higher demand in POCT, in both developing and already developed countries. The worldwide market value in 2015 was 15,743.6 Million $ and expected to be 27,507.2 Million $ in 2022. [23, 24] So in 6-7 years the market is expected to
be almost doubled worldwide. According to this higher market expectations there has been a considerable increase in research in POCT.
Although there has been a remarkable need for POCT an ideal test should have some limitations and properties. World Health Organization (WHO) defined those limitations and properties as the ideal characteristic for rapid test and announce the acronym ASSURED at 2003 WHO Special Program for Research and Training in Tropical Diseases (WHO/TDR). According to that criteria an ideal rapid test should be affordable, sensitive, specific, user friendly, robust/rapid, equipment free and deliverable to those who need. [25] This becomes as a dominant definition for POCT but since the most critical advantage of POCT is rapid diagnosis and rapid application of treatment the ideal characteristics for POCT can be reconfigured. Pai and his friends offered importance of clear and actionable decision taking within the same clinic visit. Although the test is not very user friendly or affordable in some circumstances rapid results are more important. [26] So ideal criteria’s for a POCT can be “ASSURED” under the requirement of rapid and clear diagnosis and rapid beginning of treatment according to test results.
Table 1.4 The ideal rapid test: ASSURED criteria. [25] A Affordable
S Sensitive S Specific U User-friendly R Robust and rapid
E Equipment-free or minimal equipment that can be solar-powered D Deliverable to those who need them
POCT can be used and crucial for infectious diseases as well. The management of infectious diseases depend on regular and rapid testing so reliable, cost effective and sensitive tests are produced, developed and still developing for infectious diseases. POCT are able to diagnose HIV and AIDS and can be used for monitoring the status of AIDS. [27]
![Figure 1.8 An example of a paper based bioassay by Martinez et al. [50] a) The Waterman ink absorbs by capillary action to the photolithography patterned channels in a chromatography paper](https://thumb-eu.123doks.com/thumbv2/9libnet/3967666.52195/52.892.128.787.604.958/bioassay-martinez-waterman-capillary-photolithography-patterned-channels-chromatography.webp)
![Figure 2.4 HIV-1 entry into CD4 T cells and its life cycle (National Institute of Allergy and Infectious Diseases (NIAID)) [108]](https://thumb-eu.123doks.com/thumbv2/9libnet/3967666.52195/61.892.166.747.336.1028/figure-entry-national-institute-allergy-infectious-diseases-niaid.webp)