Research Article
Relationship of Meteorological and Air Pollution Parameters
with Pneumonia in Elderly Patients
Suleyman Serdar Tasci, Cemil Kavalci
, and Afsin Emre Kayipmaz
Emergency Department, Faculty of Medicine, Baskent University, Ankara, Turkey
Correspondence should be addressed to Cemil Kavalci; [email protected] Received 30 December 2017; Accepted 18 February 2018; Published 21 March 2018 Academic Editor: Tzong-Luen Wang
Copyright © 2018 Suleyman Serdar Tasci et al. This is an open access article distributed under the Creative Commons Attribution License, which permits unrestricted use, distribution, and reproduction in any medium, provided the original work is properly cited.
Background and Purpose. In this study, we aimed to evaluate the relationship between pneumonia and meteorological parameters
(temperature, humidity, precipitation, airborne particles, sulfur dioxide (SO2), carbon monoxide (CO), nitrogen dioxide (NO2), nitrite oxide (NO), and nitric oxide (NOX)) in patients with the diagnosis of pneumonia in the emergency department.
Methods. Our study was performed retrospectively with patients over 65 years of age who were diagnosed with pneumonia.
The meteorological variables in the days of diagnosing pneumonia were compared with the meteorological variables in the days without diagnosis of pneumonia. The sociodemographic characteristics, complete blood count of the patients, and meteorological parameters (temperature, humidity, precipitation, airborne particles, SO2, CO, NO2, NO, and NOX) were investigated. Results. When the temperature was high and low, the number of days consulted due to pneumonia was related to low air temperature (𝑝 < 0.05). During the periods when PM 10, NO, NO2, NOX, and CO levels were high, the number of days referred for pneumonia was increased (𝑝 < 0.05). Conclusion. As a result, climatic (temperature, humidity, pressure levels, rain, etc.) and environmental factors (airborne particles, CO, NO, and NOX) were found to be effective in the number of patients admitted to the hospital due to pneumonia.
1. Introduction
Pneumonia, shortly, is the inflammation of lung tissue [1]. It occurs secondary to various microorganisms, mainly bacteria [2]. The annual incidence of community-acquired pneumo-nia is 2.7–10 per 1000 people and it did not vary much in the last decades [3]. Approximately 250.000 people in Ger-many are hospitalized in the hospital for pneumonia annually, and it is estimated that twofold this number are treated as out-patients in primary public health centers [4]. Pneumonia is one of the common causes of admission to emergency rooms (ER). The rate of admission to ER due to pneumonia was reported to be 3.7% in a study conducted at Yuzuncu Yil Uni-versity [5].
The effect of meteorological events on various diseases has been investigated for a while. Their effects on cerebrovas-cular diseases and coronary artery diseases were examined already [6–8]. The incidence of pneumonia is known to show a seasonal variation. Meteorological variations especially set
the ground for tracheitis, bronchitis, bronchial asthma, pneu-monia, and other respiratory infections. Liu et al. reported that pneumonia was affected by meteorological factors such as air temperature and humidity [9].
The aim of the present study was to determine the rela-tionship between meteorological and air pollution parame-ters [temperature, humidity, precipitation, airborne particles, sulfur dioxide (SO2), CO2, carbon monoxide (CO), nitrite dioxide (NO2), nitrite oxide (NO), and nitric oxide (NOX)] with pneumonia.
2. Materials and Methods
Our study was conducted by retrospectively screening the files of the patients aged over 65 years followed up due to pneumonia in the emergency department of Baskent Univer-sity Ankara Hospital between 01.05.2011 and 01.05.2016 after obtaining the approval from the Ethics Committee.
Volume 2018, Article ID 4183203, 9 pages https://doi.org/10.1155/2018/4183203
Baskent University Ankara Hospital is a tertiary founda-tion university hospital. In our adult emergency department, annual averages of 30000 patients are treated.
The histories, physical examination findings, laboratory findings, and the results of chest X-rays and computed tomography (CT) of all cases were examined. The meteoro-logical variables on the days when the diagnosis of pneumo-nia was made and meteorological variables on the days when the diagnosis of pneumonia was not made were compared.
Meteorological data were received from the IBM web-site of https://www.wunderground.com whereas the weather monitoring data were received from the https://www.havai-zleme.gov.tr website of the Republic of Turkey Ministry of Environment and Urbanization.
The patients who were admitted to the ER with shortness of breath/respiratory distress and diagnosed with diseases other than pneumonia (pulmonary embolism, COPD exac-erbation, etc.), who aged below 65 years and whose files could not be accessed, were excluded from the study.
All statistical analyses were performed by using SPSS version 24.0 for windows. The descriptive data were expressed as mean standard deviation (SD), median, interquartile range (IQR), minimum, maximum, patient number (𝑛), and %. The chi-square test was used to compare the categorical vari-ables. Mann-Whitney𝑈 test was used to compare numerical variables between pneumonia admission and nonadmission days and chi-square test was used to investigate relationship between admission and event (rain). The lag analysis was used to determine the factors affecting the development of pneumonia during the last four days. Generalized additive regression models were built to investigate effects of mete-orological variables, gases, and lag effects on pneumonia admission. A𝑝 value smaller than 0.05 was accepted as statis-tically significant.
3. Results
A total of 2606 patients diagnosed with pneumonia were included in the study. The mean age of patients was77.7 ± 7.6 years. Of the patients, 1387 (53.2%) were male and 1219 (46.8%) were women.
When the patients were included in the study according to CURB 65, the score of one (0.0) patient was found to be 0, score of 1116 (42.8%) patients was 1, score of 819 (31.4%) patients was 2, score of 377 (14.5%) patients was 3, score of 260 (10%) patients was 4, and score of 33 (1.3%) patients was found to be 5.
Of the patients, 1929 (74%) were discharged from the ER, 669 (25.7%) were hospitalized, 6 (0.2%) died in the ER, one (0.0) left the hospital at own request and one (0.0) was determined to be referred.
At least one patient admission was detected in 1227 (66%) of 1858 days taken into evaluation. The mean admission number during the days on which pneumonia patients were admitted was2.1 ± 1.5 with the minimum admission number of one and maximum admission number of 14.
The mean temperature value on the day when the tem-perature was the highest was 17.5± 10.0∘C, mean temperature value on the day when the temperature was normal was
10.12 ± 6.4∘C, mean temperature value on the day when the temperature was the lowest was 4.4 ± 7.9∘C while the mean humidity value on the day when the humidity was the highest was87.7 ± 11.7%, mean humidity value on the day when the humidity was normal was63.2 ± 16.9%, and mean humidity value on the day when the humidity was the lowest was32.9 ± 20.9%. The mean pressure value when the sea-level pressure was the highest was1019.2 ± 6.2 mmHg, mean pressure value when the sea-level pressure was normal was 1016.3 ± 5.6 mmHg, and, finally, when the sea-level pressure value was the lowest, the mean pressure value was1012.7 ± 6.6 mmHg and wind speed was found to be 8.9 ± 4.3 per hour (Table 1).
Examining the air pollution parameters in our study, the mean PM 10 value was62.2 ± 46.3, mean PM 2.5 value was 22.9 ± 18.2, mean SO2value was10.6 ± 8.1, mean NO value was46.5 ± 46.6, mean NO2value was54.1 ± 21.9, mean NOX value was101.2 ± 59.0, and mean CO value was found to be 34.7 ± 23.2 (Table 2).
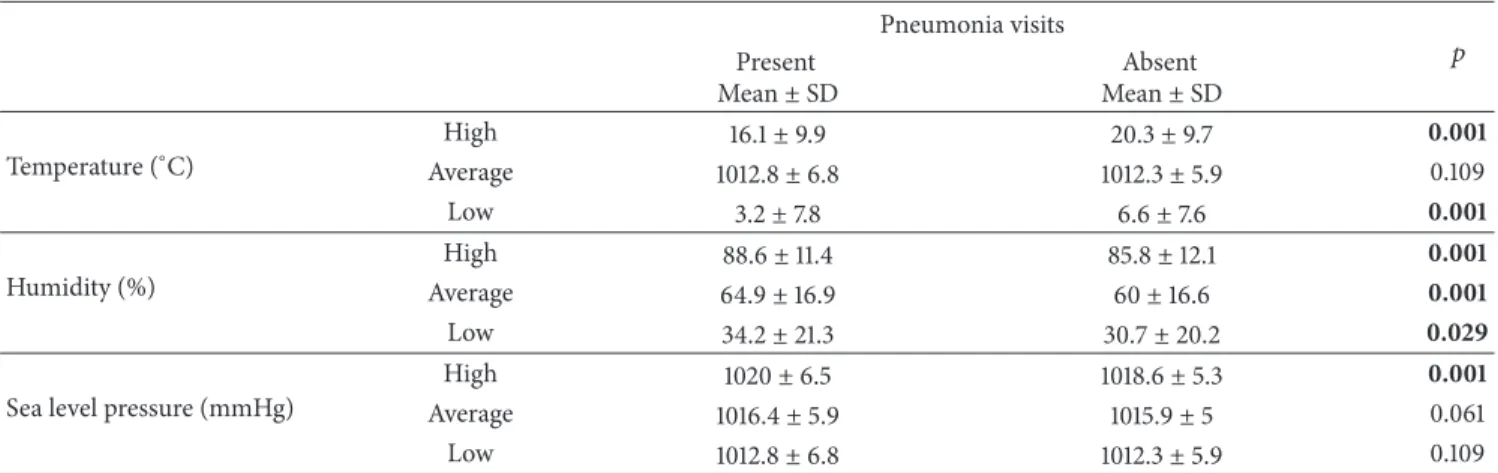
During periods of high and low temperatures, the num-ber of days admitted with pneumonia was significantly higher at low weather temperatures (𝑝 < 0.05). There was a negative correlation between the pneumonia and temperature. During the periods of normal temperatures, no relationship was detected between the number of days admitted with pneumo-nia and temperature (𝑝 > 0.05). During the periods of high, normal, and low humidity, the number of days admitted with pneumonia was higher at high humidity rates (𝑝 < 0.05). There was a positive correlation between the humidity and pneumonia. During the periods of high sea-level pressure, the number of days admitted with pneumonia was higher at high pressure levels (𝑝 < 0.05). There was also a positive correla-tion between the sea-level pressure and pneumonia. During periods when the sea-level pressure was normal and low, no significant relationship was detected between the number of days admitted with pneumonia and pressure levels (𝑝 > 0.05) (Table 3).
During the periods when PM 10, NO, NO2, NOX, and CO levels were high, the number of days admitted with pneu-monia was detected to be increased (𝑝 < 0.05). There was a positive correlation between pneumonia and PM 10, NO, NO2, NOX, and CO levels. There was no significant relation-ship between the levels of PM 2.5 and SO2and the number of days admitted with pneumonia (𝑝 > 0.05) (Table 4).
It was raining on 524 (42.7%) of the days admitted with pneumonia, but no rain was detected in 703 (57.3%) of them. It was raining during 218 (34.5%) of the days with-out pneumonia admission while no rain was detected dur-ing 413 (65.5%) of them. There was statistically significant relationship between the rainy days and admission with pneumonia (𝑝 < 0.05) (Table 5). There was a positive correla-tion between pneumonia and rain.
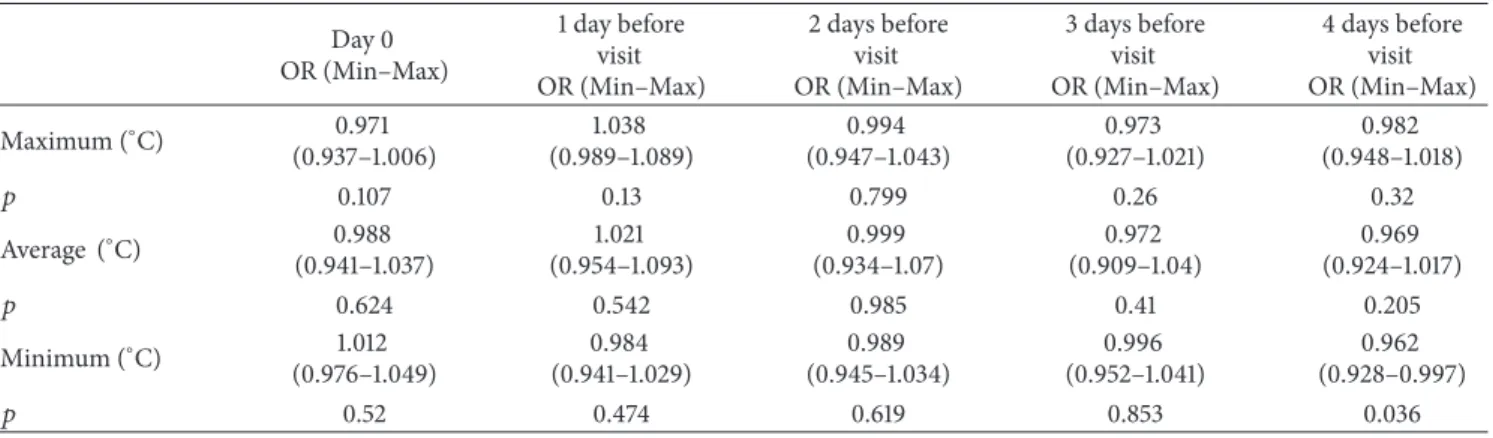
During the period of maximum temperature, it was deter-mined that the temperature during the 4-day period before admission did not change the risk of admission with pneu-monia (𝑝 > 0.05). During the period of mean temperature, it was determined that the temperature during the 4-day period before admission did not change the risk of admis-sion with pneumonia (𝑝 > 0.05). In the period of minimum
Table 1: Descriptive statistics of temperature parameters. Mean± SD Minimum–maximum Temperature (∘C) High 17.6± 10.0 −8–39 Average 10.1± 6.5 9,92–1033 Low 4.4± 7.9 −24–20 Humidity (%) High 87.7± 11.8 39–100 Average 63.2± 16.9 22–100 Low 32.9± 20.9 4–98
Sea level pressure (mmHg)
High 1019.2± 6.2 1000–1043
Average 1016.3± 5.6 997–1035
Low 1012.7± 6.6 992–1033
Wind speed (m/S) 8.9± 4.3 0–32
Table 2: Descriptive statistics for air pollution parameters.
Mean± SD Minimum–maximum PM 10 (𝜇g/m3) 62.2± 46.3 2–566 PM 2.5 (𝜇g/m3) 22.9± 18.2 2–175 SO2(𝜇g/m3) 10.6± 8.1 0–103 NO (𝜇g/m3) 46.5± 46.6 2–358 NO2(𝜇g/m3) 54.1± 21.9 7–131 NOX (𝜇g/m3) 101.2± 59.0 16–473 CO (𝜇g/m3) 34.7± 23.2 1–178
temperature, it was found that the temperature during the 4-day period before admission did not change the risk of sion with pneumonia (𝑝 > 0.05) while the risk of admis-sion decreased as the temperature increased four days before admission (𝑝 < 0.05) (Table 6).
In the period of maximum humidity, it was detected that the humidity during the 4-day period before admission did not change the risk of admission with pneumonia (𝑝 > 0.05) and the risk of admission increased as the humidity increased two days before admission (𝑝 < 0.05). When the mean humi-dity rate was examined, it was found that the humihumi-dity in the 4-day period did not change the risk of admission with pneu-monia (𝑝 > 0.05). During the period of minimum humi-dity, it was determined that the humidity in the 4-day period before admission did not change the risk of admission with pneumonia (𝑝 > 0.05) (Table 7).
During the period when the sea-level pressure was max-imum, it was found that the pressure in the 4-day period before admission did not change the risk of admission with pneumonia (𝑝 > 0.05). During the period when the sea-level pressure was normal, it was determined that the pressure in the 4-day period before admission did not change the risk of admission with pneumonia (𝑝 > 0.05). During the period when the sea-level pressure was minimum, the pressure on days 0, 1, 3, and 4 before admission did not change the risk of admission with pneumonia (𝑝 > 0.05) and the risk of admis-sion increased as the pressure on day 2 before admisadmis-sion increased (𝑝 < 0.05) (Table 8).
It was determined that the wind during the 4-day period before admission did not change the risk of admission with pneumonia (𝑝 > 0.05) (Table 9).
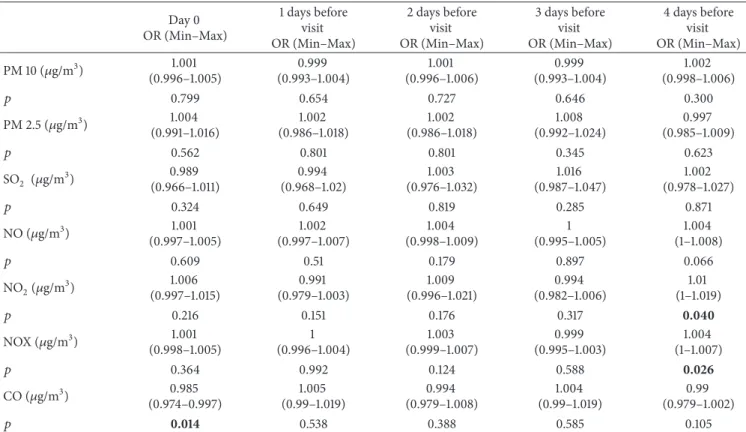
It was found that the levels of PM 10, PM 2.5, SO2, NO, and CO during the 4-day period before admission did not change the risk of admission with pneumonia (𝑝 > 0.05). It was determined that the level of NO2during the 3-day period did not change the risk of admission with pneumonia (𝑝 > 0.05) whereas an increase was detected in the risk of admis-sion as the level of NO2increased (𝑝 < 0.05). It was deter-mined that the level of NOX during the 3-day period did not change the risk of admission with pneumonia (𝑝 > 0.05) whereas an increase was detected in the risk of admission as the level of NOX increased (𝑝 < 0.05). There was no correla-tion between the period with high NOX level and three days before admission with pneumonia (𝑝 > 0.05) whereas a signi-ficant relationship was noted between the level of NOx on day 4 before admission and frequency of pneumonia (𝑝 < 0.05). On the day of admission, the elevation of CO increased the risk of admission (𝑝 < 0.05) while the risk of admission did not change during the remaining days (𝑝 > 0.05) (Table 10).
4. Discussion
Seasonal diseases are the pathologies occurring or worsening in weather conditions and seasonal variations [10]. Changes in meteorological factors usually affect the respiratory system. They cause especially bronchial asthma, tracheitis, pneumo-nia, and other respiratory tract pathologies [11]. Meteoro-logical factors act by reducing the resistance of the human body to infection and by facilitating the spread of infection-causing pathogens [12, 13]. Pereira et al. reported that, despite a seasonal variation, the incidence of pneumonia varied as 1.9–12.7% [14].
Meteorological factors alter the permeability of thermal stress in the membranes and capillary resistance, render the skin vulnerable to infection by influencing the rate of sweat-ing and evaporation, cause changes in the nasal mucosa, lead to hypoxia by causing vasoconstriction peripheral vessel, and impair body resistance by impeding ciliary movements in the respiratory tracts [13]. They increase virulence by prolonging the survival time of microorganisms and viruses and by influencing the spread of infectious agents in the atmosphere [15].
Many studies showed that the incidence of respiratory infection increased with the decrease in air temperature [16– 18]. Liu et al. stated that there was a significant association
Table 3: Relationship between the pneumonia visits and temperature parameters. Pneumonia visits 𝑝 Present Mean± SD Absent Mean± SD Temperature (∘C) High 16.1± 9.9 20.3± 9.7 0.001 Average 1012.8± 6.8 1012.3± 5.9 0.109 Low 3.2± 7.8 6.6± 7.6 0.001 Humidity (%) High 88.6± 11.4 85.8± 12.1 0.001 Average 64.9± 16.9 60± 16.6 0.001 Low 34.2± 21.3 30.7± 20.2 0.029
Sea level pressure (mmHg)
High 1020± 6.5 1018.6± 5.3 0.001
Average 1016.4± 5.9 1015.9± 5 0.061
Low 1012.8± 6.8 1012.3± 5.9 0.109
Table 4: Relationship between pneumonia visits and air pollution parameters. Pneumonia visits 𝑝 Present Mean± SD Absent Mean± SD PM 10 (𝜇g/m3) 63.8± 45.5 59.4± 47.8 0.046 PM 2.5 (𝜇g/m3) 23.4± 18.6 22.2± 17.3 0.629 SO2(𝜇g/m3) 10.7± 8.1 10.5± 8 0.528 NO (𝜇g/m3) 51.3± 50.1 37.5± 37.7 0.001 NO2(𝜇g/m3) 55.2± 22.5 51.9± 20.7 0.004 NOX (𝜇g/m3) 107.2± 62.8 90.1± 49.4 0.001 CO (𝜇g/m3) 41.4± 24 31.3± 22 0.001
Table 5: Relationship between pneumonia visits and rain.
Pneumonia visits 𝑝
Present𝑛 (%) Absent𝑛 (%)
Rain Present 524 (42.7) 218 (34.5) <0.001
Absent 703 (57.3) 413 (65.5)
between air temperature and the incidence of respiratory system diseases [19]. Gautret et al. expressed that the fre-quency of viral respiratory tract infections increased in cold weather [20]. Pica and Bouvier reported that viruses causing respiratory tract infections increase the risk of infection in cold weather [21]. Borges et al. stated that the frequency of the pneumonia caused by M. catarrhalis changed with the air temperature and increased during the winter months. The most commonly isolated microorganisms were found to be S.
pneumonia and H. influenza [22]. Nascimento-Carvalho et al.
identified the relationship of M. catarrhalis with temperature [23]. Jain et al. stated that the incidence of pneumococcal infection and rate of inpatients due to this reason increased during the winter months [24, 25]. Respiratory Syncytial Virus with lipid envelope followed by Influenza A virus was shown to be high [15]. It was reported that Influenza virus spread fast in cold and dry conditions whereas it was
completely inactive at temperatures above 30∘C [15]. The inci-dence of pneumonia was found to increase during the periods of low and high air temperatures and at low air temperatures in this study. There was a significant relationship between the lowest temperature of four days before and incidence of pneumonia. We believe that growth frequency and virulence of microorganisms are increased and immune systems of the patients are weakened due to decreasing temperature. We suggest that the factors such as the mucociliary movement decreased secondary to cold and changes in membrane permeability increase the frequency of pneumonia. Also, we think that the onset of pneumonia lasts for four days since microorganisms have an incubation period.
Liu et al. showed that low humidity increased the develop-ment of infectious respiratory tract diseases and that it had a positive correlation with the number of hospitalization due to lower respiratory tract infection [19]. A study on the correla-tion between climatic factors including humidity and clinical diseases revealed that humidity was negatively associated with the upper and lower respiratory tract infections [26]. Borges et al. stated that the frequency of pneumonia caused by M. catarrhalis increased with humidity [22]. Nascimento-Carvalho et al. identified the relationship of M. catarrhalis with humidity [23]. Enveloped viruses such as influenza virus require 20–30% humidity for growth and they can only survive in weather with high humidity (50–70%) [15]. In our study, the frequency of pneumonia was determined to increase during periods and weather conditions with high humidity. A relationship was detected between the highest humidity rate of two days before and frequency of pneumo-nia. Although increasing humidity is suitable for the growth of some microorganisms, we suggest that some microor-ganisms grow more comfortably at high humidity rates. We also believe that increasing humidity will destroy the muco-ciliary activity in the respiratory system and create a favorable environment for microorganisms. We suggest that microor-ganisms do not produce infection even in a suitable environ-ment before an incubation period is over and that this period of time is two days when the environment is suitable.
Shaman and Kohn stated that virus spread and survival were easier in the regions with low pressure [27]. Yang et al. emphasize that people should be careful about respiratory
Table 6: Temperature for 4 days before visit due to pneumonia. Day 0 OR (Min–Max) 1 day before visit OR (Min–Max) 2 days before visit OR (Min–Max) 3 days before visit OR (Min–Max) 4 days before visit OR (Min–Max) Maximum (∘C) 0.971 (0.937–1.006) 1.038 (0.989–1.089) 0.994 (0.947–1.043) 0.973 (0.927–1.021) 0.982 (0.948–1.018) 𝑝 0.107 0.13 0.799 0.26 0.32 Average (∘C) 0.988 (0.941–1.037) 1.021 (0.954–1.093) 0.999 (0.934–1.07) 0.972 (0.909–1.04) 0.969 (0.924–1.017) 𝑝 0.624 0.542 0.985 0.41 0.205 Minimum (∘C) 1.012 (0.976–1.049) 0.984 (0.941–1.029) 0.989 (0.945–1.034) 0.996 (0.952–1.041) 0.962 (0.928–0.997) 𝑝 0.52 0.474 0.619 0.853 0.036
Table 7: Humidity for 4 days before visit due to pneumonia. Day 0 OR (Min–Max) 1 day before visit OR (Min–Max) 2 days before visit OR (Min–Max) 3 days before visit OR (Min–Max) 4 days before visit OR (Min–Max) Maximum (%) 1.011 (0.998–1.025) 0.993 (0.978–1.008) 1.016 (1.001–1.032) 1.003 (0.988–1.018) 1.005 (0.992–1.019) 𝑝 0.09 0.363 0.038 0.714 0.423 Average (%) 1.006 (0.993–1.018) 0.997 (0.982–1.013) 1.003 (0.987–1.019) 1.008 (0.992–1.024) 1.006 (0.994–1.019) 𝑝 0.371 0.736 0.719 0.321 0.32 Minimum (%) 1.004 (0.996–1.012) 0.997 (0.988–1.006) 1.001 (0.992–1.011) 1.005 (0.996–1.014) 1.003 (0.995–1.011) 𝑝 0.275 0.501 0.789 0.305 0.483
Table 8: Sea level pressure for 4 days before visit due to pneumonia. Day 0 OR (Min–Max) 1 day before visit OR (Min–Max) 2 days before visit OR (Min–Max) 3 days before visit OR (Min–Max) 4 days before visit OR (Min–Max) Maximum (mmHg) 1.027 (0.997–1.058) 0.991 (0.95–1.035) 1.038 (0.993–1.084) 0.99 (0.948–1.033) 1.018 (0.989–1.049) 𝑝 0.074 0.689 0.099 0.641 0.223 Average (mmHg) (0.993–1.056)1.024 (0.933–1.023)0.977 (0.999–1.100)1.048 (0.937–1.027)0.981 (0.979–1.041)1.01 𝑝 0.129 0.327 0.057 0.405 0.531 Minimum (mmHg) 1.024 (0.997–1.052) 0.971 (0.933–1.011) 1.044 (1.001–1.089) 0.988 (0.949–1.028) 1.002 (0.975–1.029) 𝑝 0.085 0.149 0.043 0.554 0.885
Table 9: Wind speed for 4 days before visit due to pneumonia. Day 0 OR (Min–Max) 1 days before visit OR (Min–Max) 2 days before visit OR (Min–Max) 3 days before visit OR (Min–Max) 4 days before visit OR (Min–Max) Wind speed (m/S) 0.997 (0.971–1.024) 0.998 (0.969–1.029) 0.979 (0.95–1.008) 0.992 (0.963–1.022) 0.995 (0.969–1.022) 𝑝 0.825 0.921 0.153 0.588 0.721
Table 10: Air pollution parameters for 4 days before visit due to pneumonia. Day 0 OR (Min–Max) 1 days before visit OR (Min–Max) 2 days before visit OR (Min–Max) 3 days before visit OR (Min–Max) 4 days before visit OR (Min–Max) PM 10 (𝜇g/m3) 1.001 (0.996–1.005) 0.999 (0.993–1.004) 1.001 (0.996–1.006) 0.999 (0.993–1.004) 1.002 (0.998–1.006) 𝑝 0.799 0.654 0.727 0.646 0.300 PM 2.5 (𝜇g/m3) 1.004 (0.991–1.016) 1.002 (0.986–1.018) 1.002 (0.986–1.018) 1.008 (0.992–1.024) 0.997 (0.985–1.009) 𝑝 0.562 0.801 0.801 0.345 0.623 SO2 (𝜇g/m3) 0.989 (0.966–1.011) 0.994 (0.968–1.02) 1.003 (0.976–1.032) 1.016 (0.987–1.047) 1.002 (0.978–1.027) 𝑝 0.324 0.649 0.819 0.285 0.871 NO (𝜇g/m3) 1.001 (0.997–1.005) 1.002 (0.997–1.007) 1.004 (0.998–1.009) 1 (0.995–1.005) 1.004 (1–1.008) 𝑝 0.609 0.51 0.179 0.897 0.066 NO2(𝜇g/m3) 1.006 (0.997–1.015) 0.991 (0.979–1.003) 1.009 (0.996–1.021) 0.994 (0.982–1.006) 1.01 (1–1.019) 𝑝 0.216 0.151 0.176 0.317 0.040 NOX (𝜇g/m3) 1.001 (0.998–1.005) 1 (0.996–1.004) 1.003 (0.999–1.007) 0.999 (0.995–1.003) 1.004 (1–1.007) 𝑝 0.364 0.992 0.124 0.588 0.026 CO (𝜇g/m3) 0.985 (0.974–0.997) 1.005 (0.99–1.019) 0.994 (0.979–1.008) 1.004 (0.99–1.019) 0.99 (0.979–1.002) 𝑝 0.014 0.538 0.388 0.585 0.105
tract infections during hot and humid days in the low tropical regions where the pressure is low [28]. Liu et al. showed that the atmospheric pressure had a positive correlation with the number of hospitalizations due to lower respiratory tract infection [19]. The frequency of pneumonia was determined to be increased when the sea-level pressure was the highest and at high pressure levels. A relationship was found between the lowest pressure level before two days and frequency of pneumonia. We suggest that the activity of microorganisms and reaction of the body change depending on the humidity and temperature at increasing pressure levels.
In the study by Du Prel et al., although not as much as humidity and air temperature, rainy weather was reported to change the frequency of pneumonia [29]. Liu et al. stated that the amount of precipitation was associated with pneumonia [19]. The frequency of pneumonia was found to be increased significantly on rainy days in our study. This may be due to the low air temperature on rainy days. We also believe that staying under rain can also increase the risk of infection.
Liu et al. expressed that the wind was not associated with pneumonia [19]. In our study, there was no significant relationship between wind and admission frequency in the 4-day period. The main reason for this may be that the wind does not have a long-term effect on the microorganism or individual.
Tuan et al. noted that the level of PM increased during the cold months and played an active role in the respiratory sys-tem pathologies [30]. Happo et al. identified that the response to infection decreased due to increased inflammatory activity and immunosuppressant effects with the emission of PM [31]. The studies on PM identified that particles causing air
pollution show inflammatory and anti-inflammatory effects by adhering to the epithelium in the respiratory tract and alveoli and by impairing biological membranes and cellular barriers [31, 32]. In the study by Lin et al., PM 2.5 in air pollution was stated to increase both risk of infection and respiratory mortality [17]. In the same study, they reported that gases apart from PM (NO2, SO2, and O3) affected respiratory infections merely [17]. Lin et al. also showed that pulmonary mortality was high on days when PM 10 levels were high [33]. Another study by Lin et al. in China’s Pearl River region reported a significant association between the increase in PM 2.5 levels and respiratory mortality [34]. Zhao and colleagues found that PM 2.5 and PMc (particles between PM 2.5 and PM 10) were significantly associated with respiratory diseases [35]. The frequency of respiratory diseases was stated to be increased in school children due to the low level of air circulation in classrooms [36]. In our study, the frequency of pneumonia was determined to increase as the number of PM increased, but the difference was found to be significant for PM 10. There was no significant relationship between PM level in the past days and frequency of pneumonia. We suggest that increasing particles weakens the immune system and let microorganisms settle more easily by adhering to the epithelium and by causing impairment in the mucociliary activity and biological membranes. We believe that the result that there was no significant relation-ship between the past days and pneumonia was due to the fact that PM measurements do not change frequently.
Tuan et al. stated that SO2 increased the frequency of respiratory tract infections by reaching peak concentrations during the cold months [30]. Lin et al. reported that SO2level
affected respiratory tract infections at an insignificant level [17]. No significant relationship was detected between SO2 level and pneumonia as well as between SO2level in the past days and pneumonia in our study. Although the growth of some microorganisms increases in the presence of SO2, we suggest that it does not have any effect on the presence of pneumonia since the level of SO2found in the nature is very low.
Substances such as NO, NO2, and NOX are the chemical substances which are produced by the toxic gases, coming especially from vehicle exhausts and leading to the formation of ozone gas [30]. Ozone, a strong oxidant pollutant, increases the susceptibility to infection and inflammation in the res-piratory tract [36–39]. The study by Chiu et al. stated that exposure to ozone played a role in the admission to hospitals with pneumonia during both hot and cold days [40]. There are also studies indicating that ozone has no association with respiratory tract infections [9, 41]. Negrisoli and Nascimento determined that the frequency of pneumonia at urban level was related to ozone [42]. The frequency of pneumonia was significantly higher in the patients with high levels of NO2, NO, and NOX in our study. There was a significant rela-tionship between the levels of NO and NOX before four days and frequency of pneumonia. We believe that the toxic gases formed cause damage to the cells of the respiratory tract by impairing the membrane structures of the cell, pump structures within the cell membrane, and energy system, thus increasing the risk of infection. We suggest that this toxicity did not act without reaching to a certain level within the cell and that it takes about a period of four days since microor-ganisms cannot produce pneumonia before the incubation period is over.
Tuan et al. stated that the concentrations of CO increased during the winter months and caused infections [30]. Fusco et al. reported that, during the months when the concentration of CO was high, the frequency of asthma, COPD, and pneumonia was increased. The largest pollutant of respiratory tracts was stated to be CO [43]. Shvedova et al. argued that an effect similar to the toxic effect of carbon particles on the pharynx leads to pulmonary toxicity [44]. In our study, the frequency of pneumonia was significantly higher in patients with high CO level. The CO level in the past days was found to be associated with pneumonia. We believe that carbon monoxide damages cells by causing hypoxia especially at the tissue level and influencing the energy system in the cells, thereby increasing the susceptibility to infection. We suggest that toxicity is chronic and it is not influenced by the day, especially since the CO gas in the environment does not go below a certain level during the winter months.
5. Limitations
Our study was conducted in a single center, which might limit the generalizability of our results. We also did not consider the day of the week and seasonal trends in the analysis.
6. Conclusion
In conclusion, the climatic (temperature, humidity, pressure levels, rain, etc.) and air pollution factors (airborne particles,
CO, NO, and NOX) were found to be effective on the number of patients admitted with pneumonia.
Conflicts of Interest
The authors declare that there are no conflicts of interest regarding the publication of this paper.
Acknowledgments
The authors thank Seval Kul, Ph.D., Associate Professor, for statistical analysis consultancy.
References
[1] M. H. Kollef, A. Shorr, Y. P. Tabak, V. Gupta, L. Z. Liu, and R. S. Johannes, “Epidemiology and outcomes of health-care-associ-ated pneumonia: Results from a large US database of culture-positive pneumonia,” CHEST, vol. 128, no. 6, pp. 3854–3862, 2005.
[2] T. Welte, A. Torres, and D. Nathwani, “Clinical and economic burden of community-acquired pneumonia among adults in Europe,” Thorax, vol. 67, no. 1, pp. 71–79, 2012.
[3] M. Schnoor, J. Hedicke, K. Dalhoff, H. Raspe, and T. Sch¨afer, “Approaches to estimate the population-based incidence of community acquired pneumonia,” Infection, vol. 55, no. 3, pp. 233–239, 2007.
[4] S. Ewig, N. Birkner, R. Strauss et al., “New perspectives on com-munity-acquired pneumonia in 388 406 patients: results from a nationwide mandatory performance measurement programme in healthcare quality,” Thorax, vol. 64, no. 12, pp. 1062–1069, 2009.
[5] T. Edirne, Y. Edirne, B. Atmaca, and S. Keskin, “Y¨uz¨unc¨u Yıl ¨
Universitesi Tıp Fak¨ultesi acil servis hastalarının ¨ozellikleri,”
Van Tip Dergisi, vol. 15, no. 4, pp. 107–111, 2008.
[6] T. Sen, M. A. Astarcioglu, L. D. Asarcikli et al., “The effects of air pollution and weather conditions on the incidence of acute myocardial infarction,” The American Journal of Emergency
Medicine, vol. 34, no. 3, pp. 449–454, 2016.
[7] W. B. Goggins, J. Woo, S. Ho, E. Y. Y. Chan, and P. H. Chau, “Weather, season, and daily stroke admissions in Hong Kong,”
International Journal of Biometerology, vol. 56, no. 5, pp. 865–
872, 2012.
[8] Y. C¸ evik, N. ¨O. Do˘gan, M. Das¸, A. Ahmedali, S. Kul, and H. Bayram, “The association between weather conditions and stroke admissions in Turkey,” International Journal of
Biome-terology, vol. 59, no. 7, pp. 899–905, 2015.
[9] L. Liu, R. Poon, L. Chen et al., “Acute effects of air pollution on pulmonary function, airway inflammation, and oxidative stress in asthmatic children,” Environmental Health Perspectives, vol. 117, no. 4, pp. 668–674, 2009.
[10] G. D’Amato, L. Cecchi, M. D’Amato, and I. Annesi-Maesano, “Climate change and respiratory diseases,” European Respiratory
Review, vol. 23, no. 132, pp. 161–169, 2014.
[11] F. De Donato and P. Michelozzi, “Climate change, extreme weather events and health effects,” The Mediterranean Sea: Its
History and Present Challenges, vol. 9789400767041, pp. 617–
[12] E. G. Mourtzoukou and M. E. Falagas, “Exposure to cold and respiratory tract infections,” The International Journal of
Tuber-culosis and Lung Disease, vol. 11, no. 9, pp. 938–943, 2007.
[13] Y. Liu, J. Liu, F. Chen et al., “Impact of meteorological factors on lower respiratory tract infections in children,” Journal of
Inter-national Medical Research, 2015.
[14] R. Pereira, S. Oliveira, and A. Almeida, “Nursing home-ac-quired pneumonia presenting at the emergency department,”
Internal and Emergency Medicine, vol. 11, no. 7, pp. 999–1004,
2016.
[15] A. C. Lowen, S. Mubareka, J. Steel, and P. Palese, “Influenza virus transmission is dependent on relative humidity and tempera-ture,” PLoS Pathogens, vol. 3, no. 10, pp. 1470–1476, 2007. [16] H. Lin, Y. Zhang, Y. Xu et al., “Temperature Changes between
Neighboring Days and Mortality in Summer: A Distributed Lag Non-Linear Time Series Analysis,” PLoS ONE, vol. 8, no. 6, Article ID e66403, 2013.
[17] H. Lin, W. Ma, H. Qiu et al., “Is standard deviation of daily PM2.5 concentration associated with respiratory mortality?”
Environmental Pollution, vol. 216, pp. 208–214, 2016.
[18] A. Zanobetti, M. S. O’Neill, C. J. Gronlund, and J. D. Schwartz, “Summer temperature variability and long-term survival among elderly people with chronic disease,” Proceedings of the
National Acadamy of Sciences of the United States of America,
vol. 109, no. 17, pp. 6608–6613, 2012.
[19] Y. Liu, J. Liu, F. Chen et al., “Impact of meteorological factors on lower respiratory tract infections in children,” Journal of
International Medical Research, vol. 44, no. 1, pp. 30–41, 2016.
[20] P. Gautret, G. C. Gray, R. N. Charrel et al., “Emerging viral respiratory tract infections—environmental risk factors and transmission,” The Lancet Infectious Diseases, vol. 14, no. 11, pp. 1113–1122, 2014.
[21] N. Pica and N. M. Bouvier, “Ambient temperature and respi-ratory virus infection,” The Pediatric Infectious Disease Journal, vol. 33, no. 3, pp. 311–313, 2014.
[22] I. C. Borges, D. C. Andrade, M.-R. A. Cardoso et al., “Seasonal patterns and association of meteorological factors with infec-tion caused by Streptococcus pneumoniae, Haemophilus influ-enzae, and Moraxella catarrhalis in childhood community-acquired pneumonia in a tropical region,” Infectious Diseases, vol. 49, no. 2, pp. 147–150, 2017.
[23] C. M. Nascimento-Carvalho, M.-R. A. Cardoso, A. Barral et al., “Seasonal patterns of viral and bacterial infections among children hospitalized with community-acquired pneumonia in a tropical region,” Infectious Diseases, vol. 42, no. 11-12, pp. 839– 844, 2010.
[24] S. Jain, D. J. Williams, and S. R. Arnold, “Community-acquired pneumonia requiring hospitalization among U.S. children,” The
New England Journal of Medicine, vol. 373, no. 24, pp. 835–845,
2015.
[25] P.-Y. I. Tam, L. C. Madoff, M. O’Connell, and S. I. Pelton, “Seasonal variation in penicillin susceptibility and invasive pneumococcal disease,” The Pediatric Infectious Disease Journal, vol. 34, no. 4, pp. 456-457, 2015.
[26] T. P. Loh, F. Y. L. Lai, E. S. Tan et al., “Correlations between clinical illness, respiratory virus infections and climate factors in a tropical paediatric population,” Epidemiology and Infection, vol. 139, no. 12, pp. 1884–1894, 2011.
[27] J. Shaman and M. Kohn, “Absolute humidity modulates influen-za survival, transmission, and seasonality,” Proceedings of the
National Acadamy of Sciences of the United States of America,
vol. 106, no. 9, pp. 3243–3248, 2009.
[28] L. Yang, P. Y. Chen, J. F. He et al., “Effect modification of environ-mental factors on influenza-associated mortality: a time-series study in two Chinese cities,” BMC Infectious Diseases, vol. 11, article no. 342, 2011.
[29] J.-B. Du Prel, W. Puppe, B. Gr¨ondahl et al., “Are meteorological parameters associated with acute respiratory tract infections?”
Clinical Infectious Diseases, vol. 49, no. 6, pp. 861–868, 2009.
[30] T. S. Tuan, T. S. Venˆancio, and L. F. C. Nascimento, “Air pol-lutants and hospitalization due to pneumonia among children. An ecological time series study,” S˜ao Paulo Medical Journal, vol. 133, no. 5, pp. 408–413, 2015.
[31] M. S. Happo, O. Uski, P. I. Jalava et al., “Pulmonary inflamma-tion and tissue damage in the mouse lung after exposure to PM samples from biomass heating appliances of old and modern technologies,” Science of the Total Environment, vol. 443, pp. 256–266, 2013.
[32] M. Colucci, F. Maione, M. C. Bonito, A. Piscopo, A. Di Gian-nuario, and S. Pieretti, “New insights of dimethyl sulphoxide effects (DMSO) on experimental in vivo models of nociception and inflammation,” Pharmacological Research, vol. 57, no. 6, pp. 419–425, 2008.
[33] H. Lin, Y. Zhang, T. Liu et al., “Mortality reduction following the air pollution control measures during the 2010 asian games,”
Atmospheric Environment, vol. 91, pp. 24–31, 2014.
[34] H. Lin, T. Liu, J. Xiao et al., “Mortality burden of ambient fine particulate air pollution in six Chinese cities: Results from the Pearl River Delta study,” Environment International, vol. 96, pp. 91–97, 2016.
[35] Y. Zhao, S. Wang, L. Lang, C. Huang, W. Ma, and H. Lin, “Ambient fine and coarse particulate matter pollution and respiratory morbidity in Dongguan, China,” Environmental
Pollution, vol. 222, pp. 126–131, 2017.
[36] H. Altuˇg, E. O. Gaga, T. D¨oˇgeroˇglu, B. Brunekreef, G. Hoek, and W. Van Doorn, “Effects of ambient air pollution on respiratory tract complaints and airway inflammation in primary school children,” Science of the Total Environment, vol. 479-480, no. 1, pp. 201–209, 2014.
[37] M. Nickmilder, C. De Burbure, C. Sylviane, D. Xavier, B. Alfred, and D. Alain, “Increase of exhaled nitric oxide in children exposed to low levels of ambient ozone,” Journal of Toxicology
and Environmental Health, Part A. Current Issues, vol. 70, no.
3-4, pp. 270–274, 2007.
[38] A. Barraza-Villarreal, J. Sunyer, L. Hernandez-Cadena et al., “Air pollution, airway inflammation, and lung function in a cohort Study of Mexico City Schoolchildren,” Environmental Health
Perspectives, vol. 116, no. 6, pp. 832–838, 2008.
[39] K. Berhane, Y. Zhang, W. S. Linn et al., “The effect of ambient air pollution on exhaled nitric oxide in the children’s health study,”
European Respiratory Journal, vol. 37, no. 5, pp. 1029–1036, 2011.
[40] H.-F. Chiu, M.-H. Cheng, and C.-Y. Yang, “Air pollution and hospital admissions for pneumonia in a subtropical City: Taipei, Taiwan,” Inhalation Toxicology, vol. 21, no. 1, pp. 32–37, 2009. [41] S. Cakmak, M. Mahmud, A. Grgicak-Mannion, and R. E. Dales,
“The influence of neighborhood traffic density on the respira-tory health of elementary schoolchildren,” Environment
Inter-national, vol. 39, no. 1, pp. 128–132, 2012.
[42] J. Negrisoli and L. F. C. Nascimento, “Atmospheric pollutants and hospital admissions due to pneumonia in children,” Revista
[43] D. Fusco, F. Forastiere, P. Michelozzi et al., “Air pollution and hospital admissions for respiratory conditions in Rome, Italy,”
European Respiratory Journal, vol. 17, no. 6, pp. 1143–1150, 2001.
[44] A. A. Shvedova, E. Kisin, A. R. Murray et al., “Inhalation vs. aspiration of single-walled carbon nanotubes in C57BL/6 mice: Inflammation, fibrosis, oxidative stress, and mutagenesis,”
American Journal of Physiology-Lung Cellular and Molecular Physiology, vol. 295, no. 4, pp. L552–L565, 2008.