The investigation of calpastatin and thyroglobulin gene
polymorphisms in some native cattle breeds*
Mustafa SAVAŞÇI
1, Fatih ATASOY
21Ankara University, Graduate School of Healty Sciences, Ankara; 2 Ankara University, Faculty of Veterinary Medicine, Deparment of Animal Husbandry, Ankara. Turkey.
Summary: In this study, calpastatin gene polymorphisms, known to have effect on meat tenderness, and thyroglobulin gene polymorphisms, known to affect marbling score, were investigated in some local cattle breeds raised in Turkey (Anatolian Native Black-ANT (n=36), Eastern Anatolian Red-EAR (n=51) and Turkish Grey-TG (n=52). The genetic variants in the bovine CAST and
TG gene were analysed by using the polymerase chain reaction-restriction fragment length polymorphism (PCR-RFLP) method. It
was determined that while the calpastatin gene possessed the C allele, known to have a positive effect on meat tenderness, at a high frequency (0.67), suggesting that the local cattle breeds presented with a high potential for high quality meat production, the thyroglobulin gene was ascertained to possess the favourable T allele at a relatively low frequency (0.23), which could be increased with marker-assisted selection. It has been ascertained that the local cattle breeds investigated, and in particular the EAR had the potential to produce high quality red meat. Genetic analyses revealed the FIS, FIt and FSt values to be -0, 010, 0.045 and 0.055, respectively. These values showed that the local cattle breeds investigated displayed a high genetic diversity. Additionally, The allelic frequencies were calculated according to the Hardy-Weinberg equilibrium, and the differences between the cattle breeds were found to be statistically significant.
Key words: Calpastatin, Meat Quality, Native cattle, PCR-RFLP, Thyroglobulin.
Bazı yerli sığır ırklarında kalpastatin ve thyroglobulin gen polimorfizmlerinin araştırılması
Özet: Türkiye’de bulunan bazı yerli sığır ırklarında (Yerli Kara-YK, n=36; Doğu Anadolu Kırmızısı-DAK (n=51) ve Boz Irk-BI (n=52) et kalite özelliklerinden gevrekleşme üzerine etkili kalpastatin ve mermerleşme derecesi üzerine etkili thyroglobulin gen polimorfizmleri, polimeraz zincir reaksiyonu-restriksiyon parça uzunluk polimorfizmi (PCR-RFLP) metodu kullanılarak araştırılmıştır. Kalpastatin geninde et gevrekliği üzerine olumlu etkisi olan C allelinin yüksek frekansta (0.67) bulunduğu ve yerli sığır ırklarının yüksek potansiyel taşıdığı ,thyroglobulin için ise faydalı T allelinin nisbi olarak düşük frekansta bulunduğu (0.23) marker destekli seleksiyonla frekansının artırılabileceği ortaya çıkmıştır. Yerli sığır ırklarının özellikle DAK’ın kaliteli kırmızı et üretimi için potansiyel taşıdığı tespit edilmiştir. Genetik analizler sonucunda FIS, FIt ve FSt değerleri sırasıyla -0, 010, 0,045 ve 0,055 olarak tespit edilmiştir. Bu sonuçlara göre incelenen genler bakımından yerli sığır ırklarının yüksek genetik çeşitliliğe sahip olduğu belirlenmiştir. Ayrıca allel frekansları Hardy-Weinberg denge kuralına uygun olarak hesaplanarak ırklar arasında farkın önemli olduğu bulunmuştur.
Anahtar sözcükler: Kalpastatin, Et kalitesi, PCR-RFLP, Thyroglobulin, Yerli sığır ırkları.
Introduction
In the beef cattle industry, multiple genes, including calpastatin and thyroglobulin, are known to have effect on meat quality (15). It has been reported that the effect of the calpastatin gene (CAST) on meat tenderness is determined by measuring the Warner-Bratzler shear force (WBS) value. Calpastatin, which is an endogenous calpain inhibitor, plays a key role in the regulation of calpain activity in the cell, and does not inhibit proteases other than calpain. Calpastatin affects meat tenderness indirectly, by means of its effect on calpain. Calpastatin, alongside calpain, is found in the cytosol and cell
membrane. Calpastatin contains four inhibitory regions, and one molecule of calpastatin inhibits four molecules of calpain (5). It has been reported that CAST indirectly enables the post-mortem breakdown of the myofibrillar proteins, through its involvement in the regulation of the activity of calpain, which leads to the proteolysis of the myofibrils (12). A G/C polymorphism at the 29,602nd nucleotide has effect on meat tenderness (14).
The thyroglobulin gene (TG) encodes the thyroglobulin protein, which acts as the precursor of triiodothyronine and tetraiodothyronine and is involved in the development of adipocytes (2). For a long time, it
*
thus, for the production of meat as demanded by the market. However, it should be taken into consideration that, of the meat quality characteristics, the marbling score is affected by multiple genes, and therefore, under suboptimal environmental conditions, even cattle with favourable alleles may not produce meat with a high marbling score (8).
This study was aimed at the determination of the calpastatin and thyroglobulin gene polymorphisms, known to affect meat quality, in some local cattle breeds raised in Turkey, namely, in the Anatolian Native Black, Eastern Anatolian Red and Turkish Grey. The demonstration of the polymorphisms of these genes would contribute to the improvement of the economic traits affected by these variations.
Materials and Methods
In this study, blood samples were taken from 139 cattle (n=139), which were of the Anatolian Native Black (n=36), Eastern Anatolian Red (n=41) and Turkish Grey (n=52) breeds. The blood samples were collected from local cattle breeds, which were raised at national institutes, for the purpose of conservation herds.
endonuclease enzyme (PCR-RFLP), gel imaging with electrophoresis and data assessment by statistical analyses. (DNR Bio-Imaging Systems MiniBIS Pro and software Image Aide from Spectronics Corporation). The obtained data were evaluated by using the GENETIX 4.05 and populations 1.0 statistics programs (6). All procedures were approved by the Ankara University Animal Care and Use Commitee (Meeting date: 13.07.2011, Meeting number: 2011-115, Folder number: 2011-404, Deciscion number: 2011-115-448).
Results
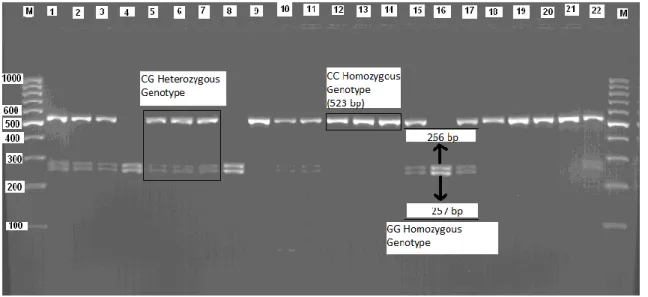
Agarose gel electrophoresis of calpastatin: The 523
bp region of the calpastatin gene, between exons 5 and 6, was amplified by PCR. The PCR products were cleaved using the RsaI restriction endonuclease enzyme and separated by % 2 gel electrophoresis, resulting in the observation of 257 and 266 bp fragments under UV light. The image of the band profiles is shown in Figure 1.
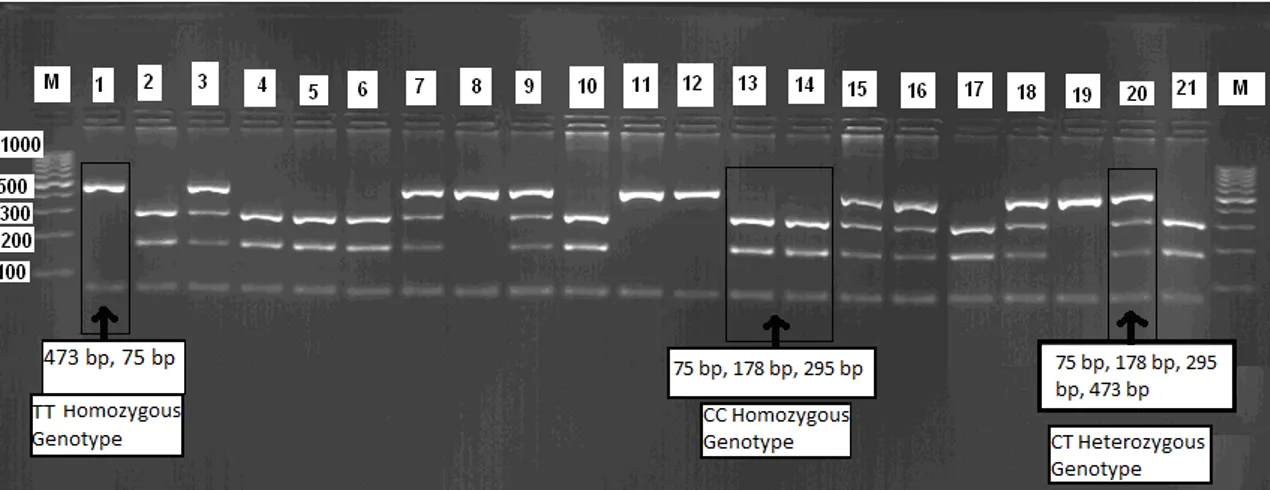
Agarose gel electrophoresis of thyroglobulin: The
548 bp region of the thyroglobulin gene of exon 1 and
the flanks region (Accession number: X05380.1) was
amplified by PCR. The PCR products were cleaved using
Figure 1. Gel electrophoresis of the calpastatin gene. Şekil 1. Kalpastatin geninin jel elektroforezi.
the PsuI restriction endonuclease enzyme and separated by gel electrophoresis, resulting in the observation of 75, 178, 295 and 473 bp fragments under UV light. The image of the band profiles is shown in Figure 2.
The genotype distribution and allelic frequencies of the calpastatin locus: In the Eastern Anatolian Red,
Anatolian Native Black and Turkish Grey cattle, the presence of the genotypes CC, CG and GG was detected at the calpastatin locus. For calpastatin, the C allele was determined to the greatest frequency in all three of the local cattle breeds investigated.
The calpastatin genotype frequencies were
calculated separately for each cattle breed (Table 1). The frequencies of the genotypes CC, CG and GG were determined as 0.45, 0.47 and 0.08, respectively. In the general population, the differences observed between the genotypic frequencies of the animals were determined to be statistically significant (P <0.05). The Turkish Grey was the local breed with the greatest frequency of the homozygous CC allele. The allelic frequencies were calculated according to the Hardy-Weinberg equilibrium,
and the differences between the cattle breeds were found to be statistically significant (p < 0.05).
Allelic frequencies were determined in the calpastatin gene for all three cattle breeds. This data is presented in Table 2. In all of the populations, the frequency of the C allele was greater than the frequency of the G allele.
The genotype distribution and allelic frequencies of the thyroglobulin locus:The presence of the genotypes
CC, CT and TT was determined at the thyroglobulin locus. The thyroglobulin genotypic frequencies were calculated separately for each of the cattle breeds (Table 3). The frequencies of the genotypes CC, CT and TT were determined as 0.64, 0.29 and 0.07, respectively. In the general population, the differences observed between the genotypic frequencies of the animals were found to be statistically significant (P<0.05). The Eastern Anatolian Red was the local breed with the greatest frequency of the homozygous TT allele.
Using the same method, the allelic frequencies of the thyroglobulin gene were calculated for all three cattle breeds. This data is presented in Table 4.
Table 1. Genotypic frequencies of the CAST gene. Tablo 1. CAST geninin genotipik frekansı.
Genotype
Native Anatolian Black Eastern Anatolian Red Turkish Grey Total
n Frequency N Frequency N Frequency N Frequency
CC 14 0.39 22 0.43 26 0.50 62 0.45
CG 18 0.50 24 0.48 23 0.44 65 0.47
GG 4 0.11 5 0.09 3 0.06 12 0.08
Table 2. Allelic frequencies at the CAST locus in the some native cattle breeds investigated. Tablo 2. Araştırmada kullanılan bazı yerli sığır ırklarının CAST lokuslarının allel frekansları.
Allel Native Anatolian Black Eastern Anatolian Red Turkish Grey General Population
C 0.64 0.67 0.72 0.67
G 0.36 0.33 0.28 0.33
Figure 2. Gel electrophoresis of the thyroglobulin gene. Şekil 2. Thyroglobulin geninin jel elektroforezi.
Anatolian Native Black Eastern Anatolian Red Turkish Grey General Population
C 0.73 0.65 0.94 0.77
T 0.27 0.35 0.06 0.23
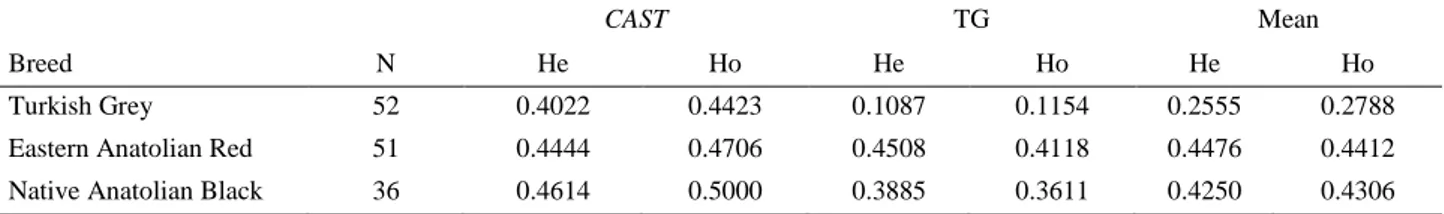
Table 5. The heterozygosity indices (He) and mean heterozygosity values (Ho) at the CAST and TG loci in the local cattle breeds investigated.
Tablo 5. Araştırmada kullanılan yerli ırkların CAST ve TG lokuslarının heterozigotluk indeksleri (He) ve ortalama heterozigotluk değeri (Ho).
Breed N
CAST TG Mean
He Ho He Ho He Ho
Turkish Grey 52 0.4022 0.4423 0.1087 0.1154 0.2555 0.2788
Eastern Anatolian Red 51 0.4444 0.4706 0.4508 0.4118 0.4476 0.4412
Native Anatolian Black 36 0.4614 0.5000 0.3885 0.3611 0.4250 0.4306
Table 6. f statistical values in the local cattle breeds investigated. Tablo 6. Araştırmadaki yerli sığır ırklarının f istatistik değerleri.
Irk FIS FIT FST
Calpastatin
Turkish Grey -0.057 -0.067 -0.009
Eastern Anatolian Red -0.081 -0.075 0.004
Anatolian Native Black -0.068 -0.070 -0.002
Total -0.068 -0.071 -0.002
Thyroglobulin
Turkish Grey 0.092 0.093 0.001
Eastern Anatolian Red 0.044 0.187 0.149
Anatolian Native Black 0.067 0.270 0.218
Total 0.082 0.200 0.130
General Total -0.010 0.045 0.055
Table 7. FST/(1-FST) values (right-angled triangle) and gene flow (D value) (inverse right-angled triangle) between the populations. Tablo 7. Populasyonlar arası FST/(1-FST) değerler (riht-angled triangle) ve gen akışı (D value) (inverse right-angled triangle).
Turkish Grey (n=52) Eastern Anatolian Red (n=51) Anatolian Native Black (n=36)
Turkish Grey *** 0.10410 0.06179
Eastern Anatolian Red 0.09887 *** -0.00408
Genetic analyses:
Heterozygosity indices and mean heterozygosity:
The most commonly used criterion for the assessment of genetic variation in a population is heterozygosity. The heterozygosity values (He and Ho) and the mean
heterozygosity values determined in the cattle
populations investigated in the present study are presented in Table 5. The differences observed between the populations for the mean heterozygosity values were found to be statistically insignificant (P >0.05).
f statistical values: The population differentiations
were tested for each locus and all loci using the FIT(F),
FST(ө) and FIS(f) fixation indices, and the results obtained
are shown in Table 6. Statistically significant differences were determined to exist between the inbreeding coefficients calculated at each locus for the local cattle breeds investigated. The FIS value, the purebreed
selection coefficient of the populations analysed, which was also the indicator of the mean heterozygosity
deficiency determined for all populations, was
determined as 1.03%. The FIT(F) value, demonstrating
the deviation of the heterozygosity from the HW equilibrium in the general population was calculated as 4.55%. The FIT value, demonstrating the inbreeding
coefficient and the mean deficiency of heterozygosity in the general population was estimated as 4.55%. The FST
value, considered as an indicator of the genetic differentiation between the cattle breeds investigated was calculated as 0.055.
Genetic distance values, gene flow: Estimations for
gene migration, (log(Nm)), and FST statistics (right-angled
triangle) between the local cattle breeds investigated are presented in Table 7.As can be seen in the Table 7, the greatest difference between the cattle breeds existed between the Turkish Grey and the Eastern Anatolian Red (0.1041) and the least difference existed between the Anatolian Native Black and the Eastern Anatolian Red (0.00408). On the other hand, it was observed that the gene flow between the Turkish Grey population and the Eastern Anatolian Red population was greater than that
between the Turkish Grey population and the Anatolian Native Black population.
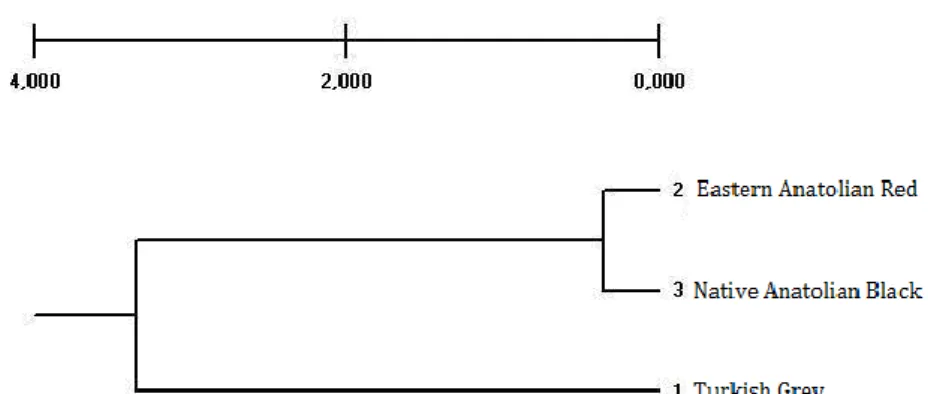
The genetic distance values between the local cattle breed populations were calculated as described by Nei (11), and the UPGMA dendrogram (software NTSYS-pc 2.0), which was drawn according to the matrix of these values and demonstrated the correlation between the populations of the different breeds, is presented in Figure 3. As can be seen in the dendrogram, the Eastern Anatolian Red (2) and Anatolian Native Black (3) populations were determined to be similar for the loci investigated. While the Turkish Grey (1) population did not display such similarity, this breed was found to be more similar to the Eastern Anatolian Red compared to the Anatolian Native Black.
The probability values for the chi-square values calculated using the Popgene software 1.31 demonstrated that, at the P< 0.05 significance level, only the Anatolian Native Black population was at balance for the calpastatin gene, and this population was not at the Hardy-Weinberg equilibrium for the other breeds and genes. The heterozygosity values of the Anatolian Native Black and Turkish Grey populations were higher than expected.
Discussion and Conclusion
The present study demonstrated that the RsaI C/G locus in the calpastatin gene had a polymorphic structure in the Anatolian Native Black, Eastern Anatolian Red and Turkish Grey populations. The presence of multiple alleles at this locus suggested a high genetic variation in the population.
The C allele, which enabled a better tenderness of meat, was found at the highest frequency in the Turkish Grey, followed by the Eastern Anatolian Red and the Anatolian Native Black. While all three of the local cattle breeds investigated in the present study displayed a high potential for meat tenderness, the high consumer preference in Turkey for the meat of the Anatolian Native Black supports the findings of this study.
Figure 3. The UPGMA dendrogram showing the relationship between the local cattle breeds investigated. Şekil 3. Araştırmada kullanılan yerli ırklar arasındaki ilişkiyi gösteren UPGMA dendogramı.
meat, was higher than the G allele.
In a research conducted by Kök et al. (9) to determine the characterization of the calpastatin gene in the Turkish Grey and crosses of the Turkish Grey and the Brown Swiss, the frequency of the C allele in the Turkish Grey was determined as 0.507. Therefore, in agreement with the results of the present study, the researchers reported a high frequency of the favourable C allele.
With respect to the TG gene polymorphism, the genotypes CC, CT and TT were detected in the Eastern Anatolian Red and Anatolian Native Black populations. In the Turkish Grey, only the genotypes CC and CT were detected, and no individual with the genotype TT existed. This suggested that the Eastern Anatolian Red and Anatolian Native Black were more advantageous for marker-assisted selection aimed at the improvement of the marbling score, when compared to the Turkish Grey. However, the presence of individuals with the genotype CT in the Turkish Grey population suggested that this breed also had potential. It is considered that, by means of marker-assisted selection programmes, individuals with the genotype TT would be able to be obtained. The allelic frequencies of the thyroglobulin gene were calculated according to the Hardy-Weinberg equilibrium law. In all three of the local cattle breeds investigated, the C allele was determined to be of a higher frequency, compared to the T allele. The possible reasons of the disruption of the Hardy-Weinberg equilibrium were considered to be mutation, selection, the subgrouping of populations, inbreeding within populations and the clustering of certain genotypes in populations (10; 12).
The mean heterozygosity value, which is considered as the best estimate of genetic variation in populations and is not affected by the sampling error, was rather high in the Eastern Anatolian Red (0.4412) and the Anatolian Native Black (0.4306), but lower in the Turkish Grey (0.2788).
The mean heterozygosity values being high in the populations investigated was attributed to a low number of polymorphic genetic markers having been studied. Other possible influential factors were the relatively low number of samples tested and the genetic structure of the
at the level the highly productive European cattle breeds have been.
The F-statistics used to test any possible deviations from the Hardy-Weinberg equilibrium revealed that, the general FIS(f) value of all three local cattle breeds
investigated in the present study was -0.01028. The calculation of a negative value demonstrates the deviation of the population from the state of equilibrium and also points out to excessive heterozygosity.
In order to determine the genetic differences between the populations, the FST values were calculated.
The FST value having been calculated as 0.055
demonstrated that while 5.5% of the genetic variation originated from differences between the populations, 94.5% of the genetic variation originated from differences within the populations. The genetic variation within the populations being high suggested that the local cattle breeds had a high genetic variation. Of the population pairs, the Turkish Grey-Eastern Anatolian Red pair presented with the greatest differences (0.1041), while the Anatolian Native Black-Eastern Anatolian Red pair presented with the least differences (0.00408).
Although the local cattle breeds investigated in this study were morphologically rather different from each other, the differences between their FST values were
either small or moderate. In other words, the local cattle breeds investigated in the present study were determined to be genetically close to each other.
The FIT value, indicating the deviation of the
heterozygosity of the general population from the Hardy-Weinberg equilibrium was calculated as 4.55%. This value showed that the homozygosity in the population investigated was 4.5% higher than expected.
Logarithmically, the greatest gene migration having been determined to have occurred between the Eastern Anatolian Red and Anatolian Native Black populations (Nm=3.92) suggested that the consanguinity between these two populations was greater than that between the other populations. Furthermore, the gene flow between the Turkish Grey and Eastern Anatolian Red populations was found to be greater than that between the Turkish Grey and Anatolian Native Black populations. Similarly,
the genetic differentiation of the some native cattle breeds in Turkey is at either a low or moderate level.
Based on all these results, it was ascertained that either a small or moderate genetic differentiation existed between the local cattle breeds raised in Turkey. The investigation of further gene regions and populations would contribute to a more detailed demonstration of genetic differences between the cattle breeds indigenous to Turkey.
In the present study, it was ascertained that the Eastern Anatolian Red and Anatolian Native Black populations were similar in terms of the loci investigated. The Turkish Grey population was less similar, but was closer to the Eastern Anatolian Red than the Anatolian Native Black.
In the present study, the lowest gene flow (D value) was determined between the Anatolian Native Black and the Eastern Anatolian Red (0.00408), and the highest gene flow was determined between the Turkish Grey and the Eastern Anatolian Red (0.10410). In terms of the alleles investigated, it was ascertained that a greater gene flow had occurred from the Turkish Grey to both the Anatolian Native Black and the Eastern Anatolian Red.
A high level of gene migration having been determined between the Eastern Anatolian Red and the Anatolian Native Black populations suggested that the level of consanguinity was greater between these two populations, compared to the others.
The present study is the first research to investigate
TG polymorphisms in local cattle breeds raised in
Turkey. The results obtained revealed that the local cattle breeds included in the study had the potential for high quality meat production and presented with a high level of genetic variation. Thus, the present study has confirmed the significance of the protection and distribution of local cattle breeds.
References
1. Anon (2010): NCBI Sequence Viewer 2.8.2. :http: // www. ncbi.nlm. nih. gov /projects/sviewer (14.09.2010). 2. Ailhaud G, Grimaldi P, Negrel, R (1992): Cellular and
molecular aspects of adipose tissue development. Cellular and molecular aspects of adipose tissue development.
Annual Review of Nutrition, 12, 207-233.
3. Barendse W (2000): Protocol for genotyping TG5 alleles
using an MboI restriction endonuclease digest for the GTAC/T single nucleotide polymorphism. CSIRO Molecular Animal Genetics Centre, Gehrmann Laboratories, Research Road, St. Lucia.4072.
4. Barendse W, Bunch R, Thomas M, Armitage S, Baud S, Donaldson N (2004): The TG5 thyroglobulin gene test
for a marbling quantitative trait loci evaluated in feedlot cattle. Aust. J. Exp. Agriculture, 44, 669-674.
5. Barendse W, Harrison BE, Hawken RJ, Ferguson DM, Thompson JM, Thomas M, Bunch RJ (2007): Epistasis
between Calpain 1 and its inhibitör Calpastatin within breeds of cattle. Genetics. 176, 2601-2610.
6. Belkhir K, Borsa P, Chikhi L, Goudet J, Bonhomme F (1996): Genetix 4.00 WindowsTM software for population genetics. Laboratoire Genome. Populations. Interactions.
University of Montpellier. Fransa.
7. Georges M, Lequarre AS, Hansel R, Vassart G (1987):
Genetic variation of the bovine thyroglobulin gene studied at the DNA level. Animal Genetics. 18 , 41-50.
8. Khatib H, Zaitoun I, Chang YM, Maltecca C, Boettcher P (2007): Evaluation of association between
polymorphism within the thyroglobulin gene and milk production traits in dairy cattle. J. Anim. Breed Genet.
124, 26-28.
9. Kök S, Atalay S, Savaşçı M, Eken HS (2013):
Characterization of calpastatin gene in purebred and crossbred Turkish Grey steppe cattle. Kafkas Univ. Vet.
Fak. Derg. 19, 203-206.
10. Marson PE, Ferraz JBS, Meirelles FV, Eler JP, Figueiredo LG, Mourao GB (2005): Genetic caracterization of Europen-zebu composite bovine using RFLP markers. Genet. Mol. Res. 4, 496-505.
11. Nei M (1972). Genetic distance between populations. Am. Nat. 106: 283-292.
12. Pareek CS, Zieba M, Michno J, Czaınik U, Zwierzchowski L (2008): Study of SNP C>T polymorphism within the candidate genes for dairy and beef traits in a panel of selected cattle breeds. J. Agrobiol.
25, 121-124.
13. Rincon G, Medrano JF (2006): Assays for genotyping single nucleotide polymorphismus in the bovine CAPN1 gene. Animal Genetics. 37, 294-295.
14. Schenkel FS, Miller JR, Jiang Z, Mandell IB, Ye X (2006): Association of a single nucleotide polymorphism in
the calpastatin gene with carcass and meat quality traits of beef cattle. J. Anim. Sci. 84, 291–299.
15. Zhang HM, Brown DR, Denise SK, Ax RL (1993):
Rapid communication: polymerase chain reaction-restriction fragment length polymorphism analysis of the bovine somatotropin gene. J. Anim. Sci. 71, 2276-2279. Geliş tarihi: 24.10.2014 / Kabul tarihi: 04.03.2015
Address for correspodence:
Dr. Mustafa Savaşçı Ankara University,
Graduate School of Healty Sciences, Dışkapı, Ankara, Turkey.