A content analysis of food advertising on Turkish
television
Mehtap Akçil Ok
1,*, Aydan Ercan
2, and Fatih Suleyman Kaya
31
Statistics and Computer Science, Bas¸kent University, Ankara, Turkey,
2Department of Nutrition and
Dietetics, Faculty of Health Sciences, Bas¸kent University, Ankara, Turkey, and
3Endocrinology Clinic,
Firat University Hospital, Elazig, Turkey
*Corresponding author. E-mail: [email protected]Summary
The aim of this study was to conduct a comprehensive content analysis of Television (TV) food adver-tising and compare various food advertisements on free-to-air Turkish national TV channels by broad-cast time (duration) and frequency over the period of a week (19–25 April 2012). TV food advertisements were the unit of content analysis in this study. Each advertisement identified as promoting a food prod-uct was analysed for content; non-food advertisements were not analysed, although they were counted as a proportion of the advertisements aired. We recorded all programmes for 4 h each per day (7 p.m.– 11 p.m.), totalling 84 h. Five types of food-related advertisements were identified (basic foods, junk foods, meat products, beverages and fast food), and six types of non-food advertisements. The Student t-test and ANOVA were used to compare the mean broadcast time of all prime time advertising for the two groups. The mean broadcast times for prime time, non-food advertisements showed a stat-istically significant difference (p < 0.05). This difference is related to the prime time period 7 p.m.–8 p.m. being considered dinner time for most Turkish families. Additionally, the number and broadcast times of beverage advertisements increased during this time period, while the broadcast time per beverage advertisement decreased (ratio = 20.8 s per ads). As a result, TV food advertising increased not only dur-ing dinner time but also in overall broadcast time ( per advertisement). Thesefindings may be useful for explaining how advertising can negatively influence food choices, thereby increasing public awareness of the need for health messages targeting obesity.
Key words: food advertisement, television, adults, Turkey
INTRODUCTION
Television (TV) advertising has been a major factor con-tributing to the obesity epidemic because of increasing public exposure to food advertisements. TV food adver-tisements lead consumers to eat enjoyable foods by stimu-lating emotional eating. Many studies indicate that adults and children consume substantial amounts of food cal-ories while sitting in front of the television, and many of
these calories come from unhealthy foods (Henderson and Kelly, 2005; Guran et al., 2010; Bodenlos and Wormuth, 2013). Overweight and obesity are recognized worldwide as public health problems because they frequent-ly lead to chronic diseases that are associated with high mortality rates (Adams et al., 2009; Gray-Abbatangelo et al., 2008; Ali and Crowther, 2009; Bodenlos and Wormuth, 2013;Han et al., 2013). Obesity prevalence
doi: 10.1093/heapro/dav065
© The Author 2015. Published by Oxford University Press. All rights reserved. For Permissions, please email: [email protected] Advance Access Publication Date: 30 June 2015
Article
has increased notably around the globe not only in dev-eloped countries but also in developing countries (Gray-Abbatangelo et al., 2008;Han et al., 2013). Health professionals have focused on the prevalence of the adver-tising of calorie-dense, low-nutrient foods as a major con-tributor to the obesity epidemic (Henderson and Kelly, 2005). The global epidemic of obesity is the result of a number of factors including (i) genetic susceptibility, (ii) increased availability of high-energy foods and (iii) de-creased physical activity requirements of modern society (Henderson and Kelly, 2005; Kunkel and McKinley, 2007;Harris et al., 2009). The trend toward increased sedentary behaviour, such as TV watching, contributes to obesity. The relationship between TV watching and obesity is well documented by research studies (Adams et al., 2009; Bodenlos and Wormuth, 2013; Boyland and Halford, 2013). Different aspects of the relationship have been exam-ined, but a key concern of all the studies is the influence of food advertisements on the population. Exposure to food advertisements affects food choices and nutritional habits, which can lead to increased health risks and obesity (Adams et al., 2010;Boyland and Halford, 2013;Raynor et al., 2013). It has been reported that more than 60% of overweight incidence among children and adolescents in the USA can be attributed to TV watching. Notably, it has been shown that TV watching in childhood can (inde-pendently) indicate increased body mass index in adult-hood, suggesting a causal link (Boyland and Halford, 2013). Previous research, both experimental and observa-tional, has demonstrated that there is a positive relationship between TV watching and food consumption among adults. TV watching is strongly correlated with the number of hours of TV watched and body mass index in adults, es-pecially women (Henderson and Kelly, 2005;Scully et al., 2008;Bodenlos and Wormuth, 2013;Raynor et al., 2013). A study of a sample of overweight women with diabetes found that most of the meals were consumed while watch-ing TV (Bodenlos and Wormuth, 2013).
In the USA, adult women watch∼4.5 h of TV per day (Gray-Abbatangelo et al., 2008). According to the Turkish Radio and Television Supreme Council (RTSC) 2012 re-search report, the average TV watching time in Turkey is 3.7 ± 2.3 h/day on weekdays and 4.4 ± 2.3 h/day on week-ends (RTSC, 2012).
As reported in previous studies, there is a positive rela-tionship between the number of hours of TV watching and adult obesity. Increased TV watching has been associated with increased caloric intake and decreased quality of diet among children and adolescents, which results in high consumption of foods rich in fat and low consumption of fruits and vegetables (Feldman et al., 2007; Scully et al., 2008). Data from the Youth Risk Behaviour
Survey indicated that adolescents who reported watching TV more than 2 h per day were more likely to consume in-adequate servings of fruits and vegetables compared with adolescents who reported two or fewer hours of TV watching per day (Feldman et al., 2007).
The evening meal is usually a regular and important part of people’s lives. Understanding how people cogni-tively construct (think about) the evening meal can pro-vide insight into the social and behavioural processes used in food choices (Blake et al., 2008). As emphasized in previous studies, it has been found that watching TV during main meals or family meals is associated with lower intakes of vegetables, grains and dairy foods, and higher intakes of soft drinks and fried foods, leading to in-creased body weight (Feldman et al., 2007;Scully et al., 2008;Vik et al., 2013).
A number of studies have examined food advertise-ment exposure on children’s TV programmes during prime daytime hours. However, there are few studies of food advertisement exposure during prime night-time hours. The aim of this study was to conduct a comprehen-sive content analysis of TV food advertising and to com-pare food advertisements on selected Turkish TV channels by broadcast time, frequency and prime night-time hours.
METHODS
A content analysis was conducted on TV food advertise-ments broadcast on the three most popular (according to TV ratings), free-to-air, Turkish national TV channels viewed across the whole country (RTSC, 2012). We col-lected data on TV food advertising for a week (Thursday 19 to Wednesday 25 April, 2012), from 7 p.m. to 11 p.m. During the study week, we recorded all programmes that included TV advertisements between 7 p.m. and 11 p.m. A total of 84 h of data were collected. The procedures used were similar to those of other researchers (Guran et al, 2010;Mink et al., 2010;Chapman et al., 2006).
Before analyzing the data, the advertisements were divided into two main groups: food-related advertise-ments and non-food advertiseadvertise-ments. The food-related ad-vertisement group was then divided intofive subgroups and the non-food advertisement group was divided into six subgroups, as follows:
(i) Food-related advertisements
(a) Basic foods: foods that supply necessary nutrients for the body, including milk, yogurt, cheese, bread, eggs, baby foods.
(b) Junk foods: foods high in sugar and fat and low in nutrients, including candies, packaged cakes/ cookies and other desserts, chips.
(c) Meat products: various processed meats that are easy to eat without cooking, including salami, sausage, pastrami, soujouk.
(d) Beverages: beverages such as processed fruit juices, carbonated beverages, tea and coffee. Drinking water was excluded.
(e) Fast food: foods known as fast food, also the packaged, ready-to-eat foods that require little heating, such as frozen pizza, some types of Turkish kebabs.
(ii) Non-food advertisements (a) Gasoline or various fuels.
(b) Communication and media devices. (c) Personal care products.
(d) Home decoration. (e) Home cleaning products. (f ) Finance and investment.
TV food advertisements were the unit of content analysis in this study. Each advertisement identified as promoting a food product was analysed for content; non-food advertisements were not analysed, although they were counted as a proportion of all advertisements aired. The focus was on food advertisements because of their importance in understanding and combatting obesity.
Descriptive statistics were calculated to demonstrate the percentage and frequency of advertisements. The Student t-test was used to determine the differences be-tween two advertisement groups in TV prime time periods (7 p.m. to 8 p.m.; 8 p.m. to 9 p.m.; 9 p.m. to 10 p.m.; and 10 p.m. to 11 p.m.). Analysis of variance (ANOVA) was calculated to compare the mean broadcast time of all prime time groups per advertisement groups. All statistical analyses were carried out using the Statistical Package for Social Science, version 17.0 (SPSS Inc., Chicago, IL, USA). The Student t-test was used for comparisons of continuous data and a two-sided p value <0.05 was considered statis-tically significant.
RESULTS
A total of 1588 advertisements, broadcast over 84 h of programming, were analysed. Of these, 472 (29.7%) were food-related advertisements, an average of 5.6 food-related advertisements per hour of programming. When the broadcast time of advertisements in all prime time periods was analysed, communication advertise-ments had the longest average (mean) broadcast time (120.89 s).
Comparison of broadcast number of food-related ad-vertisements was also considered by their groups (duration
in seconds) (Figure 1). The total broadcast time for food-related advertisements was 216.97 s, and the total number of advertisements was 472 (2.18 s per advertise-ment); the total broadcast time for non-food advertisements was 408.41 s and the total number of advertisements was 1116 (2.73 s per advertisement).
According to data, in a 4-h (240 min) period of TV watching duration, 21 basic food advertisements (1 adver-tisement per 11 min), 214 junk food adveradver-tisements (1 ad-vertisement per 1.12 min) and 152 beverage adad-vertisements (1 advertisement per 1.6 min) have been viewed in Figure1. The lowest average broadcast time was for the basic food advertisements (23.06 s), whereas the highest average broadcast time was for the junk food advertisements (70.21 s). The number of junk food advertisements is 10.2 times greater than the number of basic food advertise-ments (214/21). Similarly, beverage advertiseadvertise-ments are 7.23 times greater than basic foods (152/21).
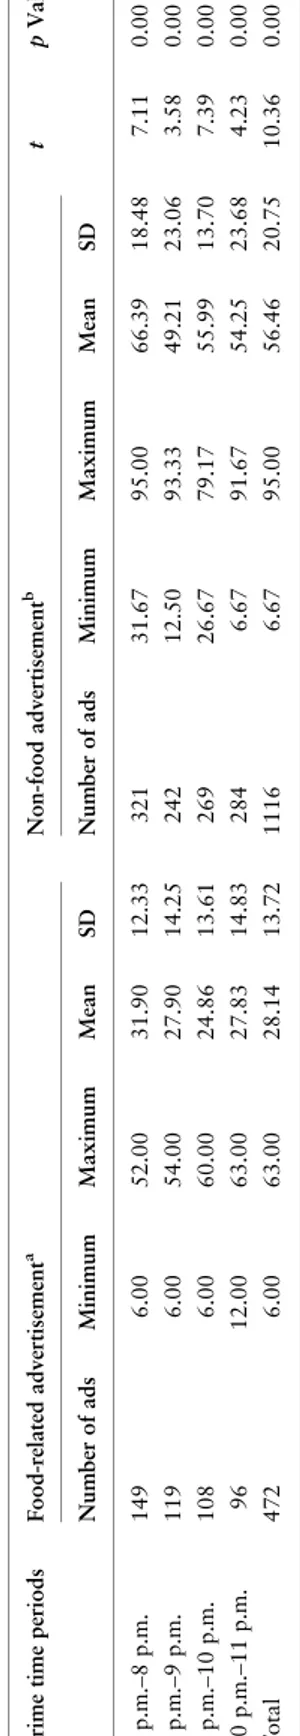
There was no statistical difference between the various food-related advertisements for the mean broadcast time, according to prime time ( p > 0.05). However, the mean broadcast time by prime time for non-food-related pro-ducts was found to have a statistically significant differ-ence ( p < 0.05). This differdiffer-ence is associated with the prime time 7 p.m. to 8 p.m. (Table1).
In every prime time, when the mean broadcast time for food-related and non-food advertisements are compared (for the four periods of time), a statistically significant Fig. 1: Comparison of non-food and food-related TV advertisements by number of ads and duration of broadcast time (in seconds), Turkish TV 2012.
difference between the two groups has been observed ( p < 0.05). In all prime time periods, the mean broadcast time for non-food advertisements was more than twice that of food-related advertisements (Table1).
Table2shows trends in advertisement numbers and broadcast times during the prime time periods. Beverage and junk food advertisements are at the highest frequency between 7 p.m. and 9 p.m. Of the 472 food-related adver-tisements, only 21 were related to basic foods. However, despite the number of total advertisements decreased, broadcast time per advertisement increased through the prime time periods. As indicated in Table2, while the number and broadcast time of beverage advertisements in-creased during 7 p.m. to 8 p.m., the broadcast time per beverage advertisement decreased (ratio = 20.8).
DISCUSSION
This study presents data on broadcast timing and fre-quency of food-related advertisements and non-food advertisements on free-to-air national Turkish TV chan-nels. We compared food-related and non-food advertise-ments with respect to the broadcast time and frequency during the prime time period (7 p.m. to 11 p.m.) on Turkish TV channels during 1 week in 2012. We focused on advertisements during night-time prime time television, when adults are most likely to be watching TV, in contrast to other research studies that have mainly focused on chil-dren’s programmes and associated food advertisements (Feldman et al., 2007; Kunkel and McKinley, 2007; Harris et al., 2009; Han et al., 2013). However, we found that the prime time period attracts both adults and children, and large numbers of children continue watching TV until midnight (Guran et al., 2010). Health authorities believe that the accumulation of unhealthy messages communicated to children through food adver-tising is a leading cause of consumption of unhealthy foods (Harris et al., 2009). Behaviours adopted early in life can predict later habits; it is not surprising that more time spent watching TV during youth is a strong predictor of compromised health later in life (Boulos et al., 2012). It is important to consider the possible negative effects of exposure to food-related TV advertisements, especially the health effects on adults.
According to RTSC research on trends in TV watching, in 2012 TV watching time among all age groups was highest between 6 p.m. and 9 p.m. (53.7%) and between 9 p.m. and 12 a.m. (61.0%) on weekdays; on weekend days, exposure was even higher: 6 p.m. to 9 p.m. (57.1%) and 9 p.m. to 12 a.m. (70.2%). The highest aver-age durations of TV watching on weekdays were 2 h (23.5%), 3 h (23.5%) and 4 h (16.4%). On weekend T able 1: C omparison of food-r ela ted adv ertisements and non-food adv ertisements on TV by number of ads and br oadcas t time of ads in seconds (minimum, maximum a nd mean), a ccording to the prime time br oadcas t periods, T urkish TV 2012 Prime time periods F ood-r ela ted adv ertisement a Non-food adv ertisement b tp V alue Number of ads Minimum Maximum Mean SD Number of ads Minimum Maximum Mean SD 7 p.m. –8 p.m. 149 6.00 52.00 31.90 12.33 321 31.67 95.00 66.39 18.48 7.11 0.00 8 p.m. –9 p.m. 119 6.00 54.00 27.90 14.25 242 12.50 93.33 49.21 23.06 3.58 0.00 9 p.m. –10 p.m. 108 6.00 60.00 24.86 13.61 269 26.67 79.17 55.99 13.70 7.39 0.00 10 p.m. –11 p.m. 96 12.00 63.00 27.83 14.83 284 6.67 91.67 54.25 23.68 4.23 0.00 T otal 472 6.00 63.00 28.14 13.72 1116 6.67 95.00 56.46 20.75 10.36 0.00 SD, standard devia tion. aF = 0.930; p = 0.45. bF = 2.69; p = 0.041.
days, average duration of TV watching was higher: 3 h (17.9%), 4 h (17.7%) and 5 h (17.0%) (RTSC, 2012). Han et al. (Han et al., 2013) reported that adult Korean women spent∼3 h per day, on average, watching TV in 2010, slightly longer than men. In the USA, the average adult woman watches about 4.5 h of TV per day (Gray-Abbatangelo et al., 2008).
Exposure to food advertising is positively correlated with the TV watching time (Harris et al., 2009). The RTSC study found that 56.4% of people change the chan-nel (on advertisements), 30.8% watch part of the advertise-ments and 10.7% watch the advertiseadvertise-ments completely. Among TV watchers, 62.5% were disturbed by the fre-quency of all advertisements, while only 4.4% were dis-turbed by the frequency of food product advertisements (RTSC, 2012).
In this study, a total of 1588 advertisements broadcast during 84 h of programming were analysed. Approximately one-third (29.7%) of these advertisements were food-related, which is an average of 5.6 advertisements per hour.
A study by Adachi-Mejia et al. (Adachi-Mejia et al., 2011) found that food advertisements make up a large proportion of TV advertising, an estimated 23–57% of all TV commercials, depending on the channel and time of day. In a study by Guran et al. (Guran et al., 2010) cov-ering 256 h of TV broadcasting that included 8853 TV ad-vertisements, a total of 2848 (32.1%) were found to be related to food. The same study reported that of 43.1 h of advertising, 16.2 h (37%) were food or beverage adver-tisements (Guran et al., 2010).
Frequency of food-related advertisements was 5.1 per hour in Canada.Adams et al. (2009) andGuran et al. (2010) noted that the Canadian data showed a slightly smaller proportion of food advertisements among all TV advertisements (∼32%), compared with the USA (47%). In the present study, junk food advertisements have the highest frequency in both broadcast time and number. Fast food and beverage advertisements are higher in broadcast time and number than basic food advertise-ments. The differences were found statistically significant. Several studies have shown that the majority of advertise-ments broadcast on TV are for foods that are high in en-ergy density and low in nutritional value, and these foods are considered unhealthy (Adachi-Mejia et al., 2011; Dovey et al., 2011; Boyland and Halford, 2013; Han et al., 2013). In our study, it was found that unhealthy foods such as junk foods, beverages and fast foods have the highest percentage in total food-related advertisement (88.7%). Another Turkish study found similar results: 81% of food advertisements on TV were for foods low in nutritional value and high in fat and sugar (Guran et al., 2010). T able 2: Number of ads, dur a tion of br oadcas t time (in seconds) and the ra tio of br oadcas t time to ads (br oadcas t time/number of ads) by prime time periods and fo od-r ela ted adv ertising gr oups, T urkish TV 2012 F ood-r ela ted adv ertising gr oup Prime time periods 7 p.m. –8 p.m. 8 p.m. –9 p.m. 9 p.m. –10 p.m. 10 p.m. –11 p.m. Number Br oadcas t time Ra tio a Number Br oadcas t time Ra tio a Number Br oadcas t time Ra tio a Number Br oadcas t time Ra tio a Basic foods 6 155 25.83 3 60 20.00 9 155 17.22 3 45 15.00 Junk foods 64 1525 23.83 58 1320 22.76 52 1345 25.87 40 1005 25.13 Mea t pr oducts 10 195 19.50 5 185 37.00 8 220 27.50 9 255 28.33 Bev er ages 56 1165 20.80 36 850 23.61 28 620 22.14 32 880 27.50 F as t food 13 310 23.85 17 375 22.06 11 270 24.55 12 320 26.67 T otal 149 3350 22.5 119 2790 23.4 108 2610 24.2 96 2505 26.1 aRa tio = (br oadc as t time/number).
According to RTSC reports, the highest TV watching period is between 6 p.m. and 12 a.m. on weekdays. An in-crease in the proportion of food advertisements among all advertisements broadcast during the prime time has also been noted. This study found that not only advertisements in general, but food-related advertisements in particular, increased during the 7 p.m. to 8 p.m. prime time period. This is the culture in Turkey, where dinner time for most families is during this time period. Several studies have indicated that when exposed to food advertisements, both children and adults consumed more foods than did those not exposed to food advertisements (Scully et al., 2008; Harris et al., 2009; Guran et al., 2010; Boulos et al., 2012;Bacardí-Gascón et al., 2013;Bodenlos and Wormuth, 2013;Boyland and Halford, 2013).
Consumption behaviours can also be activated through automatic processes such as external cues which may not be related to the sensory qualities of food and af-fect the amount consumed without the consumer’s knowl-edge (Gray-Abbatangelo et al., 2008;Harris et al., 2009; Wonderlich-Tierney et al., 2013). In some families, watch-ing TV durwatch-ing meals is common practice, with a reported 64% of children aged 11–18 watching TV during meals (Feldman et al., 2007;Powell et al., 2007). In similar stud-ies it is reported that watching TV during a meal contri-butes to increased energy intake and could thereby be associated with increased consumption of unhealthy foods and body mass index (Feldman et al., 2007; Boulos et al., 2012;Vik et al., 2013).
The intentional use of certain items in TV programmes is a form of promotion in which advertisers methodically place brand-name products ( product placement). There are three basic forms of product placement: (i) visual: a specific product, logo, or sign is prominently shown; (ii) auditory: the product is specifically mentioned or (iii) a product is part of the background but attention is not drawn to it during a programme (Boulos et al., 2012). Visual and verbalfigures examined in a research study were used to produce mental images that led to more favourable attitudes towards advertisements. The re-sults of this research showed that visualization and audi-tory content can contribute to strengthening the recall of advertising messages (Mzoughi and Abdelhak, 2011). Children have been found to recognize brand logos at very young ages and a recent study found that preschoo-lers exhibited significantly higher preferences for food and beverage items in branded versus plain packaging (Powell et al., 2010).
Many researchers have reported that snack advertis-ing has increased consumption of unhealthy foods, as much by adults as by children, because the power of food-related advertising is that it promotes automatic
eating behaviours, and the influence of food advertising extends far beyond brand preference alone. Furthermore, the effects of food-related advertisements persist after the viewing session (Halford et al., 2004;Lobstein and Dibb, 2005;Feldman et al., 2007;Scully et al., 2008;Harris et al., 2009;Dovey et al., 2011).
In comparing broadcast time and number of food-related advertisements, the basic food group advertise-ments have 1.09 s per ad of broadcast time. On the other hand, the broadcast time is 0.33 s per ads for junk foods and 0.36 s per ad for beverages. It indicates that the exposure to junk food and beverage advertisements is shorter than other basic advertisements. The ratio of junk food advertisement is 10.19 times more than basic food advertisements. Similarly, beverage advertisements are 7.23 times more than basic foods. Despite these wide range ratios, the broadcast time of junk food advertise-ments are 3.04 times more than basic foods and the expos-ure for beverage advertisements is 2.38 times more than basic foods.
Thefindings of this study can be accepted as potential visual and auditory effects of food advertisements which are reported in the previous research (Boulos et al., 2012). Many studies emphasize the link between high body mass index and exposure to food advertisements while watching TV. TV food advertisements may not be related to a particular product but, in many cases, the placement of foods and the use of brand-name items are intentional. Familiarity with the advertised food, includ-ing characteristics such as taste and smell, provoke the de-sire to consume not only the advertised food but also similar products; this behaviour pattern relates to the sense of initial hunger reported by study participants (Harris et al., 2009;Boulos et al., 2012;Bacardí-Gascón et al., 2013). Behaviours can be learned through observa-tion, and repeated exposure to stimuli such as food adver-tisements can produce individual responses. External cues have a significant influence on food consumption beha-viours. The sensory properties of food items or the images of attractive models eating, snacking and expressing posi-tive emotions about food consumption have the effect of increasing food consumption and contributing to chan-ging patterns of food choices (Gray-Abbatangelo et al., 2008;Harris et al., 2009). The impact of TV food adver-tisements continues long after the advertisement has been viewed because of the mental link established between re-membering food advertisements and eating more of these foods. Thisfinding indicates that susceptibility to food cues contributes to overeating and promotes weight gain in individuals (Dixon et al., 2007;Calvert, 2008).
In our knowledge, this is thefirst descriptive study which aimed to determine the broadcast time, number
and content of food advertisements on free-to-air Turkish TV Channels during night prime time. In this study, the food preferences related to food advertisements were not analysed. However, this study is important to raise aware-ness about the possible negative effects of food advertise-ment according to TV watching time.
REFERENCES
Adachi-Mejia A. M., Sutherland L. A., Longacre M. R., Beach M. L., Titus-Ernstoff L., Gibson J. J., et al. (2011) Adolescent weight status and receptivity to food TV advertisements. Journal of
Nutrition Education and Behavior, 43, 441–448.
Adams J., Hennessy-Priest K., Ingimarsdóttir S., Sheeshka J., Østbye T., White M. (2009) Changes in food
advertise-ments during‘prime-time’ television from 1991 to 2006
in the UK and Canada. British Journal of Nutrition, 102,
584–593.
Adams J., Tyrrell R., White M. (2010) Do television food
adver-tisements portray advertised foods in a‘healthy’ food
con-text? British Journal of Nutrition, 105, 810–815.
Ali A. T., Crowther N. J. (2009) Factors predisposing to obesity: a review of the literature. Journal of Endocrinology,
Metabolism and Diabetes of South Africa, 14, 81–84.
Bacardí-Gascón M., Díaz-Ramírez G., López B. C., Zuñiga E.
L., Jiménez-Cruz A. (2013) TV food advertisements’
effect on food consumption and adiposity among women and children in Mexico. Nutrición Hospitalaria, 28,
1900–1904.
Blake C. E., Bisogni C. A., Sobal J., Jastran M., Devine C. M. (2008) How adults construct evening meals. Scripts for food
choice. Appetite, 51, 654–662.
Bodenlos J. S., Wormuth B. M. (2013) Watching a food-related television show and caloric intake. A laboratory study.
Appetite, 61, 8–12.
Boulos R., Vikre E. K., Oppenheimer S., Chang H.,
Kanarek R. B. (2012) ObesiTV: how television is in
fluen-cing the obesity epidemic. Physiology and Behavior, 107,
146–153.
Boyland E. J., Halford J. C. G. (2013) Television advertising and branding. Effects on eating behaviour and food preferences in
children. Appetite, 62, 236–241.
Calvert S. L. (2008) Children as consumers: advertising and
mar-keting. The Future of Children, 18, 205–234.
Chapman K., Nicholas P., Supramaniam R. (2006) How much food advertising is there on Australian television? Health
Promotion International, 21, 172–180.
Dixon H. G., Scully M. L., Wakefield M. A., White V. M.,
Crawford D. A. (2007) The effects of television
advertise-ments for junk food versus nutritious food on children’s
food attitudes and preferences. Social Science and Medicine,
65, 1311–1323.
Dovey T. M., Taylor L., Stow R., Boyland E. J., Halford J. C. G. (2011) Responsiveness to healthy television (TV) food adver-tisements/commercials is only evident in children under the
age of seven with low food neophobia. Appetite, 56,
440–446.
Feldman S., Eisenberg M. E., Neumark-Sztainer D., Story M. (2007) Associations between watching TV during family meals and dietary intake among adolescents. Journal of
Nutrition Education and Behavior, 39, 257–263.
Gray-Abbatangelo J., Byrd-Bredbenner C., Austin S. B. (2008) Health and nutrient content claims in food advertisements on Hispanic and mainstream prime-time television. Journal
of Nutrition Education and Behavior, 40, 348–354.
Guran T., Turan S., Akcay T., Degirmenci F., Avci O., Asan A., et al. (2010) Content analysis of food advertising in Turkish television. Journal of Paediatrics and Child Health, 46,
427–430.
Halford J. C. G., Gillespie J., Brown V., Pontin E. E., Dovey T. M. (2004) Effect of television advertisements for foods on food consumption in children. Appetite, 42, 221–225.
Han E., Powell L. M., Kim T. H. (2013) Trends in exposure to television food advertisements in South Korea. Appetite, 62,
225–231.
Harris J. L., Bargh J. A., Brownell K. D. (2009) Priming effects of television food advertising on eating behavior. Health
Psychology, 28, 404–413.
Henderson V. R., Kelly B. (2005) Food advertising in the age of obesity: content analysis of food advertising on general mar-ket and African American television. Journal of Nutrition
Education and Behavior, 37, 191–196.
Kunkel D., McKinley C. (2007) Developing ratings for food pro-ducts: lessons learned from media rating systems. Journal of
Nutrition Education and Behavior, 39(2 Suppl), S25–S31.
Lobstein T., Dibb S. (2005) Evidence of a possible link between obesogenic food advertising and child overweight. Obesity
Reviews, 6, 203–208.
Mink M., Evans A., Moore C. G., Calderon K. S., Deger S. (2010) Nutritional imbalance endorsed by televised food advertise-ments. Journal of the American Dietetic Association, 110, 904–910.
Mzoughi N., Abdelhak S. (2011) The impact of visual and verbal rhetoric in advertising on mental imagery and recall. International Journal of Business and Social Science, 2, 257–267.
Powell L. M., Szczypka G., Chaloupka F. J. (2007) Adolescent exposure to food advertising on television. American
Journal of Preventive Medicine, 33(4 Suppl), S251–S256.
Powell L. M., Szczypka G., Chaloupka F. J. (2010) Trends in exposure to television food advertisements among children and adolescents in the United States. Archives of Pediatrics
and Adolescent Medicine, 164, 794–802.
Radio and Television Supreme Council (RTSC) (2012) Research 3
on Television Watching Tendencies.http://www.bianet.org/
system/uploads/1/files/attachments/000/000/854/original/TV.
pdf?1369050412(last accessed 24 March 2014).
Raynor H. A., Steeves E. A., Bassett D. R. Jr, Thompson D. L., Gorin A. A., Bond D. S. (2013) Reducing TV watching during adult obesity treatment: Two pilot randomized controlled
trials. Behavior Therapy, 44, 674–685.
Scully M., Dixon H., Wakefield M. (2008) Association between commercial television exposure and fast-food consumption
among adults. Public Health Nutrition, 12, 105–110.
Vik F. N., Bjørnarå H. B., Øverby N. C., Lien N., Androutsos O., Maes L., et al. (2013) Associations between eating meals, watching TV while eating meals and weight status among
children, ages 10–12 years in eight European countries: the ENERGY cross-sectional study. Journal of Behavioral
Nutrition and Physical Activity, 10, 58–68.
Wonderlich-Tierney A. L., Wenzel K. R., Vander Wal J. S., Wang-Hall J. (2013) Food-related advertisements and food
intake among adult men and women. Appetite, 71, 57–62.