Meltem Akcaboy*, Bijen Nazliel, Tayfun Goktas, Serdar Kula, Bülent Celik and Necla Buyan
Whole blood viscosity and cerebral blood flow
velocities in obese hypertensive or obese
normotensive adolescents
https://doi.org/10.1515/jpem-2017-0436Received July 3, 2017; accepted January 2, 2018
Abstract
Background: Obesity affects all major organ systems and
leads to increased morbidity and mortality. Whole blood
viscosity is an important independent regulator of cerebral
blood flow. The aim of the present study was to evaluate the
effect of whole blood viscosity on cerebral artery blood flow
velocities using transcranial Doppler ultrasound in
pediat-ric patients with obesity compared to healthy controls and
analyze the effect of whole blood viscosity and blood
pres-sure status to the cerebral artery blood flow velocities.
Methods: Sixty patients with obesity diagnosed
accord-ing to their body mass index (BMI) percentiles aged
13–18 years old were prospectively enrolled. They were
grouped as hypertensive or normotensive according to
their ambulatory blood pressure monitoring. Whole blood
viscosity and middle cerebral artery velocities by
tran-scranial Doppler ultrasound were studied and compared
to 20 healthy same aged controls.
Results: Whole blood viscosity values in hypertensive
(0.0619 ± 0.0077 poise) and normotensive (0.0607 ± 0.0071
poise) groups were higher than controls (0.0616 ± 0.0064
poise), with no significance. Middle cerebral artery
blood flow velocities were higher in the obese
hyperten-sive (73.9 ± 15.0 cm/s) and obese normotenhyperten-sive groups
(75.2 ± 13.5 cm/s) than controls (66.4 ± 11.5 cm/s), but with
no statistical significance.
Conclusions: Physiological changes in blood viscosity and
changes in blood pressure did not seem to have any direct
effect on cerebral blood flow velocities, the reason might
be that the cerebral circulation is capable of adaptively
modulating itself to changes to maintain a uniform
cer-ebral blood flow.
Keywords: adolescents; cerebral blood flow; children;
hypertension; obesity; whole blood viscosity.
Introduction
The prevalence of obesity is increasing significantly in the
pediatric age group worldwide and is an epidemic public
health problem in both many developed and developing
countries [1]. Obesity affects all major organ systems and
leads to increased morbidity and mortality due to
hyper-tension, dyslipidemia, diabetes, cardiovascular and renal
diseases [2–4].
Whole blood viscosity (WBV) is an important
independent regulator of cerebral blood flow (CBF) [5].
Hematocrit and serum proteins are the leading
compo-nents of whole blood viscosity. Abnormal increases in
each of them may result in increased WBV and reduced
CBF [6].
Transcranial Doppler ultrasound (TCD) is a
nonin-vasive technique that evaluates velocity, direction and
other properties of blood flow in basal cerebral arteries by
means of a pulsed ultrasonic beam. Flow velocities have
been shown to be consistent with direct invasive flow
measurements [7, 8].
The aim of the current study was to evaluate the effect
of WBV on cerebral artery blood flow velocities using TCD
in obese hypertensive or normotensive pediatric patients
compared to healthy controls.
Materials and methods
Sixty pediatric patients aged between 13 and 18 years old who were followed-up for obesity were included prospectively in the study. The study population consisted of 60 patients who were followed-up for
*Corresponding author: Meltem Akcaboy, MD, Gazi University
School of Medicine, Department of Pediatric Nephrology, Konya yolu, 06500, Besevler, Ankara, Turkey, Phone: +90 312 204 44 44, Fax: +90 312 221 32 02, E-mail: [email protected]
Bijen Nazliel: Gazi University School of Medicine, Department of
Neurology, Ankara, Turkey, E-mail: [email protected]
Tayfun Goktas: Gazi University School of Medicine, Department of
Physiology, Ankara, Turkey, E-mail: [email protected]
Serdar Kula: Gazi University School of Medicine, Department of
Pediatric Cardiology, Ankara, Turkey, E-mail: [email protected]
Bülent Celik: Gazi University, Faculty of Science, Department of
Biostatistics, Ankara, Turkey, E-mail: [email protected]
Necla Buyan: Gazi University School of Medicine, Department of
obesity for at least 3 years. Patients were divided into two groups based on ambulatory blood pressure monitoring (ABPM) measure-ments, with one group consisting of obese hypertensive children (34 patients) and the second group comprising obese normotensive children (26 patients). The children in the study population did not have any acute or chronic kidney, cardiac or neurological disorders and were not taking any medication. The control group consisted of 20 healthy normotensive children aged between 13 and 18 years, who were not obese, did not have any kidney, cardiac or neurological disorders and were not taking any medication. These children were selected from children admitted to the Children’s and Adolescent Out-patient Clinic for follow-up and subsequently diagnosed as healthy. The study protocol was in accordance with the Helsinki declaration of human rights, and was approved by the Local Ethics Committee. Written informed consent was obtained from the children’s parents and assent was obtained from participating children and also from the control group. A face-to-face questionnaire was conducted in order to record the family history, symptoms and cerebrovascular and cardiovascular events. Demographic data and anthropometric characteristics were collected.
Anthropometric measurements
Height was measured with a stadiometer and weight was meas-ured on a calibrated scale with the child wearing light clothing. The body mass index (BMI) was calculated as the ratio of weight/ height2 (kg/m2). The control group consisted of the same age and
gender healthy controls who were not obese and also not hyper-tensive. Obesity was defined, according to the BMI percentiles for the Turkish population based on gender and age, as being ≥95th percentile [9].
Serum blood sample measurements
Biochemical assessments were performed under fasting conditions in the early morning. Blood glucose, lipids and routine laboratory parameters were measured using enzymatic spectrophotometric methods on an automated clinical chemistry analyzer (Olympus AU2700 plus analyzer, Beckman Coulter Inc., Pasadena, CA, USA). Insulin levels were measured using an electrochemiluminescence immunoassay method (Architect i2000 Analyzer; Abbott Laborato-ries, Chicago, IL, USA).
Insulin resistance
Insulin resistance (IR) was analyzed using the homeostasis model assessment of insulin resistance (HOMA-IR). HOMA-IR was calcu-lated by the following formula: [fasting glucose (mg/dL) × fasting insulin (U/L)]/405. We assessed insulin sensitivity by using the HOMA-IR index as a surrogate marker of insulin resistance. The HOMA-IR values were calculated using the following formula: fast-ing insulin level (in μIU/mL) multiplied by fastfast-ing glucose level (in mg/dL) and divided by 405. The cut-off point for HOMA-IR was deter-mined as 5.22 in boys and 3.82 in girls [10].
Office blood pressure measurements
On the day of ambulatory blood pressure measurement, the blood pressures and heart rates of each subject were measured 3 times con-secutively in the seated position, at 5-min interval, using a mercury sphygmomanometer as recommended in the published data [11]. The mean of three readings was recorded as the office blood pres-sure. Systolic blood pressure or diastolic blood pressure percentiles were calculated according to the normograms recommended by the National High Blood Pressure in Children and Adolescents Insti-tute [12]. Hypertension is diagnosed in a patient if the mean systolic blood pressure or diastolic blood pressure is above the 95th percen-tile for sex, age and height on three or more occasions. A child was diagnosed as normotensive if both systolic blood pressure and/or diastolic blood pressure percentiles were <90th percentile. Prehyper-tension was diagnosed if both or either of the systolic blood pressure and diastolic blood pressure percentiles were ≥90th percentile but both were <95th. For the classification of hypertension, each patient was evaluated by ambulatory blood pressure monitoring.
Ambulatory blood pressure monitoring measurements
Validated oscillometric devices were used to measure ambulatory blood pressures (Spacelabs monitor model no: 90207; SpaceLabs Medical, Redmond, WA, USA). The appropriate cuff, chosen from three different sizes available, was attached to the non-dominant arm. The frequency of automated reading was programmed at 20-min intervals from 8:00 AM to 12:00 AM and at 30-min intervals from 12:00 AM to 6:00 PM. ABPM was performed during a normal weekday that included normal daily activities. Each recording began between 8:30 AM and 9:00 AM. For data analysis, the whole 24-h, awake (between 8:00 AM and 10:00 PM), and sleep (between 12:00 AM and 6:00 AM) periods were considered separately. Awake and sleep periods were defined according to fixed, narrow, clock time intervals, which more closely correspond with the awake and sleep behavioral conditions in all of the subjects. Average of systolic blood pressure and diastolic blood pressure, over 24-h, awake and sleep periods were calculated. ABPM data (24-h mean systolic blood pres-sure and diastolic blood prespres-sure, daytime systolic blood prespres-sure and diastolic blood pressure, nighttime systolic blood pressure and diastolic blood pressure) were registered. Elevated blood pressure load was defined as more than 25% of recordings of systolic blood pressure or diastolic blood pressure measurements being ≥95th per-centile for gender and height, respectively [13]. Office blood pressure percentiles, 24-h mean systolic blood pressure and 24-h mean dias-tolic blood pressure percentiles and sysdias-tolic and diasdias-tolic blood pres-sure load were used to classify hypertension in patients [14]. Patients were grouped as having white-coat hypertension, masked hyperten-sion, ambulatory hypertension and severe ambulatory hypertenhyperten-sion, respectively, according to the data [14].Transcranial Doppler ultrasound measurements
Middle cerebral artery blood flow velocity was examined by TCD on the same day of the echocardiographic evaluation by the same neurologist who was blind to the groups in obese patients. Middle cerebral arteries; responsible for ≥80% CBF were insonated through
the temporal windows using standardized protocol. Mean (Vim) velocities of right and left middle cerebral artery (MCA) flow was recorded at depths of 50–60 mm, with a 2-MHz probe by the tech-nique described elsewhere by Aisled [7]. For intraobserver variabil-ity MCA blood flow velocvariabil-ity measurements was performed at least 3 times in succession, between each measurement the Doppler probe was moved-out and analysis point was re-positioned. Only measure-ments with the best signal-to noise ratio were used and the high-est values for CBF velocities were selected for analysis. From these measurements, we have chosen the highest value for analysis. Sam-ple volume was 8–10 mm in the axial and 5 mm in the lateral direc-tion at the depth of 50 mm. All TCD studies were performed with the use of commercially available TCD apparatus Viasys/Sonara (Cardi-nal Health, Madison, WI, USA).
Whole blood viscosity measurements
WBV was studied immediately on the same day of hematological evaluations. Viscoelastic properties were determined via measure-ment of oscillatory flow in a cylindrical tube called Vilastic Biopro-filer (Vilastic scientific, Inc., Austin, TX, USA). For this measurement, 0.5 mL of sample was used. Before the measurement, the tube was filled with de-ionized water at 37 °C. When the temperature equilib-rium was established, the viscosity of de-ionized water was meas-ured and substituted from the sample’s viscosity. This was done to eliminate the effect of transport medium on the measurement of the sample’s viscosity. All the measurements were performed under con-stant temperature. To establish this, the device was assured to run under constant temperature for at least 40 min before making all the measurements. To eliminate the effect of time interval between gathering the sample and making the measurement, all the samples were evaluated after a certain and constant time period. The results of viscosity were given as poise units.
Statistical analysis
A power analysis was performed using NCSS PASS 2008 software to determine the appropriate sample size required for the study. The sample size calculation was based on a clinically significant differ-ence of 10 cm/s for middle cerebral artery blood flow velocity with a standard deviation of 8 cm/s, a significance level of 0.05 and a power of 80%, a significance level of 0.05 and a power of 80%. This gave a required sample size of 20 subjects per group with a total of 60 subjects. A 10 cm/s difference in middle cerebral artery blood flow velocity was deemed to be clinically significant according to research previously carried out [6, 15–19]. Data analysis was performed using SPSS 15.0 (Statistical Package for the Social Sciences, Chicago, IL, USA). Normal distribution was tested by the Kolmogorov-Smirnov test or Shaphiro-Wilk test. Continuous variables were presented as a mean and standard deviation for normal distribution or median with interquartile range (IQR) for non-normal distribution, and categori-cal variables were presented as percentages. The chi-squared (χ2) test
was used for categorical variables. Continuous variables were com-pared using the t-test for two groups and one-way analysis of vari-ance (ANOVA) with Tukey’s post-hoc test or the Kruskal-Wallis H test with a Bonferroni adjusted Mann-Whitney U-test for three groups. Pearson’s or Spearman’s correlation coefficient was used to explore
the associations among variables. A p-value <0.05 was considered to be statistically significant.
Results
Obese patients were divided into two groups: obese
hypertensive (n = 34: 16 males, 18 females, mean age:
14.9 ± 1.3 years) and obese normotensive (n = 26: 11 males,
15 females, mean age: 14.7 ± 1.5 years). For controls, we
studied with 20 subjects (10 males, 10 females) in the
same age range (15.5 ± 1.7 years) with no hypertension or
obesity. Our control group did not have any nephrological
or neurological disorder either. General characteristics of
the patients and control subjects are presented in Table 1.
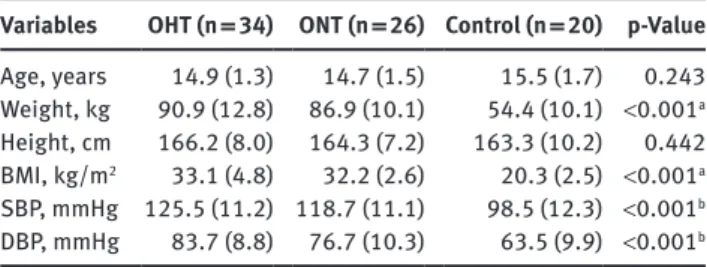
Weight and BMI values were significantly higher in
the obese hypertensive and obese normotensive groups
than the normal controls (p < 0.05). Systolic and diastolic
blood pressures were significantly higher in the obese
hypertensive group compared with the controls and obese
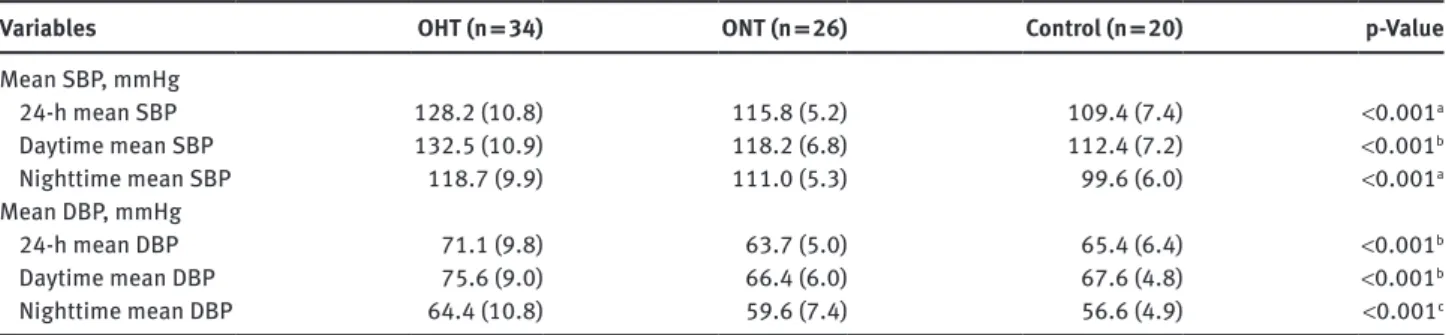
normotensive group (p < 0.05) (Table 1). Mean systolic and
diastolic blood pressures were significantly higher in the
obese hypertensive group than the obese normotensive
and control groups (p < 0.001) (Table 2). The ABPM data
and restricted laboratory data of the study group were
recently published [20].
In the patient family histories, the prevalence of
having hypertension was higher in the obese
normoten-sive (66.7%) and obese hypertennormoten-sive groups (80%) than
in the controls (14.3%). In the obese hypertensive group,
family histories of smoking and cerebrovascular and
car-diovascular diseases were significantly higher than those
in the other groups (Table 3). The most common complaint
of patients on admission was headache with 25 patients
(41.7%). Twenty (58.8%) patients in the obese
hyperten-sive group and 5 (18.5%) in the obese normotenhyperten-sive group
Table 1: General characteristics of the patients and controls. Variables OHT (n = 34) ONT (n = 26) Control (n = 20) p-Value
Age, years 14.9 (1.3) 14.7 (1.5) 15.5 (1.7) 0.243 Weight, kg 90.9 (12.8) 86.9 (10.1) 54.4 (10.1) <0.001a Height, cm 166.2 (8.0) 164.3 (7.2) 163.3 (10.2) 0.442 BMI, kg/m2 33.1 (4.8) 32.2 (2.6) 20.3 (2.5) <0.001a SBP, mmHg 125.5 (11.2) 118.7 (11.1) 98.5 (12.3) <0.001b DBP, mmHg 83.7 (8.8) 76.7 (10.3) 63.5 (9.9) <0.001b
Data was presented as mean (SD). aControl group differed from the
OHT and ONT groups. bThe groups differed from each other. SBP,
systolic blood pressure; DBP, diastolic blood pressure; OHT, obese hypertensive group; ONT, obese normotensive group.
complained of headache and was significantly higher in
the hypertensive group (p = 0.001). Other
accompany-ing symptoms, such as nausea, vertigo, tinnitus, blurry
vision, neck pain, syncope attacks and epistaxis did not
differ significantly among the groups (p > 0.05).
The biochemical values and selected laboratory data
of patients and controls are presented in Table 4. The
numbers of white blood cells and platelets were
signifi-cantly higher in the obese normotensive and obese
hyper-tensive groups than the controls (p < 0.05).
Table 3: Family history.
Variables OHT (n = 34) ONT (n = 26) Control (n = 20) p-Value
Hypertension 27 (79.4) 18 (69.2) 2 (10.0) <0.001a
History of smoking 20 (58.8) 5 (19.2) 10 (50.0) 0.007b
Cerebrovascular disease 9 (26.5) 3 (11.5) 6 (30.0) 0.254
Myocardial infarction-cardiovascular disease 16 (47.1) 4 (15.4) 8 (40.0) 0.034b
Data was presented as frequencies (percentage). aControl group differed from the OHT and ONT groups. bONT group differed from the control.
OHT, obese hypertensive group; ONT, obese normotensive group.
Table 4: Selected laboratory data of the study group.
Variables OHT (n = 34) ONT (n = 26) Control (n = 20) p-Value
Hb, g/dL 14.0 ± 1.0 13.6 ± 1.4 14.4 ± 1.3 0.074 Rbc, ×104/mm3 5.0 ± 0.4 4.9 ± 0.6 5.0 ± 0.5 0.624 MCV, fl 82.6 ± 5.5 82.4 ± 6.5 85.2 ± 5.2 0.204 Htc, % 41.7 (38.9–42.9) 40.5 (37.8–42.0) 42.2 (40.2–44.6) 0.078 WBC, ×103/mm3 7.45 (6.83–8.20) 6.63 (5.85–7.98) 5.95 (5.24–6.93) 0.002a PLT, ×103/mm3 300.9 (265–330.6) 276.1 (255.0–336.9) 234.1 (212.6–271.55) 0.001a Fasting glucose, mg/dL 87.0 (81.0–91.0) 86.0 (81.0–92.0) 90.0 (88.0–93.0) 0.035b Insulin, U/mL 19.6 ± 7.5 17.8 ± 7.6 0.350 HOMA-IR index 4.2 ± 1.6 3.9 ± 1.8 0.401 Total protein, g/dL 7.8 (7.5–8.0) 7.7 (7.6–7.9) 7.7 (7.6–7.9) 0.367 Albumin, g/dL 4.6 ± 0.3 4.6 ± 0.2 4.8 ± 0.2 0.074 WBV (poise) 0.0619 ± 0.0077 0.0607 ± 0.0071 0.0616 ± 0.0064 0.817 MCABFV, cm/s 73.9 ± 15.0 75.2 ± 13.5 66.4 ± 11.5 0.079 Total cholesterol, mg/dL 172.8 ± 24.1 159.0 ± 26.7 150.0 ± 34.0 0.013b Triglyceride, mg/dL 120.0 (98.0–162.0) 102.0 (77.0–133.0) 80.5 (62.5–95.0) <0.001a
Data was presented as mean ± standard deviation or median (IQR). OHT, obese hypertensive patients; ONT, obese normotensive patients; Hb, hemoglobin; Rbc, red blood cell count; MCV, mean corpuscular volume; Htc, hematocrit; WBC, white blood cell; PLT, platelet count; HOMA-IR index, the homeostasis model assessment of insulin resistance calculated as: plasma insulin (U/mL) × plasma glucose (mg/dL)/405; WBV, whole blood viscosity; MCABFV, middle cerebral artery blood flow velocity. ap < 0.05 for control versus OHT and ONT; bp < 0.05 for control versus OHT.
Table 2: Blood pressure measurements in the patients and controls.
Variables OHT (n = 34) ONT (n = 26) Control (n = 20) p-Value
Mean SBP, mmHg 24-h mean SBP 128.2 (10.8) 115.8 (5.2) 109.4 (7.4) <0.001a Daytime mean SBP 132.5 (10.9) 118.2 (6.8) 112.4 (7.2) <0.001b Nighttime mean SBP 118.7 (9.9) 111.0 (5.3) 99.6 (6.0) <0.001a Mean DBP, mmHg 24-h mean DBP 71.1 (9.8) 63.7 (5.0) 65.4 (6.4) <0.001b Daytime mean DBP 75.6 (9.0) 66.4 (6.0) 67.6 (4.8) <0.001b Nighttime mean DBP 64.4 (10.8) 59.6 (7.4) 56.6 (4.9) <0.001c
Data was presented as mean (SD). aAll groups differed from each other. bOHT group differed from the ONT and control groups. cControl group
differed from the OHT group. SBP, systolic blood pressure; DBP, diastolic blood pressure; OHT, obese hypertensive group; ONT, obese nor-motensive group.
Insulin levels in the obese hypertensive group
(19.6 ± 7.5 U/mL) did not differ significantly from those in
the obese normotensive group (17.8 ± 7.6 U/mL; p > 0.05).
HOMA-IR values also did not differ significantly between
the obese hypertensive (4.2 ± 1.6) and obese normotensive
groups (3.9 ± 1.8) (p > 0.05).
WBV values in the obese hypertensive (0.0619 ±
0.0077 poise) and obese normotensive (0.0607 ± 0.0071
poise) groups were higher than that of the controls
(0.0616 ± 0.0064 poise), but this difference was not
sta-tistically significant (p > 0.05). There was no significant
difference between the measurements of the right and left
arms of the middle cerebral arteries; thus, the data were
pooled for further analyses (p > 0.05). Middle cerebral
artery blood flow velocities were higher in the obese
hyper-tensive (73.9 ± 15.0 cm/s) and obese normohyper-tensive groups
(75.2 ± 13.5 cm/s) than the controls (66.4 ± 11.5 cm/s), but
with no statistical significance (p > 0.05).
Total cholesterol levels were significantly higher
in obese hypertensive patients than controls (p < 0.05).
Serum triglyceride levels were significantly higher in
obese hypertensive and normotensive patients than
con-trols (p < 0.001).
Correlations
WBV was correlated positively with hemoglobin,
hemato-crit and red blood cell counts in obese patients (r = 0.450,
p < 0.001; r = 0.481, p < 0.001; and r = 0.443, p < 0.001,
respectively) as well as in control subjects (r = 0.492,
p = 0.028; r = 0.602, p = 0.005; and r = 0.653, p = 0.002,
respectively).
A non-significant negative correlation of WBV
(r = − 0.150, p = 0.270) and a significant negative
correla-tion of hemoglobin (r = − 0.334, p = 0.010) and hematocrit
(r = − 0.419, p = 0.001) with middle cerebral artery blood
flow velocities were seen in obese patients. Middle
cer-ebral artery blood flow velocities correlated negatively
with 24-h mean ambulatory systolic and diastolic blood
pressure values in the obese hypertensive group (systolic
blood pressure: r = − 0.378, p = 0.028; diastolic blood
pres-sure: r = − 0.353, p = 0.040) but not in the obese
normoten-sive group. BMI correlated positively with middle cerebral
artery blood flow velocities in obese patients (r = 0.203,
p = 0.123). Insulin levels and HOMA-IR values were
cor-related positively with WBV in obese patients (r = 0.298,
p = 0.022; r = 0.284, p = 0.029, respectively). No
correla-tions were found between WBV values and blood pressure
indices, body weights or BMI in both obese hypertensive
and normotensive patients.
Discussion
Obesity is associated with abnormalities in microvascular
patterns such as reduced small vessel density,
inflamma-tion, and impaired endothelial function as well as
vascu-lar reactivity in peripheral and central vascuvascu-lar beds [21].
Few studies have evaluated the relationship between BMI
and blood flow regulation or established relationship
between obesity and reduced large and small vessel
arte-rial compliance, artearte-rial stiffness, and reduced
distensi-bility, including the carotid arteries [21–23]. The present
study is designed to reveal this relationship for the first
time in obese adolescents.
In the current study, middle cerebral artery blood flow
velocities were found higher in the obese hypertensive and
obese normotensive groups than in the controls, although
the difference was not statistically significant. In the
lit-erature, a cross-sectional study conducted in
1323 stroke-free adults using TCD to evaluate CBF velocities revealed
that cardiovascular risk factors, such as hypertension,
hyperlipidemia, diabetes and obesity were the cause of
diminished blood flow velocities in extracranial
arter-ies, although this association was not remarkable in the
intracranial arteries [15].
In another study, a TCD study which was performed
to assess the hemodynamic status of cerebral arteries in
adult patients with hypercholesterolemia revealed that
low-density lipoproteins >160 mg/dL did not seem to have
a detrimental effect on the hemodynamic status of the
intracranial arteries. However, those with higher levels of
low-density lipoproteins (>180 mg/dL) and lower levels
of high-density lipoproteins (<35 mg/dL) showed
signifi-cantly lower mean blood flow velocities in the internal
carotid arteries [16]. In the current study, serum
triglycer-ide and total cholesterol levels were significantly higher
than controls (p < 0.05) but no significant relationship was
found between TCD velocities and blood lipid profiles.
Hemoglobin, hematocrit levels and serum proteins
are considered as important parameters that have the
ability to influence whole blood viscosity. Increases
in these variables may result in increases in WBV and
also decrease in CBF [6, 17–19]. In the current study, as
reported before [5, 6, 24–26] there was a negative
corre-lation between middle cerebral artery blood flow
veloci-ties and hemoglobin/hematocrit levels. Studies on blood
flow conducted in rigid tubes revealed the presence of an
inverse relationship between flow velocities and
viscos-ity. If cerebral vessels act as rigid tubes and CBF pressure
is kept constant, CBF increases as viscosity decreases
[5]. No statistically significant difference in the middle
cerebral artery blood flow velocities existed between the
patient and control groups, and no correlation was found
between the WBV and middle cerebral artery blood flow
velocity in any of our groups. It has been reported that a
three-fold variation in plasma viscosity with a two-fold
variation in WBV do not significantly alter CBF under
normal conditions [5]. Our results are consistent with the
studies conducted on animals and humans that found
plasma viscosity alone has little or no effect on CBF [5,
25–27], because the cerebral circulation has the ability
to respond to changes in viscosity to maintain a constant
flow [5, 28].
Insulin levels and HOMA-IR values in the current
study correlated positively with WBV and WBV was higher
in patients with insulin resistance. Although no
signifi-cant relation was found between middle cerebral artery
blood flow velocities and WBV of obese patients
regard-less of the blood pressure status, the positive significant
relation of insulin resistance and WBV should point to the
increased risk of vascular endothelial damage in obese
patients.
The current study revealed that CBF increased as BMI
increased in obese patients although a previous study
conducted in a pediatric population found no correlation
between BMI and CBF velocities [29]. Decreases in CBF
velocities with increasing body mass have been reported
in an adult population [21]. The mechanism of blood flow
velocity changes is not clearly understood. However, local
strong increases or decreases in flow velocity are
corre-lated with high-grade stenosis. A milder and more
gener-alized flow velocity increase may be due to intracerebral
atherosclerosis or arterial narrowing in response to
hyper-tension. In a population-based study in stroke-free
sub-jects in adults, a significant and independent association
with the risk of ischemic stroke and middle cerebral artery
flow velocities, measured using transcranial Doppler
ultrasound, was found [30]. Mild diffuse middle cerebral
artery atherosclerosis or middle cerebral artery
vasocon-striction in response to systemic hypertension is regarded
as the most likely pathophysiological mechanism
under-lying this association [30]. The literature lacks pediatric
studies and ours is very important in this regard. The
find-ings of statistical analysis that have no significance is also
an important issue that may highlight future studies.
In our study, a negative correlation between middle
cerebral artery blood flow velocities and 24-h mean
ambulatory systolic/diastolic blood pressure was found
in the obese hypertensive group. On the other hand,
there was no significant correlation between blood
pres-sure indices and CBF velocity in another study conducted
in children with mild sleep-disordered breathing [29]. In
another study conducted in children, vascular reactivity
of cerebral vessels to hypercapnia was measured by CBF
velocities and diminished velocities were reported in
hypertensive children suggesting the impairment of
vas-cular reactivity by hypertension [31]. Under normal
con-ditions, systemic blood pressure changes have no effect
on CBF. Indeed, CBF is autoregulated effectively, such
that the brain maintains a constant blood flow despite
changes in perfusion pressure in both hypertensive and
normotensive individuals. The cerebral arterioles
con-strict when arterial blood pressure rises and dilate when
blood pressure falls or intracranial pressure rises to
maintain uniform CBF. The lower limit of CBF
autoreg-ulation is the blood pressure below which
autoregula-tory vasodilatation becomes inadequate, leading to
decreases in CBF [32, 33]. If this balance is not achieved,
autoregulation failure may cause hypoperfusion or
cer-ebral edema.
The limitations of our study are the one-centered,
cross-sectional design of the study and the intra-observer
reproducibility of middle cerebral artery flow
measure-ments. The power was low in the study.
In conclusion, upon review of the literature we found
no previous study evaluating the effects of obesity on CBF
velocities in pediatric patients with or without
hyperten-sion. Although middle cerebral artery blood flow velocities
were higher in the obese hypertensive and obese
normo-tensive groups than the controls, the differences were not
significant. Hemoglobin and hematocrit levels correlated
inversely with middle cerebral artery blood flow velocity
which is responsible for ≥80% of the CBF. Physiological
changes in WBV did not seem to have any direct effect on
CBF velocities, because the cerebral circulation is capable
of adaptively modulating itself to changes in viscosity
to maintain a uniform CBF. Further studies with larger
samples are required to demonstrate the value of this
relationship.
Author contributions: All the authors have accepted
responsibility for the entire content of this submitted
manuscript and approved submission.
Research funding: This study was partially financed by
the Scientific Research Project Foundation of Gazi
Univer-sity School of Medicine (Grant number: 01/2011-97).
Employment or leadership: None declared.
Honorarium: None declared.
Competing interests: The funding organization(s) played
no role in the study design; in the collection, analysis, and
interpretation of data; in the writing of the report; or in the
decision to submit the report for publication.
References
1. Kotchen TA. Obesity-related hypertension: epidemiology, path physiology, and clinical management. Am J Hypertens 2010;23:1170–8.
2. Raj M, Krishnakumar R. Hypertension in children and ado-lescents: epidemiology and pathogenesis. Indian J Pediatr 2013;80:S71–6.
3. Assunção SN, Boa Sorte NC, Alves CA, Mendes PS, Alves CR, et al. Glucose alteration and insulin resistance in asymptomatic obese children and adolescents. J Pediatr (Rio J). 2017 Aug 26. pii: S0021-7557(16)30322-9.
4. Dibeklioglu SE, Çevik BŞ, Acar B, Özçakar ZB, Uncu N, et al. The association between obesity, hypertension and left-ventricular mass inadolescents. J Pediatr Endocrinol Metab 2017;30:167–74.
5. Tomiyama Y, Brian JE Jr, Todd MM. Plasma viscosity and cerebral blood flow. Am J Physiol Heart Circ Physiol 2000; 279:H1949–54. 6. Sohn YH, Kim GW, Kim JS. Do hematocrit and serum fibrinogen
influence transcranial Doppler measurements? J Korean Med Sci 1997;12:405–8.
7. Aaslid R, Markwalder TM, Nornes H. Noninvasive transcranial Doppler ultrasound recording of flow velocity in basal cerebral arteries. J Neurosurg 1982;57:769–74.
8. Fodale V, Schifilliti D, Conti A, Lucanto T, Pino G, et al. Tran-scranial Doppler and anesthetics. Acta Anaesthesiol Scand 2007;51:839–47.
9. Bundak R, Furman A, Gunoz H, Darendeliler F, Bas F, et al. Body mass index references for Turkish children. Acta Paediatr 2006;95:194–8.
10. Kurtoğlu S, Hatipoğlu N, Mazıcıoğlu M, Kendirici M, Keskin M, et al. Insulin resistance in obese children and adolescents: HOMA-IR cut-off levels in the prepubertal and pubertal periods. J Clin Res Pediatr Endocrinol 2010;2:100–6.
11. Lurbe E, Torro I, Aguilar F, Alvarez J, Alcon J, et al. Added impact of obesity and insulin resistance in nocturnal blood pressure elevation in children and adolescents. Hypertension 2008;51:635–41.
12. National High Blood Pressure Education Program Working Group on High Blood Pressure in Children and Adolescents. The fourth report on the diagnosis, evaluation, and treatment of high blood pressure in children and adolescents. Pediatrics 2004;114:555–76.
13. Urbina E, Alpert B, Flynn J, Hayman L, Harshfield GA, et al. Ambulatory blood pressure monitoring in children and adoles-cents: recommendations for standard assessment: a scientific statement from the American Heart Association Atherosclerosis, Hypertension, and Obesity in Youth Committee of the council on cardiovascular disease in the young and the council for high blood pressure research. Hypertension 2008;52:433–51. 14. Soergel M, Kirschstein M, Busch C, Danne T, Gellermann J, et al.
Oscillometric twenty-four-hour ambulatory blood pressure values in healthy children and adolescents: a multicenter trial including 1141 subjects. J Pediatr 1997;130:178–84.
15. Zhang P, Huang Y, Li Y, Shi P, Lu M, et al. Gender and risk factor dependence of cerebral blood flow velocity in Chinese adults. Brain Res Bull 2006;69:282–7.
16. Farhoudi M, Mehrvar K, Aslanabadi N, Ghabili K, Baqhmishe NR, et al. Doppler study of cerebral arteries in hypercholesterolemia. Vasc Health Risk Manag 2011;7:203–7.
17. Thomas DJ, Marshall J, Russell RW, Wetherley-Mein G, du Boulay GH, et al. Effect of haematocrit on cerebral blood-flow in man. Lancet 1977;2:941–3.
18. Grotta L, Ackerman R, Correia J, Fallick G, Chang J. Whole blood viscosity parameters and cerebral blood flow. Stroke 1982;13:296–301.
19. Kee DB, Wood JH. Influence of blood rheology on cerebral circu-lation. In: Wood JH, editor. Cerebral blood flow. Physiologic and clinical aspects. New-York: McGraw-Hill Co, 1988:173–85. 20. Akcaboy M, Kula S, Göktas T, Nazliel B, Terlemez S, et al. Effect
of plasma NOx values on cardiac function in obese hyper-tensive and normohyper-tensive pediatric patients. Pediatr Nephrol 2016;31:473–83.
21. Selim M, Jones R, Novak P, Zhao P, Novak V. The effects of body mass index on cerebral blood flow velocity. Clin Auton Res 2008;18:331–8.
22. Acree L, Montgomery PS, Gardner AW. The influence of obesity on arterial compliance in adult men and women. Vasc Med 2007;12:183–8.
23. Zebekakis PE, Nawrot T, Thijs L, Balkestein EJ, van der Heijden-Spek J, et al. Obesity is associated with increased arterial stiffness from adolescence until old age. J Hypertens 2005;23:1839–46.
24. Kusunoki M, Kimura K, Nakamura M, Isaka Y, Yoneda S, et al. Effects of hematocrit variations on cerebral blood flow and oxygen transport in ischemic cerebrovascular disease. J Cereb Blood Flow Metab 1981;1:413–7.
25. Brown MM, Marshall J. Regulation of cerebral blood flow in response to changes in blood viscosity. Lancet 1985;1:604–9. 26. Borzage MT, Bush AM, Choi S, Nederveen AJ, Václavů L, et al.
Predictors of cerebral blood flow in patients with and without anemia. J Appl Physiol (1985) 2016;120:976–81.
27. Chen RY, Carlin RD, Simchon S, Jan KM, Chien S. Effects of dextran – induced hyperviscosity on regional cer-ebral blood flow and hemodynamics in dogs. Am J Physiol 1989;256:H898–905.
28. Sharma M, Kupferman JC, Brosgol Y, Paterno K, Goodman S, et al. The effects of hypertension on the paediatric brain: ajusti-fiable concern. Lancet Neurol 2010;9:933–40.
29. Hill CM, Hogan AM, Onugha N, Harrison D, Cooper S, et al. Increased cerebral blood flow velocity in children with mild sleep-disordered breathing: a possible association with abnormal neuropsychological function. Pediatrics 2006;118:e1100–8.
30. Bos MJ, Koudstaal PJ, Hofman A, Witteman JC, Breteler MM. Tran-scranial Doppler hemodynamic parameters and risk of stroke: the Rotterdam study. Stroke 2007;38:2453–8.
31. Wong LJ, Kupferman JC, Prohovnik I, Kirkham FJ, Goodman S, et al. Hypertensionimpairsvascularreactivity in thepediatric-brain. Stroke 2011;42:1834–8.
32. Lassen NA. Cerebral blood flow and oxygen consumption in man. Physiol Rev 1959;39:183–238.
33. Finnerty FA Jr, Witkin L, Fazekas JF. Cerebral hemodynamics during cerebral ischemia induced by acute hypotension. J Clin Invest 1954;33:1227–32.