Işık M., Yarar O., Söylemez Sur D. (2021). Measurement of the effects of business intelligence applications on performance in hospitals according to the managerial levels: a chain hospital application. Journal of International Health Sciences and Management, 7(13):97-108
97
Measurement of the effects of business intelligence applications on performance in
hospitals according to the managerial levels: a chain hospital application
Mustafa IŞIK1, Onur YARAR2, Didem SÖYLEMEZ SUR3
AB S TR A C T
Hospitals are matrix and complex organizations with many areas of expertise. In hospitals, multi-modular and integrated systems that can have multiple software and databases provide support in the execution of business processes within this complex organizational structure. Getting the right data at the right time for decision support purposes is often an important problem. In overcoming these problems, the problem of the research is what the contribution of integrated business intelligence applications solutions can be in decision-making stages from all levels of management.
This research was conducted to investigate the effect of business intelligence reporting practices on performance according to managerial levels in hospital management systems. The research is a study conducted to measure the effect of business intelligence practices on performance in a chain hospital group that uses business intelligence in connection with the ERP (Enterprise Resource Planning) system with the highest number of hospitals in Turkey.
The universe of the research is composed of people who have the authority and access to use BI at MLP care group for this study. The number of authorized people on the ERP system was 591 and 65.0% of them have filled out the requested survey. 231 was our minimum number and for increasing the reliability we have modified our number of samples to 383. So 383 samples were reached to strengthen the validity and the reliability of the survey. In this sample range, it was also aimed to compare the performance impact between senior, intermediate and operational level managers. The questionnaire study was conducted on 383 people. In this context, BI (Business Intelligence) architecture has been examined with all its components and information has been given about the benefits it provides to the enterprises. In the application developed as an example, a data warehouse modeling in accordance with the information required by the top management in hospitals, preparation of analyses, creation of presentation layer and presentation of the prepared analyses and reports on the control table were carried out.
As a result of the research, it was determined that corporate business intelligence application screens at all types of managerial levels have a positive and significant effect on measurable performance indicators. In this context, when businesses monitor and control their operational activities through corporate business intelligence, it has been concluded that performance indicators provide less time loss, high reliability, integrated data, quality and accurate valuation advantages in the evaluation process. In the research, it was observed that the effect of performance results of operational managers' business intelligence applications from management levels was higher than that of senior and middle level managers.
Corresponding Author
Mustafa IŞIK
DOİ
https://10.48121/jihsam.776109Received
12.08.2020Accepted
23.01.2021Published Online
30.04.2021Key Words
Business Intelligence Big Data Corporate Performance Management Hospital Information Management Systems Data Analysis*This paper has been presented as an oral paper at the 5th International Health Sciences and Management Conference
1
Asst. Prof. İstinye University Faculty of Economics, Administrative and Social Sciences, Department of Health Management/
[email protected], Orcid: 0000-0002-3671-4799
2 Asst. Prof. Okan University, Healthcare Management, Turkey / [email protected], Orcid: 0000-0001-9543-6891 3 Asst. Prof. Kent University, Healthcare Management, Turkey /[email protected], Orcid: 0000-0001-9543-6891
Işık M., Yarar O., Söylemez Sur D. (2021). Measurement of the effects of business intelligence applications on performance in hospitals according to the managerial levels: a chain hospital application. Journal of International Health Sciences and Management, 7(13):97-108
98 IN TR O D U C T IO N
Business intelligence (BI) concept was used first in 1959 with an article published by Hans Peter Luhn (an IBM Researcher) which was used by International Business Machine (IBM) to create some of the first real BI systems. Because of this, Hans Peter Luhn is commonly referred to as the “Father of BI.” From this specified date, the BI concept has continued its existence and development as an integral part of decision support systems. In 1989, Howard Dresner (researcher from Gartner Group) defined BI as an umbrella term which describes concepts and methods that can help businesses use “fact-based support systems” to improve their decision-making the term resonated with decision support professionals, with vendors, and with general managers. It was widely adopted and replaced terms like executive information systems (Willcocks L.P., Sauer C. and Lacity M.C. 2016).
BI is not only a practical method and to understand this concept it should be needed to get sufficient information. For that reason, the components and technology of business intelligence have reached high interest. Especially, the health care workers who are at the management position, approved BI deployment in the healthcare industry, address relevant issues and challenges, and explored the role of BI to foster certain organizational capabilities (Ashrafi, N., Kelleher, L., &Kuilboer, J-P. 2014).
One of the pioneer organization for BI Gartner Group report in 2000; Information Democracies and BI data practices have been described in detail. It was also mentioned in this study that this concept would be followed up by the employees, consultants, customers, suppliers and the public (Blind A.2012). In another study by Garnter Group, Doug Laney described the 3V model’s data management and complexity. These were defined as Volume, Variety, Velocity as a”3V Model”. Big data has been presented in here for the first time (Özdoğan O.,2016).There are two main usages have been defined for BI in the literature; first one is the Business Management and the second term is the communication technologies (Ki P.Y., Sawy E., Omar A. and Peer F., 2017).
In 1994, the BI was also becoming as a concept in the business ethic which is a necessity for the companies working efficiency, effectiveness and profitability (Schultz, N.O.,Collins, A.B. &McCulloch, M., 1994). The costs are increasing also for the business companies in the health care area. This kind of incremental cost affects to patient’s budget side and sometimes it has not been reimbursed and created copayments. In order prevent the unexpected costs to the healthcare systems, two main concept techniques should have
to be included analytic focusing and visualization of health care systems like in the literature (Ivan M. And VelicanuM.,2015).
One of the main data record problem in health care area is that the data are in non-restructured format and it is around 80% of the all medical records in health care system (Vest J.R.,Grannis S.J., Haut D.P., Halverson P.K. and Menachemi N., 2017). For this main issue, the data mining is also has played in an important role in healthcare industry, especially in predicting various types of disease (Jothia N.,Aini N., Rashidb A. And Husai W., 2015). Data Mining aims to create decision-making models for predicting future behaviors by focusing on analysis from previous years and with this approach the statistical learning plays a key role in many sections of science, health, finance and industry. Learning science plays a key role at the branches of statistics, data mining and artificial intelligence, engineering, and other disciplines (Iatan I.F., 2016).So, the business intelligence and data mining concepts are main guide to productivity for corporate business (Kudyba S. andHoptroff R, 2001).
BI is a combination of methods, processes and technologies that includes raw data during operational processes. With data mining it converts the logic information for making decisions about objected businesses. BI contributes to new possibilities in the direction of the target. With this respect, the concept of business intelligence can be defined as a correct way to reach the right decision with the proper information at the best time. The hospital institutions have a complex structure which includes many branches. The operational works in this complex organizational structure are followed up through automation software that is called Hospital Information Management System (HIMS). This multi-module system contains more than one software program and database. Moreover, it is a significant issue for deciding to reach proper information in the fastest time with this system. BI is the key solution in dealing with such a kind of problems (Kao Y. H.,Yu C. M., Masud M., Wu W.H.,Chen L.J., Chun Y. and Wu J., 2016). Different sections have their own data, facts, measurement formulas and definitions. It might look like that there is not any issue however, BI will try to create new standards in each cooperation, and it has an effect that make the hagiomania of the departments disappear. On the other hand, even if many users could realize the advantages of BI; they continue to work in the old style by keeping their importance at some point (Richards G., Yeoh W., Chong A.Y.L and Popovic A., 2017).The significant item in a study is the quality of the data so high-quality data should include accurate, responsive, applicable, error-free, relevant, proper
Işık M., Yarar O., Söylemez Sur D. (2021). Measurement of the effects of business intelligence applications on performance in hospitals according to the managerial levels: a chain hospital application. Journal of International Health Sciences and Management, 7(13):97-108
99 and convenient sources. With high quality data and
analysis technique, it could be done most appropriate analysis and forecasts in many business sectors (Dwivedi A.,Niranjan M., and Sahu K., 2013).As a result of face-to-face interviews between senior and executive level managers, it has been determined that BI has recently recognized a method of business concept in our country. It could be obtained that the projects realized on this concept can be efficiently transformed into a business-specific from also contributes positively to the business actions of all managers and employees at the operational level (Dinçerden E.,2017). BI concept combines databases, analytical methods, applications and methodologies. The main purpose of business intelligence is to provide easy access to data and analytic models for presenting business executives with analysis. Data mining should be also effectively used with BI in order present BI analysis in a proper way (Olszak C. M., 2016). Knowledge discovery in databases is the nontrivial process of identifying valid, novel, potentially useful, and ultimately understandable patterns or relationship with a dataset which are based for Data mining and Data warehouse concepts. The Data warehouse (DW) concept has first appeared in 1991. DW has structures in which data to be used in the implementation of data mining algorithms. DW stores the data which is used in data mining. DW are created for reading only. DW is mainly makes the analysis easier (Gök, M.,Akçetin, E. and Çelik, U., 2017).
1.1 Corporate Performance Management and Decision Making
Performance could be defined as the execution, achievement or accomplishment of an action and duty. On the other hand, performance is a way of presentation concept in order to help for qualitative or quantitative. Performance measures the efficiency in the simplest way. The purpose of the performance system is to set the targets within the framework of the vision and institution (Parida, A., Kumar, U. Galar, D. And Stenström, C., 2015).
1.2 The importance of Decision Making and Business Intelligence
BI is a kind of concept which supports to make higher quality decisions and reach accurate outcomes. Customer Relationship Management (CRM), Corporate Performance Management (CPM) and Executive Information Systems (EISS) are the best-known business intelligence applications (Kowalczyk M., 2017). Data warehouses and operation data storages are very significant factors for BI software. Organizations can utilize data warehouse technologies to combine data hidden in various applications under common platform and keep the system open for users.
Decision makers can access, share and manage qualified and useful data source by using BI applications (Muehlen, M.,and Shapiro, R., 2014). Decision trees in data mining are the most widely used method among classification models, with low cost installation, easy to interpret, high reliability, and easy integration data base systems (Amayri, M.,Arora, A., Ploix, S., et all, 2016).
Computer-based systems that distribute web-based DSS (decision support systems) or decision support tools to managers, business analysts, or customers using Netscape Navigatoror Microsoft Internet Explorer-like web browsers. Web-based DSS reduce the technological barriers in organizations that are spread over a wide geography and making decisions taken on time. The web platform becomes as a client-server which helps for many organizations due to the cost of installation and maintenance. For this reason, today most organizations build multi-task architecture decision support applications that include a browser, web server and databases to overcome geographic and technological barriers related to time. Decisionsupport software manufacturers integrate web Technologies into their products (Babiceanu, R.F. and Seker, R., 2016).
1.3. Difference Between Decision Support Systems and Business Intelligence
The conceptual start of DSS took place before 1970, when the people in the management position could be transformed into the numerical models like daily problems which they have to face. The historical development of DSS is summarized as follows: In the late 1960s- model based DSS or management decision system emerged a new type of information system. In the mid-1980s, group decision support systems (GDDS) and high level information system (EIS) which supports senior manager in strategic position. In early 1990, four new tools for DSS installation appeared, which could be listed as data warehouse, Online Analytical Processing Server (OLAP), data mining and web related Technologies (Shim, J.P.,Warkentin, M., Courtney, J. F. et all. 2002). BI is also well accepted as the top-level point reached in the development process for decision support systems. For this reason, BI scope is wider than DSSs (Yeaoh, W.,Popovic, A., 2015).
DSSs have been used in many areas due to the support it has recently provided for decision making. Examples of some of these areas are
marketing, banking, insurance,
telecommunications, biology, medicine, genetics, internet mining and document mining (Kaklauskas, A., 2015). DSSs are fed periodically from data sources. On the other hand, some additional solutions need to be developed for these systems to
Işık M., Yarar O., Söylemez Sur D. (2021). Measurement of the effects of business intelligence applications on performance in hospitals according to the managerial levels: a chain hospital application. Journal of International Health Sciences and Management, 7(13):97-108
100 serve in real time. Acting fast and making quick
decisions are becoming more and more important day by day. Therefore, it is becoming increasingly significant for corporate organization to review the results of analysis in a real time as soon as possible (Intezari, A., and Gressel, S., 2017). BI usually targets planned and sustained outputs. For instance, a dashboard with daily reports from an organization is viewed as a BI output. BI analytics includes all the outputs and in addition, the decision process that can only be used once in a projective it works (Duan, L., Xiong, Y., 2015).
The Solution of Business Intelligence in Healthcare Industry
Healthcare organizations can use BI technologies to leverage data and improve operational and clinical efficiency mainly for hospital system utilizations, medical records follow
up procedure, health care provider performance, health quality and services, and patient comfort (Brooks, P., Gayar, O. E, and Sarnikar, S., 2015). Since the health care sector is developing and changing very rapidly, it also includes many branches and organizations. The health sector, which is obliged to adapt with unexpected changes and provide proper solution and service to the system.
The hospitals have complex organizations and utilize the information technologies in the most intensive manner during operations. The information systems that provide management, medical and financial information integrity in the platform generally with HIMS (Kao Y. H.,Yu C. M., Masud M., Wu W.H.,Chen L.J., Chun Y. andWu J., 2016).
M A TE R IA L AN D ME THO DS 2.1. Aim of the Study
This research aims to measure the impact of the performance of BI applications with using ERP system on the chain hospital group MLP Care. With this study, it has been presented the effects of BI applications for decision making with providing timeframe and multi-dimensional data view on the health care sector.
2.2. Type of Study
This research is type of a descriptive research based on a survey study which conducts to measure the effect of BI application on the performance in MLP Care chain hospital group. The main data source was provided as a survey format which has been collect by the mangers in this chain hospital group at a certain time frame. Ethical Committee Submission has been done to Okan University in November 1st, 2018, and the approval has been received, also the legal approval has been collected by MLP Care. All necessary information was obtained from this hospital group by ERP and BI database.
2.3. Universe and Sample Selection
The universe of the research is composed of people who have the authority and access to use BI at MLP care group for this study. The number of authorized people on the ERP system was 591 and 65.0% of them have filled out the requested survey. The number remained due to permission and not being able to provide connection. 45 employees did not accept the survey. 231 was our minimum number and for increasing the reliability we have modified our number of samples to 383. So 383 samples were reached to strengthen the validity and the reliability of the survey. In this sample range, it
was also aimed to compare the performance impact between senior, intermediate and operational level managers.
Table 1: Manager Levels Survey Numbers Manager Level Universe Survey
Applied Current Survey % Senior Manager 165 135 135 82.0 Mid-level Manager 205 161 151 74.0 Operational Level Manager 221 114 97 44.0 Total 591 410 383 65.0
2.4 Data Collection Tool and Statistical Method
The study is designed from ground up as a survey scale which measures the impact of BI application on performance in the health sector. For measuring the effect of BI application on performance, 62 questions were prepared in 7 sub-dimensions by making explanatory factor. The questions in the scale were evaluated according to the 5-point Likert scale technique. 1- Strongly disagree, 2 -Disagree, 3- Neither agree/disagree, 4- Agree, 5 – Strongly agree. Reliability analysis was applied to the results obtained with 30 participants pilot study. After the reliability results were significant, the survey has continued, and explanatory factor analysis has applied.
2.5 Limitations of the Study
Total number of hospitals in Turkey is around 1500 and MLP care group has 32 hospitals. 4 hospitals are in foundation university hospital and 28 of them are in private hospital status. Conducting the research in only one chain hospital
Işık M., Yarar O., Söylemez Sur D. (2021). Measurement of the effects of business intelligence applications on performance in hospitals according to the managerial levels: a chain hospital application. Journal of International Health Sciences and Management, 7(13):97-108
101 group in health sector constitutes the limitation of
the research.
2.6 Data Analysis
SPSS Version 22(Statistical Package for Social Sciences, SPSS in, Chicago, IL USA) has been used as a statistical software for analyzing the data in the study. In all analyzes, statistical significance was evaluated at p<0,05 level.
The Compliance of all data to normal distribution in statistical analysis decision has been verified with “One-Sample Kolmogorov Smirnov Test”. Histogram is drawn up by looking at the skewness (=<3) and Kurtosis Coefficients for multiple variables, and parametric tests are used in cases that are convenient for normal distribution, and non-parametric tests are used.
Moreover, the frequency tables and central-prevalence criteria have been used for all given data in the study. For the statistical analyzes of the research, t-test and one-way ANOVA tests were applied in parametric independent groups.
2.7 Validity and Reliability Analysis of the Survey
The test results of the effect of BI application on performance scale has been evaluated with Kaiser-Meyer-Olkin sample adequacy test came out in this study; 0,9957 and it was accepted as an excellent over 0,90. It has been also concluded that Bartlett’s Test outcome was convenient with factor analysis (p<0,05). The primary data sources of the study were by Oracle data record and secondary data sources from the result of the survey. The research data have been analyzed in the context of reason-effect relationship and the results were interpreted.
The sub-dimensions of the effect of business intelligence applications on performance scale:
Factor 1: Questions regarding on the effect of BI usage on the overall performance perception.
Factor 2: Questions regarding on the effect of BI for its users
Factor 3: Questions about the effect of BI on reporting techniques
Factor 4: Questions regarding on the effect of using BI for clinical processes
Factor 5: Questions regarding on the effect of using BI for income analysis
Factor 6: Questions regarding on the effect of using BI for financial analysis
Factor 7: Questions about the effect of using BI in terms of satisfactory analysis
When Cronbach’s alpha reliability coefficients are reviewed for sub-dimensions of the scale titled “Effect of Business Intelligence Applications on Performance”, the score was 0.962 for effect of using business intelligence on the general performance perception, 0.920 for effect of business intelligence on user, 0.882 for effect of business intelligence on reporting techniques, 0.971 for effect of business intelligence on clinical processes, 0.987 for effect of business intelligence on income analysis and 0.988 for effect of business intelligence on satisfaction. In this study, rotated factor matrix is created to determine the scaled factors and their sub-items. The factor loads of subscales obtained through the rotated factor matrix applied on surveys of 383 participants are given in following tables. Total variance of total 7 factors (sub-dimension) is 79.3 percent.
Işık M., Yarar O., Söylemez Sur D. (2021). Measurement of the effects of business intelligence applications on performance in hospitals according to the managerial levels: a chain hospital application. Journal of International Health Sciences and Management, 7(13):97-108
102 R ES UL TS
3.1 Demographic Outcomes
The socio-demographic outcomes from the participants are in Table 2 below:
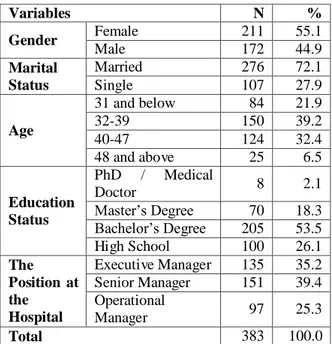
Table 2: Sociodemographics of participants
Variables N % Gender Female 211 55.1 Male 172 44.9 Marital Status Married 276 72.1 Single 107 27.9 Age 31 and below 84 21.9 32-39 150 39.2 40-47 124 32.4 48 and above 25 6.5 Education Status PhD / Medical Doctor 8 2.1 Master’s Degree 70 18.3 Bachelor’s Degree 205 53.5 High School 100 26.1 The Position at the Hospital Executive Manager 135 35.2 Senior Manager 151 39.4 Operational Manager 97 25.3 Total 383 100.0
Female participants are were 55.1% and higher than male. 72% of participants were married. Most of the participants age interval was between 32-39. Education status of the participants were mostly bachelor’s degree. Senior Managers were in majority than the others position at the hospital.
3.2 Experience of the participants and BI feedbacks
The level of experience and Business Intelligence (BI) feedbacks has been evaluated in Table 3 below.
Table 3. Sociodemographics of participants
Variable N %
Total Experience in this sector
Less than 1 year 14 3.7
1-3 years 30 7.8
4-5 years 40 10.4
6-10 years 109 28.5
11 years and above 190 49.6
Business Intelligence (BI) or any other similar technique usage situation before joining to this hospital group
Yes 102 26.6
No 281 73.4
The Level of knowledge and experience in
Business Intelligence and related
techniques
Beginner 83 21.7
Intermediate 207 54.0
Advanced 82 21.4
Master 11 2.9
The ability of preparing related reports from BI screen on your own study field
Yes 263 68.7
No 120 31.3
BI usage frequency
Once in a week 94 24.5
Two times or four times in a week 72 18.8
Once in a day 62 16.2
Two to three times in a day 84 21.9 More than 4 times in a day 71 18.5
Total 383 100.0
The participants were mostly in this hospital area for 11 years and above. Most of the participants learn the BI with this hospital with 73,4% ratio. The average level of BI users in this hospital is intermediate. The ability of BI related
reports could be mostly done. BI were used mostly once in a week according to participants feedback.
Işık M., Yarar O., Söylemez Sur D. (2021). Measurement of the effects of business intelligence applications on performance in hospitals according to the managerial levels: a chain hospital application. Journal of International Health Sciences and Management, 7(13):97-108
103 3.3. BI and Software TechniquesUsage by the company internal feedbacks
The usage of BI and the related techniques have been evaluated with company employee feedbacks in Table 4 below.
Table 4. Categorizing use of business intelligence software and techniques in the company (more than one
item is answered)
N %
It is a significant factor and affects the success of the entire organization. 271 42.2 It supports the business strategy and affects the realization in long term. 233 36.2 It provides minor improvements and affects daily routine business feedback. 42 6.5 It helps to maintain current situation and has no significant feedback on our operations. 21 3.3 It reduces efficiency and has negative effect on the timeframe of the process. 9 1.4 It does not only provide the support on administrative decision side for the physicians, but also
in diagnosis and treatment process. 67 10.4
Total 643 100.0
Considering the distribution of the category of the BI usage and related techniques within the company, 42.2% of the participants have selected as an important success factor; 36.2% of them has also selected BI which affects the entire organization. For 10.4% of the participants; BI does not only provide the support on administrative decision side for the physicians but also in diagnosis and treatment process. 3.3% of the participants selected that BI helps to maintain current situation and no significant feedback on their operations.
3.4 The sub-dimensionsimpact of BI applications on the performance and central tendency measures
The BI impacts on the performance and central tendency side of feedback shave been presented in Table 5.
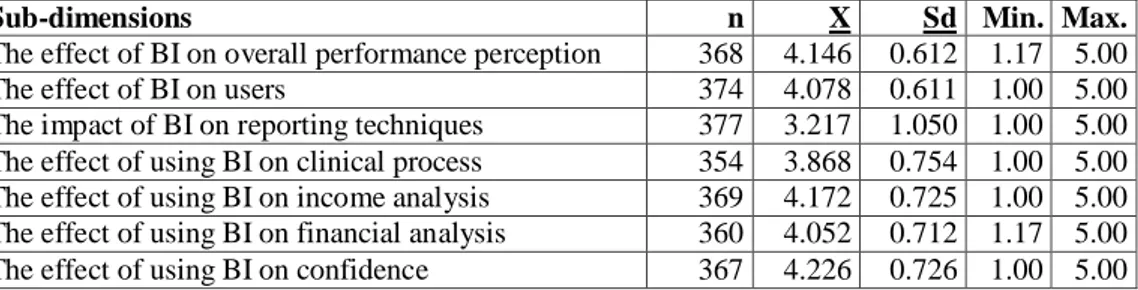
Table 5. Measures of central tendency for sub-dimensions of effects of the business intelligence applications
on performance
Sub-dimensions n X Sd Min. Max.
The effect of BI on overall performance perception 368 4.146 0.612 1.17 5.00
The effect of BI on users 374 4.078 0.611 1.00 5.00
The impact of BI on reporting techniques 377 3.217 1.050 1.00 5.00 The effect of using BI on clinical process 354 3.868 0.754 1.00 5.00 The effect of using BI on income analysis 369 4.172 0.725 1.00 5.00 The effect of using BI on financial analysis 360 4.052 0.712 1.17 5.00 The effect of using BI on confidence 367 4.226 0.726 1.00 5.00
The participants outcome of BI application on sub-dimension measurements have been obtained below: a) The performance perception impact: minimum 1.17, maximum 5 and mean 4.146 (± 0.612).
b) The impact for users: minimum 1, maximum 5 and the mean 4.078 (±0.611).
c) The impact on reporting techniques; minimum 1, maximum 5 and the mean 3.217(±1.050).
d) The clinical process and assessment impacts; minimum 1, maximum 5 and the mean 3.868 (±0.754). e) The impact of income analysis; minimum 1, maximum 5 and the mean 4.172(±0.725).
f) The effect on financial analysis; minimum 1,17, maximum 5 and the mean 4.052(±0.712). g) The effect on confidence; minimum 1, maximum 5 and the mean 4.226(± 0.726).
Işık M., Yarar O., Söylemez Sur D. (2021). Measurement of the effects of business intelligence applications on performance in hospitals according to the managerial levels: a chain hospital application. Journal of International Health Sciences and Management, 7(13):97-108
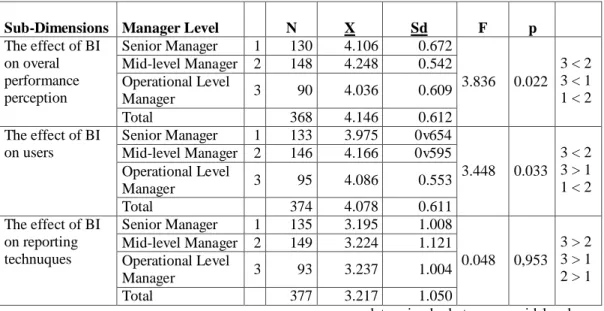
104 Table 6. Comparing sub-dimensions of effects of business intelligence applications on performance by
managerial positions of participants
Sub-Dimensions Manager Level N X Sd F p
The effect of BI on overal performance perception Senior Manager 1 130 4.106 0.672 3.836 0.022 3 < 2 3 < 1 1 < 2 Mid-level Manager 2 148 4.248 0.542 Operational Level Manager 3 90 4.036 0.609 Total 368 4.146 0.612 The effect of BI on users Senior Manager 1 133 3.975 0v654 3.448 0.033 3 < 2 3 > 1 1 < 2 Mid-level Manager 2 146 4.166 0v595 Operational Level Manager 3 95 4.086 0.553 Total 374 4.078 0.611 The effect of BI on reporting technuques Senior Manager 1 135 3.195 1.008 0.048 0,953 3 > 2 3 > 1 2 > 1 Mid-level Manager 2 149 3.224 1.121 Operational Level Manager 3 93 3.237 1.004 Total 377 3.217 1.050
According to the management of the participants in the study, when the effect of business intelligence applications on performance is studied, the effect of using business intelligence on general performance is seen by the management level, according to a significant difference (p <0.05). In advanced analysis, the difference in management in the effect of the use of business intelligence on general performance was
determined between mid-level and operative managers, and the score of mid-level managers was higher than that of operative managers. Another secret is the degree of business intelligence, which was determined to be between mid-level managers and senior managers, and the middle-level manager's score was higher. Information about real experience of business intelligence could not be quoted as real meaningful (p> 0.05).
Table 7. Comparing sub-dimensions of effects of business intelligence applications on performance by
managerial positions of participants
Sub-Dimensions Manager Level n x x X SS Sd p
The effect of BI on clinical process Senior Manager 1 127 3.947 0.768 3.982 0.020 3 > 2 3 > 1 2 < 1 Mid-level Manager 2 136 3v727 0.748
Operational Level Manager 3 91 3.970 0v719 Total
354 3.868 0.754 The effect of using BI
on income analysis Senior Manager 1 129 4.085 0.789 2.621 0.074 3 > 1 3 < 2 2 > 1 Mid-level Manager 2 146 4.276 0.649
Operational Level Manager 3 94 4.128 0.733
Total 369
4.172 0.725 The effect of using BI
on financial analysis Senior Manager 1 128 4.001 0.768 1.546 0.214 3 < 1 3 < 2 2 > 1 Mid-level Manager 2 142 4.133 0.651
Operational Level Manager 3 90 3.995 0.716 Total
360 4.052 0.712 The effect of using BI
on confidence Senior Manager 1 129 4.238 0.780 0.108 0.897 3 < 1 3 < 2 2 > 1 Mid-level Manager 2 146 4.235 0.68
Operational Level Manager 3 92 4.196 0.726 Total
367
4.226 0.726 When the sub-dimensions of the effect of
business intelligence applications on performance
were compared according to the management level of the participants in the study, a statistically significant difference was found between the effect
Işık M., Yarar O., Söylemez Sur D. (2021). Measurement of the effects of business intelligence applications on performance in hospitals according to the managerial levels: a chain hospital application. Journal of International Health Sciences and Management, 7(13):97-108
105 of business intelligence use on clinical processes
and management levels (p <0.05). In the advanced analysis, it was observed that the difference was between the mid-level manager and the senior manager and the operative manager, and the effect score of the use of business intelligence on the clinical processes of the mid-level manager was
lower than the other managers. No statistically significant difference was found between the effect of business intelligence on income analysis, the effect of business intelligence on financial and financial analysis, and the effect of business intelligence on satisfaction and management levels (p> 0.05).
D IS C U SS IO NS
Using information system Technologies and digitalization is very significant in terms of strategic decision-making ability for all management levels including executive managers. The ability to make strategic decisions has been simplified and the data could affect the results are provided to managers; it is possible by presenting it up to date and integrated. With this study, the effects of Business Intelligence (BI) applications that contribute to the decision making and the action process of senior management, operational units, executive managers. It also increases performance by considering the information obtained by literature. Along with the results of the income and expense analysis included in the study; the performance effectiveness levels of BI applications in terms of financial results, clinical process and analysis outcomes of operational process are discusses.
In the study titled “The Effect of Using Information Technologies on Organizational Performance: A Research in the Service Sector”, was found that there was a moderate strong relationship between information technologies and organizational performance in this analysis, which was carried out individually through information technologies. This inference does not suggest that there is no relationship, but it reveals that there is no strong relationship (Şeker, Ş.A. 2013).
The study by Wang et al (2016) that the contribution of Big Data Analysis as benefit to the business values in 5 main titles in their studies “Exploring the Path to Big Data Analytics Success in Healthcare”. IT infrastructure benefits include operational, organizational, administrative, and strategic benefit. To achieve these benefits, it is based on the necessity of collecting big data as the first stage, processing the data, as the second stage displaying data for the third stage. The ranking of the 5 main benefits according to these 238 criteria in the evaluation on 64 companies in the health industry; operational capabilities with 128 talents, IT infrastructure benefits with 55 talents, managerial benefits with 37 talents, organizational talents with 11 talents, and strategic benefits with 7 talents were observed (Wang, Y, Hajli, N. 2016).It is seen that the benefits of business intelligence, which are formed in terms of general grouping, the
fields of income and expense analysis, financial analyses, clinical process analysis, customer confidence analysis and the operational analysis processes are the main topics and support our work as categorization.
In the thesis titled “Business Intelligence Requirement Analysis Small and Medium Enterprises to Master thesis”, Işık (2016) presented that the BI usage increase in the companies for improving their decision-making processes as was as their performance. ERP and CRM together usage awareness also increased. If the company is doing RD it also helps the outcome in terms of creativity (Işık, F. 2016). The fact that the chain hospital group with our study group was conducted is a company using ERP and CRM, and the high-performance effect towards customer satisfaction with BI applications supports this study.
In the survey study by Najah et al (2017) has the title “The Effect of Information systems on Performance on Valuation: Industrial Enterprises Survey”, was conducted on 40 medium and large-scale textile companies which were operating in Denizli, was investigated ERP issues. The outcome was that the ERP usage in the sector is 51%. Institutions’ ERP usage is generally in the areas of inventory management, finance-accounting, and production tracking. Organizations state that there is not a significant decrease in transaction costs in the enterprise with the use of ERP, but they consider the improvement of working process and easy access to quality information as the biggest chain (Najah, R., Rahman, N.R. 2017).
The use of information systems technologies and digitalization in enterprises at all levels of management, including the highest levels of management, is very important in terms of their ability to make strategic decisions. The ability to make strategic decisions can be achieved by presenting simplified and results to managers in summary, up-to-date and integrated form. In this context, the effects of business intelligence practices that contribute to the decision-making and action process of senior management and operational units and increase performance have been evaluated by taking into account the information obtained from the literature. Along with the results related to income and expense
Işık M., Yarar O., Söylemez Sur D. (2021). Measurement of the effects of business intelligence applications on performance in hospitals according to the managerial levels: a chain hospital application. Journal of International Health Sciences and Management, 7(13):97-108
106 analyses within the scope of the study; the levels of
effectiveness of business intelligence applications in terms of financial and financial results, clinical processes and analysis outputs of operational processes were discussed.
Özçam et al. (2016) stated in their study titled "A Research on the Examination of the Usage Levels of Business Intelligence of Businesses Operating in Turkey" that a large part of the institutions implementing business intelligence received help from personnel at all levels who need business intelligence. However, there are only businesses where managers or some employees identified with managers benefit from business intelligence products. In this study, business intelligence users in enterprises were found to be only senior managers 1.49%, middle managers 11.19%, some determined employees 12.69%, and all employees in need 74.63% (Özçam, Y, Çoşkun, E. 2016).
When the sub-dimensions of the effect of business intelligence applications on performance were compared according to the level of management of the participants in our study, a statistically significant difference was found between the effect of business intelligence use on clinical processes and management levels (p<0.05). In the further analysis, it was observed that the difference was between the mid-level manager and the senior manager and the operational manager, and that the effect of the mid-level managers use of business intelligence on clinical processes was lower than the other managers.
When the sub-dimensions of the effect of business intelligence applications on performance status were compared according to the level of management of the participants in our study, a statistically significant difference was found between the effect of business intelligence use on general performance perception, effect on the user and management levels (p<0.05). In the further analysis, it was determined that the difference in the level of management in the effect of using business intelligence on overall performance perception was between the mid-level manager and the operational manager and the score of the mid-level managers was higher than the operational managers. It is actually expected that mid-level managers will be higher in terms of performance perception than operational managers. Another difference in the effect of business intelligence on the user sub-dimension was found to be between the mid-level manager and the senior manager and the score of the mid-level managers was higher.
When the sub-dimensions of the effect of business intelligence applications on performance were compared according to the level of management of the participants in our study, a statistically significant difference was found between the effect of business intelligence use on clinical processes and management levels (p<0.05). In the further analysis, it was determined that the difference in the level of management in the effect of using business intelligence on overall performance perception was between the mid-level manager and the operational manager and the score of the mid-level managers was higher than the operational managers.
C O N CL US IO N
Healthcare is the one of the largest business sectors which is growing very fast. In health management, the configuration of big data is getting high importance. With aid of big data configuration creates the prediction of the diseases and providing the basic treatment methods. On the other hand, the big data configuration helps to decrease the health care expenditure with better lifestyle and quality.
It is seen that the design and implementation of business intelligence implementation projects in accordance with the strategic objectives of the company contributes positively to the business performance of the manager at all levels. It is possible to see that institutions that are able to establish the business intelligence use and system and establish a sustainable structure achieve much more effective results than their competitors. Businesses that can properly complete the aforementioned business intelligence projects and
be adapted to the developing technology are in a superior position in terms of time, speed, reduction of workforce burden, competitiveness, making it easier to control and manage corporate data and information and access to quality information.
As a result of the research, it was determined that it has a positive and significant effect on measurable performance indicators if the managers from all levels in the managerial levels actively follow the corporate business intelligence application screens. In this context, when businesses monitor and control their operational activities through corporate business intelligence, it has been concluded that performance indicators provide less time loss, high reliability, integrated data, quality and accurate valuation advantages in the evaluation process. In the research, it was observed that the effect of performance results of operational managers' business intelligence applications from management levels was higher
Işık M., Yarar O., Söylemez Sur D. (2021). Measurement of the effects of business intelligence applications on performance in hospitals according to the managerial levels: a chain hospital application. Journal of International Health Sciences and Management, 7(13):97-108
107 than that of senior and middle level managers. This
can be explained as the fact that operational managers are much more in the field of application than middle and senior managers.
It is an inevitable fact that the companies that internalize such works by absorbing them in the coming years will be included in the class of successful companies and the managers working in these companies will take their place in the sector as successful managers. By allowing business intelligence to be used by mobile channels, it will facilitate the business of companies implementing important strategic decisions in the digitalizing modern world and ensure integration and strengthen the company's vision and communication network with its external partners.
It is also very important for managers to direct their business intelligence screens with data working with probable future-oriented algorithms in addition to routine reporting and to activate warning mechanisms in order to establish an accurate decision support system. When there are too many deviations from the planned target rates in the performance indicators monitored in the system or when an undesirable situation occurs in the system, the activation of the warning mechanism and informing the responsible persons about the situation ensures that many negative results are prevented from the beginning. In institutions where sudden changes are important, these applications should definitely be added to the system.
It is very important that top management's strategic company goals and business intelligence initiatives run in parallel. Otherwise, many studies are quite likely to be wasted. No matter how well
the system is designed, the contribution of the output to the corporate performance when it is not fed with the right input will be minimal. Unclean data will not produce clean results. It will be possible to have an enterprise structure in which only qualified labor force will come to the forefront thanks to the processing and structuring of the big data and automation of the processes by taking decisions that will affect the functions of the enterprise from these structured data. To successfully achieve strategic business value, businesses need to plan the strategic role of data analysts well, investing not only in data infrastructure and analytical technologies but also in the point of talented analysts. Likewise, as the sponsor of business intelligence, a consistent, effective and visionary manager should be sustainably maintained within the company.
Acknowledgments:
The legal approval has been collected by MLP Care. All necessary information was obtained from this hospital group by ERP and BI database. Thanks to MLP Care Company for their decks
Conflict of Interest:
The authors declare that they have no conflict of interest.
Ethical Approval (Must be answered):
Ethical Committee Submission has been done to Okan University 1st November 2018, and the approval has been received.
Funding:
No financial support
R EF E RE N CE S
Willcocks, L.P., Sauer, C. And Lacity, M.C (2016). “Enacting Research Method in Information Systems:Volume 3”, Springer ISBN: 9783319292724.
Ashrafi, N., Kelleher, L., &Kuilboer, J-P. (2014).” “Theimpact of business intelligence on healthcare delivery in the USA" Interdisciplinary Journal of Information, Knowledge, and Management, Vol. 9, pp. 117-130, (2014).
Blind, A. (2012). “Four-layer Data Model
Implementation for Business Intelligence”, Thesis Study, (2012).
Özdoğan, O.,(2016). “Büyük Veri Denizi”, (1st Edition), Elma Yayınevi, ISBN: 9786059367059.
Ki, P.Y.,Sawy, E., Omar, A. and Peer, F., (2017). "The Role of Business Intelligence and Communication Technologies in Organizational Agility: A Configurational Approach," Journal of
the Association for Information Systems:
http://doi.org/10.17705/1jais.00467.
Schultz, N.O., Collins, A.B. & McCulloch, M., (1994). “The ethics of business intelligence”, Journal of Business Ethics https://doi.org/10.1007/BF00871677.
Ivan, M. andVelicanu, M.,(2015). “Healthcare Industry Improvement with Business Intelligence”, Informatica
Economica,
https://doi.org/10.12948/issn14531305/19.2.2015.08.
Vest, J.R.,Grannis, S.J., Haut D.P., Halverson P.K. and Menachemi N., (2017). “Using structured and unstructured data to identify patients’ need for services that address the social determinants of health”, International Journal of Medical Informatics, Vol. 107, pp.101-106, (2017).
Jothia, N.,Aini, N., Rashidb, A. andHusai, W., (2015). “Data Mining in Healthcare – A Review”, (2015), Procedia Computer Science, https://doi.org/10.1016/j.procs.2015.12.145.
Iatan, I.F., (2016). “Issues in theUse of Neural Networks in Information Retrieval”, Springer, ISBN: 9783319438702 Kudyba, S. And Hoptroff R, (2001). “Data Mining and Business Intelligence A Guide to Productivity”, IGI Global, ISBN:9781930708808
Kao, Y. H.,Yu, C.M., Masud, M., Wu, W.H., Chen,L.J., Chun, Y. and Wu J., (2016). “Design and evaluation of hospital-based business intelligence system (HBIS): A foundation for design science research methodology”, Computers in Human Behaviour, https://doi.org/10.1016/j.chb.2016.04.021.
Işık M., Yarar O., Söylemez Sur D. (2021). Measurement of the effects of business intelligence applications on performance in hospitals according to the managerial levels: a chain hospital application. Journal of International Health Sciences and Management, 7(13):97-108
108
Richards, G.,Yeoh, W., Chong, A.Y.L and Popovic, A, (2017). “ Business Intelligence Effectiveness and Corporate Performance Management: An Empirical Analysis”, Journal of Computer
Information Systems
https://doi.org/10.1080/08874417.2017.1334244
Dwivedi, A., Niranjan, M., and Sahu, K., (2013). “A Business Intelligence Technique for Forecasting the Automobile Sales using Adaptive Intelligent Systems (ANFIS and ANN)”, International Journal of Computer Applications, Vol. 74, No: 9, pp. 7-13, (2013).
Dinçerden, E., (2017). “İş Zekâsı ve Stratejik Yönetim”, 1st Edition, Beta Yayınları
Olszak, C. M., (2016). “Toward Better Understanding and Use of Business Intelligence in Organizations”, Information Systems Management, https://doi.org/10.1080/10580530.2016.1155946 Gök, M, Akçetin, E. and Çelik, U., (2017). “Rapidminer ile Uygula malı Veri Madenciliği”, 1st Edition, Pusula Yayıncılık. Parida, A., Kumar, U., Galar, D. andStenström, C., (2015). "Performance measurement and management for maintenance: a literature review", Journal of Quality in Maintenance Engineering, Vol. 21 Iss 1 pp.
Kowalczyk, M., (2017). “The Support of Decision Processes with Business Intelligence and Analytics”, Springer, ISBN : 9783658192297
Muehlen, M. and Shapiro, R., (2014). “Business Process Analytics”, Springer, Handbook on Business Process Management 2, ISBN: 9783642019821.
Amayri, M., Arora, A., Ploix, S., et all, (2016). “Estimating occupancy in hetero geneous sensor environment”, Energy and Buildings, https://doi.org/10.1016/j.enbuild.2016.07.026 Babiceanu, R.F. and Seker, R., (2016). “Big Data and virtualization for manufacturing cyber-physical systems: A survey of the current status and future outlook”, Computers in Industry, https://doi.org/10.1016/j.compind.2016.02.004
Shim, J.P., Warkentin, M., Courtney, J. F. et all. (2002). “Past, present, and future of decision support technology”, Decision Support System, Vol. 33, Issue2, pp.111-126, (2002).
Yeaoh, W.,Popovic, A., (2015). “Extending the understanding of critical success factors for implementing business intelligence systems”, JASIST, https://doi.org/10.1002/asi.23366
Kaklauskas, A., (2015). “Intelligent Decision Support Systems”, Springer, ISBN: 9783319136585
Intezari, A.,and Gressel, S., (2017). “Information and reformation in KM systems: big data and strategic decision making”, Journal of Knowledge Management, Vol. 21, No.1, pp. 71-91, (2017).
Duan, L.,Xiong, Y., (2015). “Big data analytics and business analytics”, Journal of Management Analytics, Vol. 2, Issue 1. Brooks, P.,Gayar, O. E, and Sarnikar, S, (2015). “A framework for developing a domain specific business intelligence maturity model: Application to health care”, International Journal of Information Management, Vol. 35, pp. 337-345.
Şeker, Ş.A. (2013). İş Zekâsı ve Veri Madenciliği Weka İle, 1. Baskı, Cinius Yayınları, 2013.
Wang, Y, Hajli, N. (2016). “Exploring the Path to Big Data Analytics Success in Healthcare’’, Journal of Business Research, 2016.
Işık, F. (2016). ‘Business Intelligence Requirement Analysis in Small and Medium Enterprises a Masters Thesis (Tez). Atılım Üniversitesi, Endüstri Mühendisliği Ana Bilim Dalı Uzmanlık Tezi; 2016.
Najah, R., Rahman, N.R. (2017). ‘’Bilgi Sistemlerinin Performans Değerlemeye Etkisi: Sanayi İşletmeleri Araştırması (Tez). Selçuk Üniversitesi, Sosyal Bilimler Enstitüsü İşletme Anabilim Dalı Yönetim Organizasyon Bilim Dalı Uzmanlık Tezi; 2017.
Özçam, Y, Çoşkun, E. (2016). “Türkiye’de Faaliyet Gösteren İşletmelerin İş Zekâsı Kullanım Düzeylerinin İncelenmesi Üzerine Bir Araştırma’’, Aksaray Üniversitesi İktisadi ve İdari Bilimler Fakültesi Dergisi, 2016, 8(1): 73-81.