1/
f noise in amorphous silicon and silicon-germanium alloys
Robert E. Johanson
*a, Mehmet Günes
b, S. O. Kasap
aa
Department of Electrical Engineering, University of Saskatchewan, 57 Campus Drive, Saskatoon,
SK Canada S7N 5A9;
b
Department of Physics, Izmir Institute of Technology, Gaziosmanpasa Bulv. No:16, Çankaya,
Izmir, 35210, Turkey
ABSTRACT
We report measurements of conductance noise of a-Si1-xGex:H in two different geometries; one where the current flow is transverse to the surface and the other longitudinal to it. Because of the large increase in sample resistance in going from transverse to longitudinal conduction, it was not possible to measure both geometries at the same temperature. However, the temperature trends are compatible with a common noise source. For both geometries, alloying with up to 40 % Ge reduces the noise magnitude by a factor of 50 over that found in a-Si:H.
Keywords: 1/f noise, amorphous silicon, silicon-germanium alloy
1. INTRODUCTION
1/f noise is ubiquitous, and therein lies its mystique. Almost all materials that conduct will exhibit fluctuations in conductance, and for many of them the noise power density spectrum follows a 1/ fα power law.1 The case α = 1 is particularly attractive theoretically since the noise is then scale invariant, and much effort has gone into formulating a universal theory of 1/f noise. As a result, there seems to be a tendency to downplay materials that do not produce the standard of Gaussian 1/f noise. Hydrogenated amorphous silicon (a-Si:H) is one such material; measurements indicate that the noise is atypical in a number of ways.2 For some samples, the noise is “nonlinear” in that the noise power does not scale quadratically with the bias current used to detect the conductance fluctuations.3 Other measurements show that the noise signal contains a significant non-Gaussian component.4 Some a-Si:H samples produce spectra that deviate significantly from a power law.5 Telegraph-like noise is found in samples of surprisingly large volumes.6 Understanding these results is not helped by contradictory results from different researchers. For example, one publication on undoped a-Si:H sandwich structures reports noise spectra that bend downward reminiscent of a Lorentzian.7 Others observe undoped a-Si:H in coplanar structures producing spectra that either fit to power laws8 or bend sharply in the other direction.5 Some report finding strongly non-Gaussian signals whereas others find only Gaussian noise. The discrepancies might be due to differences between samples prepared at different laboratories since hydrogen concentration and bonding, defect density, and electronic structure are influenced by the production method and deposition conditions. However, the disparate results might also be indicative of the noise mechanism in a-Si:H. Of particular interest are the different noise spectra produced by undoped a-Si:H samples with sandwich and coplanar geometries. The existence of random telegraph-like noise has led to the hypothesis that conduction is via filaments of current. If correct, conduction in coplanar samples concentrates in relatively long filaments whereas sandwich structures would have large numbers of short filaments possibly leading to different noise spectra. In this paper we try to compare sandwich and coplanar samples of nominally identical material. We chose an amorphous silicon-germanium alloy (a-Si1-xGex:H) for the study because the contacts are ohmic to a higher voltage for a-Si1-xGex:H sandwich structures than those made from a-Si:H.
Given the difficulties in interpreting noise measurements for a-Si:H, it may seem unwise to introduce an additional complication by alloying with germanium. However, a-Si1-xGex:H is a well studied material because of its use as a narrow-bandgap, intrinsic layer in multi-junction solar cells. The electronic structure of the alloy changes systematically with Ge concentration, and a further goal of this investigation is to correlate these changes with changes in the noise
spectra. Adding Ge primarily results in a smaller bandgap. The mobility gap (the energy region containing localized states between the bands) of a-Si1-xGex:H decreases linearly with x from 1.8 eV for a-Si:H to 1.0 eV for a-Ge:H.9 As the mobility gap narrows, the Fermi level tracks the conduction band mobility edge for x between 0.1 and 0.7.9,10 Thus the electron density in the conduction band does not change significantly over a wide range of Ge concentration. The conductivity activation energy remains between 0.75 eV and 0.7 eV despite the changes in the mobility gap (electrons are the majority carrier). The density of midgap defect states increases exponentially with x and is typically about two orders of magnitude higher in a-Ge:H compared to a-Si:H.11 Time-of-flight studies of electron transport show that the electron drift mobility decreases with x due to an increase in the width of the conduction band tail states.12 The electron microscopic mobility inferred from these studies is not significantly changed. Optical studies show that the Urbach edge and the valence band tail states are not affected by alloying. The fact that the mobile carrier density depends only weakly on Ge concentration is fortuitous for noise experiments since changes in the noise spectra are more readily attributed to changes in the density of states.
2. METHODOLOGY
Samples of undoped a-Si1-xGex:H were prepared by RF-PECVD. Sandwich structures were fabricated on stainless steel substrates with the addition of thin layers of n-type material deposited before and after the 1.5 µm thick undoped layer to improve the ohmicity. Evaporated Cr dots 1.6 mm in diameter form the top electrodes. For the longitudinal samples, glass substrates were used, and coplanar Cr electrodes were evaporated either before or after the sample deposition. The Ge content of the alloys was confirmed using EDX/SEM. Results from the alloys were compared to 1.0 µm thick samples of undoped a-Si:H.
A description of the noise measurement apparatus has previously been described.13 Basically, a filtered constant voltage is applied to a resistor divider consisting of the sample and a low-noise resistor. The resulting direct bias current will fluctuate due to changes in the sample’s conductance, and the current fluctuations are capacitively coupled into a low-noise current-to-voltage converter. After further amplification, the signal is passed through an anti-aliasing filter and digitized. A discrete Fourier transform of the voltage time-series yields the noise power spectrum. In order to obtain better coverage over the frequency range of interest 1 Hz to 40 KHz, up to three Fourier transforms with different frequency spans are calculated from each time-series. Averaging over 50 to 100 time-series produces the final noise spectrum. The Johnson noise and amplifier noise are measured separately and subtracted leaving only the noise due to conductance fluctuations.
Samples with a sandwich structure are often non-ohmic, and we paid particular attention to the I-V relation for the transverse samples. The a-Si1-xGex:H samples are ohmic up to the largest voltage applied, typically 5 V. However, the samples of a-Si:H become superohmic above 0.1 V. We restricted noise measurements to the linear region of the I-V curve, but this limited the usefulness of the a-Si:H samples. For all samples and at all temperatures, noise spectra for a range of bias currents were measured in order to check the dependence of the noise magnitude on bias current. The noise power in all cases scales as the square of the bias current; in other words we never found “non-linear” noise. For the spectra presented in this paper, the noise power is normalized by dividing by the square of bias current.
With our current apparatus, it was not possible to measure sandwich and coplanar samples at the same temperature. The ability to measure current fluctuations is limited by the maximum bias current and the level of background noise especially Johnson noise. These criteria are affected by the sample resistance—a large resistance limits the bias current whereas a small resistance produces excessive Johnson noise. For the level of noise typical of a-Si:H, our apparatus is restricted to sample resistances from about 10 KΩ to 50 MΩ. Since a-Si:H can only be prepared in thin films on the order of a micron thick and since our electrode dimensions are typically several mm, the resistance of sandwich samples is a factor of 106 less than coplanar samples. Thus it is not possible for us to directly compare the two geometries at the same temperature. Instead we measure over as wide a temperature range as possible and in particular to as high a temperature as possible with the transverse current and as low as possible for the longitudinal current and extrapolate the trends.
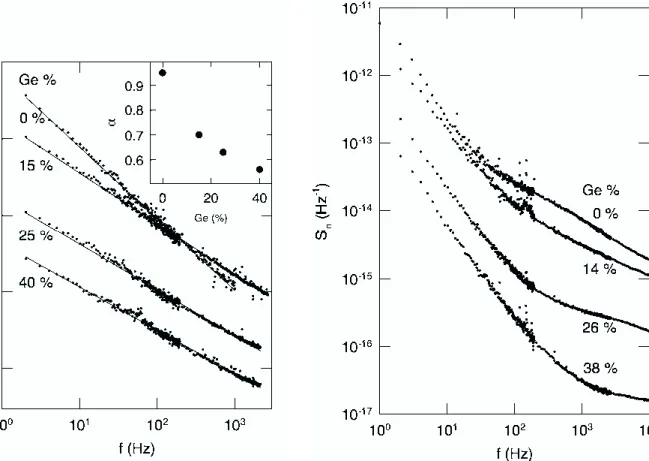
Figure 1: Normalized noise power spectra for sandwich samples. The lines are fits to a power law. Inset: The power law exponent α as a function of Ge concentration.
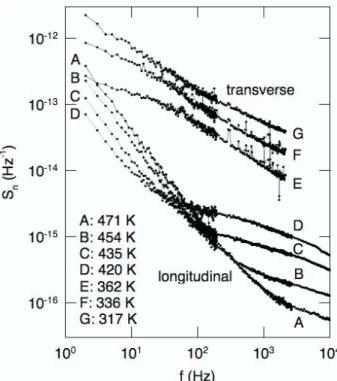
Figure 2: Normalized noise power spectra for coplanar samples
In addition to standard noise measurements, two tests for non-Gaussian noise were performed—second spectrum14 and correlations. Since the noise spectra are calculated from a time series of finite period, repeated measurements of noise power results in fluctuating values. The spectrum of the fluctuations in noise power is called the second spectrum; for noise that obeys Gaussian statistics, the second spectrum is white, i.e. independent of frequency. We calculate second spectra from the noise power obtained by integrating over various frequency bands. The second test involves correlations between the noise power fluctuations at different frequencies. The fluctuations at different frequencies should be uncorrelated for Gaussian noise. For this test, we select 15 frequencies and calculate the cross-correlation coefficient between each pair of frequencies.15 A histogram of the correlation coefficients should be distributed about 0 for Gaussian noise.
3. DATA AND DISCUSSION
Noise spectra from the sandwich samples (Fig. 1) and coplanar samples (Fig. 2) appear qualitatively different. The sandwich samples produce typical 1/f noise spectra that fit well to f−α; α is near 1 for a-Si:H but decreases with the addition of Ge. In contrast, the coplanar samples’ spectra contain a sharp upward break—the local slope is much less at higher frequencies. Based on the difference in shape, we are tempted to conclude that the noise generation mechanism depends on current direction. However, the temperature is significantly different for the two sets of measurements. The sandwich samples of Fig. 1 were measured at about 335 K for the alloys and 375 K for the a-Si:H whereas the spectra in Fig. 2 for the coplanar samples were obtained at about 450 K. Further, we know from previous work on coplanar a-Si:H samples that the shape of the noise spectrum changes with temperature. To determine if the two geometries truly produce incompatible results, the trends with temperature need to be examined. Figure 3 shows spectra obtained at
several temperatures for a-Si1-xGex:H with x ≈ 0.25 in both the sandwich and coplanar geometries. For the sandwich sample, noise power decreases with temperature by about a factor of 5 from 317 K to 362 K. The shape of the spectrum is not affected except for a rounding off at low frequencies at the highest temperature. For the coplanar sample, the temperature dependence of the noise power at higher and lower frequencies is different. The noise power increases with temperature at low frequencies but increases at higher frequencies in the region above the break in the curve. Thus as the temperature is lowered, more of the spectrum over the observed frequency span consists of the upper frequency branch. If this trend continues, at a sufficiently low temperature the upper branch will dominate the spectrum. Are the spectra observed for the sandwich samples simply the low temperature limit of the trend observed for the coplanar samples? The data hints that this may be so. Extrapolating the coplanar sample’s noise power at high frequencies to lower temperatures results in a magnitude close to that observed for the sandwich samples. Further, increasing Ge content causes the slope of the high frequency branch to flatten (Fig. 2). Likewise α for the sandwich samples follows the same trend (Fig. 1). Clearly for a definitive answer both geometries need to measured at the same temperature.
The effect of alloying with Ge is more clear. For both geometries, adding Ge significantly decreases the magnitude of the noise power (Figs. 1 and 2) by roughly a factor 50 for 40% Ge. As noted above, both α for the sandwich samples and the slope of the higher frequency branch for the coplanar samples are reduced by adding Ge.
We will now briefly discuss our measurements in terms of several noise models. A popular model for 1/f noise links conductance noise to temperature fluctuations. Since the conductivity of semiconductors is activated, even very small changes in temperature produce noticeable changes in conductance. However, our data do not support this model. As noted above, the conductivity activation energies for the alloyed samples are all about 0.7 eV. Since the temperature fluctuations would be the same for each sample, the noise power should be similar in magnitude for all the alloy samples in contradiction to what is observed.
Because of the large density of localized gap states that act as carrier traps, generation-recombination noise models have proved popular for amorphous semiconductors. It is well known that a single trap level produces a Lorentzian noise
Figure 3: Normalized noise power spectra for a sandwich sample and a coplanar sample of alloy with ca. 25% Ge at the temperatures indicated.
Figure 4: Second spectra over the frequency bands indicated for the coplanar alloy sample with 26 % Ge at 481 K.
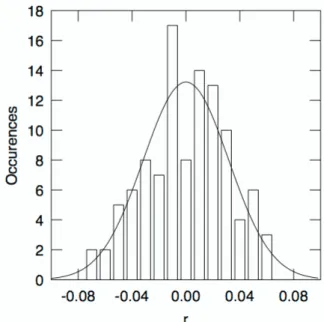
Figure 5: Histogram of cross-correlation coefficients of the noise power density at 15 frequencies for a coplanar a-Si:H sample at 482 K. Line is the expected distribution for no correlation.
spectrum S(ω) ∝1/(1+ ω2/ω02) where ω0 is the sum of the trap and release rates. A deeper state has a smaller release rate and thus a smaller
ω
0. The distribution of localized states in an amorphous semiconductors leads to a more complicated noise spectrum. The easy approach is to calculate the spectrum by simply adding the Lorentzians for each trap level although, strictly speaking, this is incorrect since correlations can exist between the occupancies of traps at different energies.16,17 The challenge is to explain the decrease in α for increasing Ge content using a G-R model knowing that the numbers of deep states increases and the conduction band tail broadens. Qualitatively, the deep traps should contribute weight to the spectrum at lower frequencies because of the lowω
0 so one might expect α to increase. A new noise model by Fine, et al. (see this volume) relates changes in conductance to potential fluctuations. The potential is altered by trapping and release into a defect state and the consequent changes to the charge state of the defect. We have not yet explored the model in detail but note that the Ge alloy material may provide a test of the model due to the changes in defect type, distribution, and density that occur in the alloys.As mentioned in the introduction, some researchers find a noise signal with a non-Gaussian component.4 We tested the coplanar samples for non-Gaussian statistics and find that the second spectrum is always white and the average correlation coefficient is 0±0.01. Examples of typical data are shown in Figures 4 and 5. As is apparent from the figures, the statistical tests indicate that the noise signal is Gaussian.
4. CONCLUSIONS
We have measured conductance noise in sandwich and coplanar a-Si1-xGex:H structures as a function of Ge content and temperature. While the noise data for sandwich and coplanar samples made from nominally identical material appear different, the extrapolation of the coplanar noise spectra to lower temperatures points to a possible common noise mechanism. The magnitude of the noise power decreases strongly with Ge content whereas the majority carrier density remains relatively constant. This points to a noise mechanism that is controlled by localized states in the mobility gap. We find the noise signal to exhibit Gaussian statistics in contrast to some earlier papers.
5. ACKNOWLEDGEMENTS
We would like to thank Drs. J. Yang and S. Guha of United Solar Systems Corp. for providing samples and the Natural Sciences and Engineering Research Council of Canada for funding.
REFERENCES
1. M. B. Weissman, “1/f noise and other slow, nonexponential kinetics in condensed matter,” Rev. Mod. Phys. 60, pp. 537–571, 1988.
2. R. E. Johanson, M. Günes, and S. O. Kasap, “Noise in hydrogenated amorphous silicon,” IEE Proc.-Circuits
Devices Syst. 149, pp. 68–74, 2002.
3. C. Parman, and J. Kakalios, “Nonlinear 1/f noise in amorphous silicon,” Phys. Rev. Lett. 67, pp. 2529–2532, 1991. 4. C. E. Parman, N. E. Israeloff, and J. Kakalios, “Conductance-noise power fluctuations in hydrogenated amorphous
silicon,” Phys. Rev. Lett. 69, pp. 1097–1100, 1992.
5. M. Günes, R. E. Johanson, and S. O. Kasap, “1/f-noise study of undoped intrinsic hydrogenated amorphous silicon thin films,” Phys. Rev. B 60, pp. 1477–1479, 1999.
6. C. E. Parman, N. E. Israeloff, and J. Kakalios, “Random telegraph-switching noise in coplanar current measurements of amorphous silicon,” Phys. Rev. B 44, pp. 8391–8394, 1991.
7. P. A. W. E. Verleg, and J. I. Dijkhuis, “Generation-recombination noise studied in hydrogenated amorphous silicon,” J. Non-Cryst. Solids 266–269, pp. 232–236, 2000.
8. F. Z. Bathaei, and J. C. Anderson, “Electrical noise measurements in intrinsic amorphous silicon,” Philos. Mag. B
55, pp. 87–100, 1987.
9. K. D. Mackenzie, J. R. Eggert, D. J. Leopold, Y. M. Li, S. Lin, and W. Paul, “Structural, electrical, and optical properties of a-Si1-xGex:H and an inferred electronic band structure,” Phys. Rev. B 31, pp. 2198–2212, 1985. 10. D. Della Sala, C. Reita, G. Conte, F. Galluzzi, and G. Grillo, “Gap density of states in amorphous
silicon-germanium alloy: Influence on photothermal deflection spectroscopy and steady-state conductivity measurements,”
J. Appl. Phys. 67, pp. 814-825, 1990.
11. T. Unold, J. D. Cohen, and C. M. Fortmanna, “Electronic mobility gap structure and deep defects in amorphous silicon-germanium alloys,” Appl. Phys. Lett. 64, pp. 1714–1716, 1994.
12. Q. Wang, H. Antoniadis, and E. A. Schiff, “Electron-drift-mobility measurements and exponential conduction-band tails in hydrogenated amorphous silicon-germanium alloys,” Phys. Rev. B 47, pp. 9435–9448, 1993.
13. R. E. Johanson, D. Scansen, and S. O. Kasap, “1/f conductance noise in n-type amorphous silicon,” Philos. Mag B
73, pp. 707–714, 1996.
14. M. B. Weissman, Rev. Mod. Phys. 65, pp. 829–839, 1993.
15. R. E. Johanson, D. Scansen, and S. O. Kasap, “Effect of light exposure on 1/f noise in a-Si:H,” J. Vac. Sci. Technol.
B 17, pp. 73–76, 1999.
16. R. I. Badran, C. Main, and S. Reynolds, “Analysis and modelling of generation-recombination noise in amorphous semiconductors,” Thin Solid Films 427, pp. 133–136, 2003.
17. F. N. Hooge, “On the additivity of generation-recombination spectra,” Proceedings of the 16th International
Conference on Noise in Physical Systems and 1/f Fluctuations, ed. Bosman, G., World Scientific (Singapore, 2001),
pp. 555–560