THE IMPACTS OF HEALTH SECTOR REFORM
ON THE EFFICIENCY AND PRODUCTIVITY OF PUBLIC AND PRIVATE HOSPITALS IN TURKEY A Master‟s Thesis by MÜGE DİLER Department of Economics Bilkent University Ankara September 2009
THE IMPACTS OF HEALTH SECTOR REFORM ON THE EFFICIENCY AND PRODUCTIVITY OF PUBLIC AND PRIVATE HOSPITALS IN TURKEY
The Institute of Economics and Social Sciences of
Bilkent University
by
MÜGE DİLER
In Partial Fulfillment of the Requirements for the Degree of MASTER OF ARTS in THE DEPARTMENT OF ECONOMICS BİLKENT UNIVERSITY ANKARA September 2009
I certify that I have read this thesis and have found that it is fully adequate, in scope and in quality, as a thesis for the degree of Master of Arts in Economics.
--- Assoc. Prof. Osman Zaim Supervisor
I certify that I have read this thesis and have found that it is fully adequate, in scope and in quality, as a thesis for the degree of Master of Arts in Economics.
--- Assist. Prof. Ümit Özlale Examining Committee Member
I certify that I have read this thesis and have found that it is fully adequate, in scope and in quality, as a thesis for the degree of Master of Arts in Economics.
--- Assoc. Prof. Levent Akdeniz Examining Committee Member
Approval of the Institute of Economics and Social Sciences
--- Prof. Dr. Erdal Erel
iii ABSTRACT
THE IMPACTS OF HEALTH SECTOR REFORM ON THE EFFICIENCY AND PRODUCTIVITY OF PUBLIC AND PRIVATE HOSPITALS IN
TURKEY
Diler, Müge
M.A., Department of Economics Supervisor: Assoc. Prof. Dr. Osman Zaim
September 2009
Hospitals consume the largest share of government health resources. Since they account for such a large share of health expenditure, improvements in their efficiency and productivity will yield tremendous benefits for the entire health sector. On this basis, in 2003, the government of Turkey declared a reform program called “Transformation in Health”. This study by using a rich panel data of 440 hospitals operating in 81 province in Turkey (observed throughout 2001-2007 i.e. pre and post reform periods) addresses the impacts of health sector reform on the efficiency and productivity of the public and private hospitals by employing Data Envelopment Analysis (DEA), bootstrapping and Malmquist productivity index. The results of the analysis indicate that slightly reduced efficiency of previously SSK owned hospitals have been more than offset by increased efficiency in MoH hospitals as well as in private and university hospitals, leading to an accessible, standardized and higher quality health services covering almost the whole population and that in overall, the reform has improved the productivity of all hospitals implying that health sector reform has succeeded.
Keywords: data envelopment analysis, Malmquist productivity index, bootstrapping, health sector reform, hospital efficiency and productivity
iv ÖZET
SAĞLIK REFORMU’NUN TÜRKİYE’DEKİ DEVLET HASTANELERİNİN VE ÖZEL HASTANELERİN ETKİNLİĞİ VE VERİMLİLİĞİ ÜZERİNDEKİ
ETKİLERİ Diler, Müge
Yüksek Lisans, İktisat Bölümü Tez Yöneticisi: Doç. Dr. Osman Zaim
Eylül 2009
Devletin sağlık sektörü için ayırdığı kaynakların en büyük kısmını hastaneler tüketir. Sağlık harcamalarının büyük kısmının hastaneler tarafından tüketmesinden dolayı, hastanelerin etkinlik ve verimliliklerindeki iyileşmeler, tüm sağlık sektörü için büyük fayda sağlayacaktır. Buna dayanarak Türkiye‟de 2003 yılında, hükümet “Sağlıkta
Dönüşüm” olarak adlandırılan reform programını ilan etti. Bu çalışma, Türkiye‟nin
81 ilinde faaliyet gösteren 440 hastaneyi içeren zengin bir panel veri kullanarak Sağlık Reformu‟nun devlet hastaneleri ve özel hastanelerin etkinliği ve verimliliği üzerindeki etkilerini 2001-2007 yılları boyunca (reform öncesi ve sonrası dönem) Veri Zarflama Teknikleri, Malmquist Verimlilik İndeksi ve Bootstrapping Tekniği‟ni kullanarak araştırmaktadır. Analiz sonuçları, Sağlık Bakanlığı‟na ait hastaneler, üniversite hastaneleri ve özel hastanelerin etkinlik ve verimliliklerindeki önemli artışların daha önce SSK‟ya ait olan hastanelerin etkinlik ve verimliliklerindeki az miktar düşüşe baskın geldiğini ve bu durumun nüfusun neredeyse tamamını kapsayan, ulaşılabilir, standart ve daha kaliteli sağlık hizmetlerinin sağlanmasına öncülük ettiğine ve bununla birlikte tüm hastanelerde önemli verimlilik artışları gözlendiğine işaret etmektedir.
Anahtar Kelimeler: veri zarflama teknikleri, Malmquist verimlilik indeksi, bootstrapping, sağlık reformu, hastane etkinliği ve verimliliği
v
ACKNOWLEDGEMENTS
First and foremost I offer my sincerest gratitude to my supervisor Associate Prof. Dr. Osman Zaim who has supported me throughout my thesis with his patience and knowledge. I would also like to thank Assistant Prof. Ümit Özlale and staff in TEPAV for their valuable comments.
I am grateful to my family for their support and understanding throughout all my studies and my whole life. I have special thanks to mommy for her endless patience and endless efforts in order to feed me continuously.
Finally, I would like to thank my best friends Zeynep Akgül, Meltem Baştan and Ayşegül Aktemur who kept me entertained throughout my study and my whole life with their huge repertoire of anecdotes and stories and who helped me to overcome my doubts in the preparation of this thesis.
vi
TABLE OF CONTENTS
ABSTRACT ... iii ÖZET... iv ACKNOWLEDGEMENTS ... v TABLE OF CONTENTS ... viLIST OF TABLES ... viii
LIST OF FIGURES ... ix
CHAPTER 1: INTRODUCTION ... 1
CHAPTER 2: OVERVIEW OF THE TURKISH HEALTH CARE DELIVERY SYSTEM ... 4
2.1. Pre-Reform Period ... 4
2.2. Transition Period ... 11
CHAPTER 3: LITERATURE SURVEY ... 14
3.1. Data Envelopment Analysis (DEA) ... 14
3.2. Malmquist Productivity Index ... 20
CHAPTER 4: METHODOLOGY ... 24
4.1. DEA Technique ... 24
4.2. Bootstrapping ... 32
vii
CHAPTER 5: DATA, EMPIRICAL RESULTS AND DISCUSSION ... 41
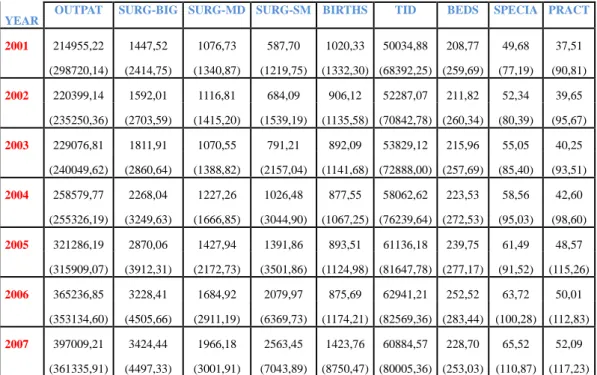
5.1. The Data ... 41
5.2. Empirical Results and Discussion ... 44
5.2.1. Application and Comparison of Output Oriented Farrell Efficiency Scores ... 44
5.2.2. Application and Comparison of Malmquist Productivity Index Scores ... 52
5.2.3. Evaluation of The Reform ... 60
CHAPTER 6: CONCLUSION ... 64 SELECT BIBLIOGRAPHY ... 67 APPENDICES ... 74 APPENDIX A ... 75 APPENDIX B ... 77 APPENDIX C ... 79
viii
LIST OF TABLES
Table 2.1.1. The Population Covered by Social Insurance Programs ... 8 Table 2.1.2. Distribution, Endowments and Per Constituency Rates of Institutions .. 9 Table 5.1.1. Descriptive Statistics: Mean (Standard Deviation) per year ... 43 Table 5.2.1.1. Comparison of DEA and Bootstrap Efficiency Scores, 2001-2007 .. 45 Table 5.2.2.1. Cumulative Malmquist Index and Its Components, 2001-2007 ... 52
ix
LIST OF FIGURES
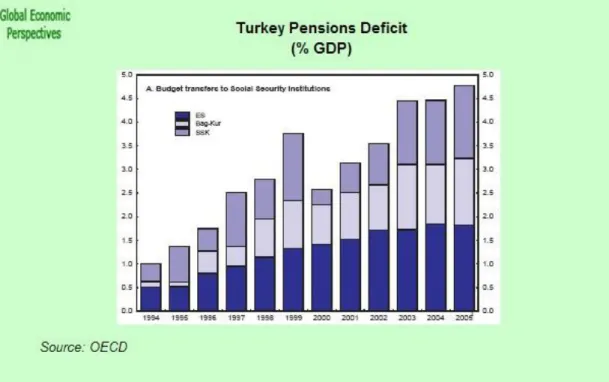
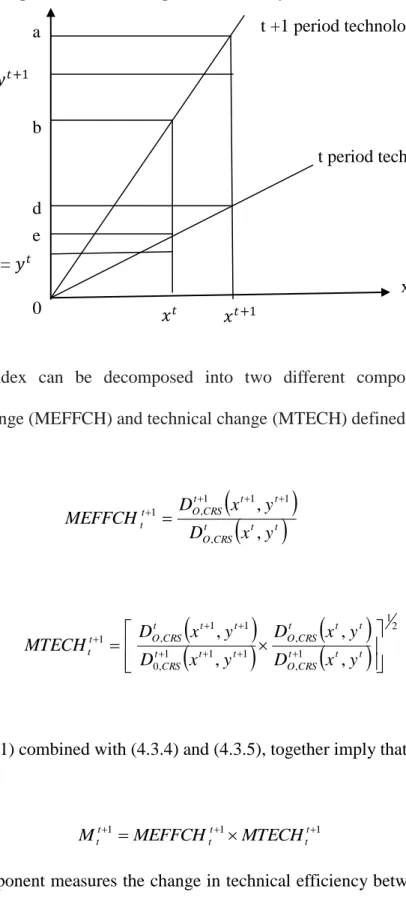
Figure 2.1.1. Budget Transfers to Social Security Institutions (1994-2005) ... 10 Figure 2.2.1. Hospital Beds and Physician Density per 1000 Population in Selected OECD Countries ... 12 Figure 4.1.1. Production Possibility Set and Output Distance Function ... 27 Figure 4.1.2. CRS, NIRS and VRS Frontiers and Scale Efficiency Measurement ... 30 Figure 4.3.1. Output Oriented Malmquist Productivity Index ... 38 Figure 5.1.1. Changes in the Number of Outpatients Treated Per Year in MoH
Hospitals, 2001-2006
... 76 Figure 5.1.2. Changes in the Number of Outpatients Treated Per Year in SSK (revolved) and SSK (merged) Hospitals, 2001-2006
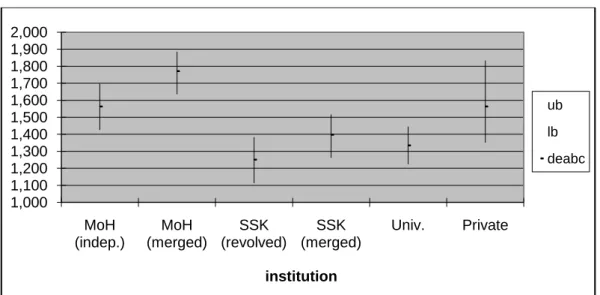
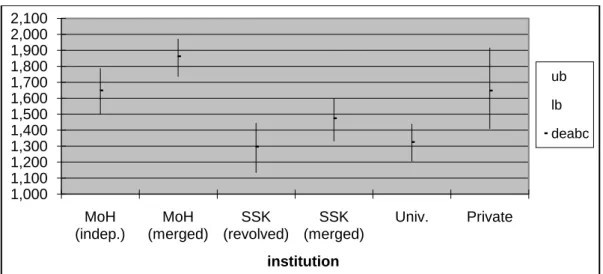
... 76 Figure 5.2.1.1. Confidence Intervals for Bias Corrected Efficiency Scores of 2001 46 Figure 5.2.1.2. Confidence Intervals for Bias Corrected Efficiency Scores of 2002 78 Figure 5.2.1.3. Confidence Intervals for Bias Corrected Efficiency Scores of 2003 48 Figure 5.2.1.4. Confidence Intervals for Bias Corrected Efficiency Scores of 2004 49 Figure 5.2.1.5. Confidence Intervals for Bias Corrected Efficiency Scores of 2005 78 Figure 5.2.1.6 Confidence Intervals for Bias Corrected Efficiency Scores of 2006 . 50
x
Figure 5.2.1.7. Confidence Intervals for Bias Corrected Efficiency Scores of 2007 51 Figure 5.2.2.1. Cumulative Malmquist Index Scores, 2001-2007 ... 56 Figure 5.2.2.2. Confidence Interval for Bootstrapped Malmquist Index of 2001-2002 ... 57 Figure 5.2.2.3. Confidence Interval for Bootstrapped Malmquist Index of 2002-2003 ... 80 Figure 5.2.2.4. Confidence Interval for Bootstrapped Malmquist Index of 2003-2004 ... 58 Figure 5.2.2.5. Confidence Interval for Bootstrapped Malmquist Index of 2004-2005 ... 80 Figure 5.2.2.6. Confidence Interval for Bootstrapped Malmquist Index of 2005-2006 ... 81 Figure 5.2.2.7. Confidence Interval for Bootstrapped Malmquist Index of 2006-2007 ... 59 Figure 5.2.3.1: Satisfaction from Health Care Services, 2003-2007 ... 60 Figure 5.2.3.2. “Is there a problem about quality of health services?”, 2003-2007 . 61 Figure 5.2.3.3 Real Public Health Care Expenditures (Per Capita), 2004-2008 ... 62
1
CHAPTER 1
INTRODUCTION
The period of 1980s, can be characterized as a new era in the world economic and political system due to the strengthening of the neoliberal ideas which support liberalization, deregulation, privatization and outsourcing of the public services. Hence, most of the welfare states began to implement various reform policies that are in line with neoliberal ideas in order to restructure their public service sector. Starting with the 1990s, as a response to neoliberalism, Turkey began to experience a period of reform process in its public service sector. With the elections of November 2002, the newly elected government has designed series of reform packages. In December 2003, Turkish government declared a reform program called “Transformation in Health”. The main objectives of reform could be summarized as follows: setting up a single retirement insurance regime that includes short and long term insurance branches other than health insurance; creation of a general health insurance towards financing the provision of a high quality health service for all population, which is fair, equal, protective and curative; gathering of social benefits and services that are currently being carried out in a scattered manner under one umbrella; establishment of a system based on objective benefit criteria and which is accessible by all groups
2
who are in need and finally creation of a new institutional structure, which will ensure the provision of above mentioned services in a modern and efficient manner. Despite its paramount problems, the Turkish health care system is now well on its way to structural change. The driving force behind the current momentum is Turkey‟s commitments to both IMF and the EU, coupled with having a majority government that is able to command the support of the legislature. Many critical steps have already been undertaken. In January 2005, all social security institutions in Turkey; namely, Social Security Association (hereafter “SSK”), Pension Fund for Civil Servants (hereafter “ES”) and Social Insurance Agency of Merchants, Artisans and the Self-employed (hereafter “BK”) are united under one roof under the supremacy of Ministry of Health (MoH) in order to terminate this four-partite structure of the social security system.
The social security reform which is currently being implemented includes restructuring of MoH to complete its institutional transformation from a mainly provider of services to a regulator of service provision with a view to developing policies, defining standards, controlling health care providers and monitoring the appropriate use of resources. To this end, the transfer of the management and control of the all public hospitals operated by the SSK, and merger of some these with those that were operated by the MoH have been expected not only to benefit from a better allocation of scarce health resources among hospitals, but also to utilize scale economies that are present to its fullest extent. Moreover, IMF-sought Social Security and Universal Health Insurance Law, increased the retirement age and unified all social security beneficiaries under one roof. This law, while broadening the coverage of the insured and hence increasing the demand for the public health service provision, had also repercussions on the demand for health service provision
3
by private hospitals, since it allowed government employees, members of SSK and self-employed beneficiaries to benefit from the services offered by private hospitals. Motivated by those developments in Turkish health sector, this study presents an empirical analysis of the relative efficiency and productivity of Turkish private and public hospitals before and after the reform by using a national data set obtained from the Republic of Turkey Ministry of Health. The methods used to assess relative efficiency and productivity are Data Envelopment Analysis (DEA) and Malmquist productivity index. The study improves upon the traditional DEA, efficiency and Malmquist productivity scores by employing a procedure called bootstrapping that permits to estimate bias corrected efficiency scores and productivity indices. Since bootstrap is seen as the only way of assessing statistical properties (i.e. bias, variance, confidence interval) of the efficiency estimators that comes from some data generating process, it allows to make statistical inferences based on those DEA-estimators, as opposed to the econometric approaches which argue that DEA techniques are non-statistical and that statistical noise caused by DEA-estimators may introduce bias. By using this method, the study investigates the impacts of health care reform on relative performances of public and private hospitals in Turkey over 2001-2007.
The organization of the thesis is as follows: The next chapter is reserved for a brief description of the Turkish health care delivery system and reform process. Chapter 3 is devoted to the survey of the DEA literature and Malmquist productivity index. Chapter 4 describes the methodology used in this study to measure hospital efficiency and productivity. Chapter 5 provides the information on the data used, discusses the main variables of the model and empirical results of the analysis and evaluates the impacts of the reform. Finally, Chapter 6 concludes.
4
CHAPTER 2
OVERVIEW OF THE TURKISH HEALTH CARE DELIVERY
SYSTEM
2.1. Pre-Reform Period
Ministry of Health (MoH) was established in May 1920 to provide, control and coordinate the health care services throughout Turkey. Since those years correspond to the war years which would ultimately lead to the establishment of the Turkish Republic in 1923, with no established private health infrastructure, the MoH assumed the sole responsibility for the provision of health care services. Turkey‟s health care structure relied on the Bismarckian tradition that based itself on the employment status which then led itself to a four-partite, non-universal social security and health service provision system.
The first attempt to constitute a social insurance fund came in 1946. With the establishment of SSK within the Ministry of Labor and Social Security, manual laborers working under a service contract (i.e. private sector and blue-collar public sector workers) were provided health insurance and several social protection insurances against industrial accidents, occupational diseases, sickness, maternity, invalidity, old-age pension and survivors insurance. The institution operated both as
5
an insurer and a health care provider for its members and their dependents. SSK provided health care services through its own hospitals. The system was financed by premiums paid by its members and by transfers from state budget if a deficit occurs. The social security and health insurance coverage had been broadened in 1950, with the establishment of ES. It was a pension fund for retired civil servants and it provided health insurance and health care services both for retired and actively working members along with their dependents. The members and their dependents were provided basic health care services at MoH (i.e. public) hospitals. In this insurance system, there was no specific health insurance premium collected from either active civil servants or pensioners. Instead, it was financed by state budget allocations. The disadvantage of the system was that since all the financing was done by state budget allocations, this caused a large deficit in MoH budget and so in general state budget. The system was operating in the following manner: The fund had financed all health care expenditures of retired government employees with only a 10 percent drug co-payment paid by users. Moreover, health care expenditures of active civil servants were met by their organizations via specific state budget allocations. After the completion of a specific period of state service, active ones became pensioners and began to benefit some privileges that were granted to pensioners only.
Finally, in 1971, BK was established. Hence, from 1971 onwards there were mainly three institutions that constitute Turkish Social Security System: SSK, ES, and BK. With the establishment of BK, the social security and health insurance coverage were extended towards the self employed. The scheme required compulsory membership and hence premium payments for the self-employed who were excluded from the Social Insurance Law. Those were crafts-people, artisans, and small business owners,
6
technical and professional people registered through a professional chamber or association and shareholders of companies other than co-operatives. Nevertheless, the scope of coverage had increased by granting voluntary membership and premium payments to unemployed people, housewives, local community elders, people of Turkish origin (and carrying a foreign passport) who live in Turkey, and the unemployed wives of Turkish nationals working abroad. In 1983, voluntarily access to insurance through BK was extended to self employed agricultural workers (under Law 2926). In 1985-86, the scope of insurance was also extended to include health insurance. Since February 1999, health insurance had been extended to agricultural workers. Diverging from other social insurance systems, BK had no health facilities of its own but rather purchased the health services for its members by entering into contractual arrangements with other public health service providers, including the SSK hospitals. Thus, contributors of this system could only benefit from those hospitals that had contract with BK. Members of BK could choose the level at which they made their contributions that ranged from lowest premium payment level covering limited number of basic health care services to the highest. In this system, at first, the insured paid for the medical expenses and then got reimbursed by BK. Pensioners of the system had to pay 10%, whereas active members and their dependents pay 20% of drug costs.
In early 1990s, increased population and higher demand for health care services resulted in overcrowding and insufficiency of services provided in hospitals, unequal access to health care, unequal dispersion of health personnel and facilities among different geographic regions of Turkey and loss of confidence in public health services. As a response to those problems, during this period, Turkish health system experienced some unsuccessful reform attempts that aimed to increase the rate of
7
population covered by social insurance programs, to set up universal health insurance to remove the inequalities within the system, to encourage private investment in health sector and to improve managerial efficiency of hospitals by giving them more independence and so promoting competition among public hospitals. Although the targets of reform were well-defined, the means of its implementation were not. However, it can be said that attracting private investment into the health sector which resulted in increased number of private hospitals was the only achievement of the reform in this period.
In addition to social security systems discussed so far, in 1992, The Green Card system was introduced in Turkey. In this system which is directly funded by government, with special authorization given to the MoH to issue Green Card, poor people earning less than a subsistence level of income which is defined by the law, are endowed with a special card giving free access to outpatient and inpatient care at the state and some university hospitals. With this card patients are able to meet all of their inpatient medical drug expenses, but not the expenses on outpatient drugs. The percentage of population covered by the Green Card system was 0.6 in 1992 but increased to 16.4 in 2001. This system continues to perform today but the expenditures for the almost 11 million Green Card holders have exceeded government allocations, and increased the budget deficit.
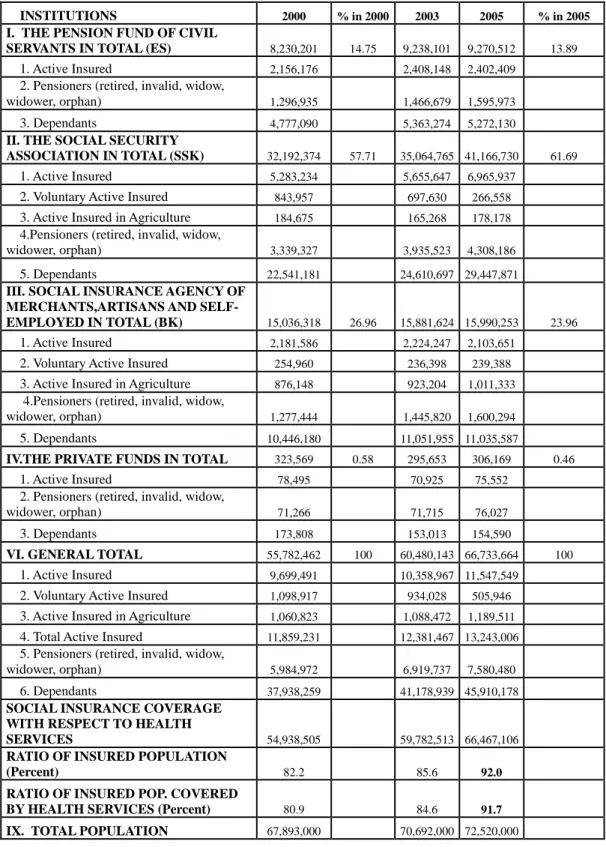
In early 2000s, although several attempts were made to establish financially sustainable, general health insurance system covering the whole population, they could not be implemented successfully. Thus, problems of the existing system had grown gradually. In this period, as shown in table 2.1.1., three major organizations ES, SSK, and BK covered 14.75%, 57.71% and 26.96% of population, respectively. Besides those listed; YOK (university hospitals), state economic enterprises,
8
municipalities, other public institutions, special funds, foundations, Green Card system and private health insurance companies also played a role in the provision of health care services in Turkey. In 2000, %82.2 of the population were insured, and 80.9% of those were covered by a health insurance.
Table 2.1.1. The Population Covered by Social Insurance Programs
INSTITUTIONS 2000 % in 2000 2003 2005 % in 2005
I. THE PENSION FUND OF CIVIL
SERVANTS IN TOTAL (ES) 8,230,201 14.75 9,238,101 9,270,512 13.89
1. Active Insured 2,156,176 2,408,148 2,402,409
2. Pensioners (retired, invalid, widow,
widower, orphan) 1,296,935 1,466,679 1,595,973
3. Dependants 4,777,090 5,363,274 5,272,130 II. THE SOCIAL SECURITY
ASSOCIATION IN TOTAL (SSK) 32,192,374 57.71 35,064,765 41,166,730 61.69
1. Active Insured 5,283,234 5,655,647 6,965,937
2. Voluntary Active Insured 843,957 697,630 266,558
3. Active Insured in Agriculture 184,675 165,268 178,178
4.Pensioners (retired, invalid, widow,
widower, orphan) 3,339,327 3,935,523 4,308,186
5. Dependants 22,541,181 24,610,697 29,447,871 III. SOCIAL INSURANCE AGENCY OF
MERCHANTS,ARTISANS AND
SELF-EMPLOYED IN TOTAL (BK) 15,036,318 26.96 15,881,624 15,990,253 23.96
1. Active Insured 2,181,586 2,224,247 2,103,651
2. Voluntary Active Insured 254,960 236,398 239,388
3. Active Insured in Agriculture 876,148 923,204 1,011,333
4.Pensioners (retired, invalid, widow,
widower, orphan) 1,277,444 1,445,820 1,600,294
5. Dependants 10,446,180 11,051,955 11,035,587
IV.THE PRIVATE FUNDS IN TOTAL 323,569 0.58 295,653 306,169 0.46
1. Active Insured 78,495 70,925 75,552
2. Pensioners (retired, invalid, widow,
widower, orphan) 71,266 71,715 76,027
3. Dependants 173,808 153,013 154,590
VI. GENERAL TOTAL 55,782,462 100 60,480,143 66,733,664 100
1. Active Insured 9,699,491 10,358,967 11,547,549
2. Voluntary Active Insured 1,098,917 934,028 505,946
3. Active Insured in Agriculture 1,060,823 1,088,472 1,189,511
4. Total Active Insured 11,859,231 12,381,467 13,243,006
5. Pensioners (retired, invalid, widow,
widower, orphan) 5,984,972 6,919,737 7,580,480
6. Dependants 37,938,259 41,178,939 45,910,178 SOCIAL INSURANCE COVERAGE
WITH RESPECT TO HEALTH
SERVICES 54,938,505 59,782,513 66,467,106
RATIO OF INSURED POPULATION
(Percent) 82.2 85.6 92.0
RATIO OF INSURED POP. COVERED
BY HEALTH SERVICES (Percent) 80.9 84.6 91.7
9
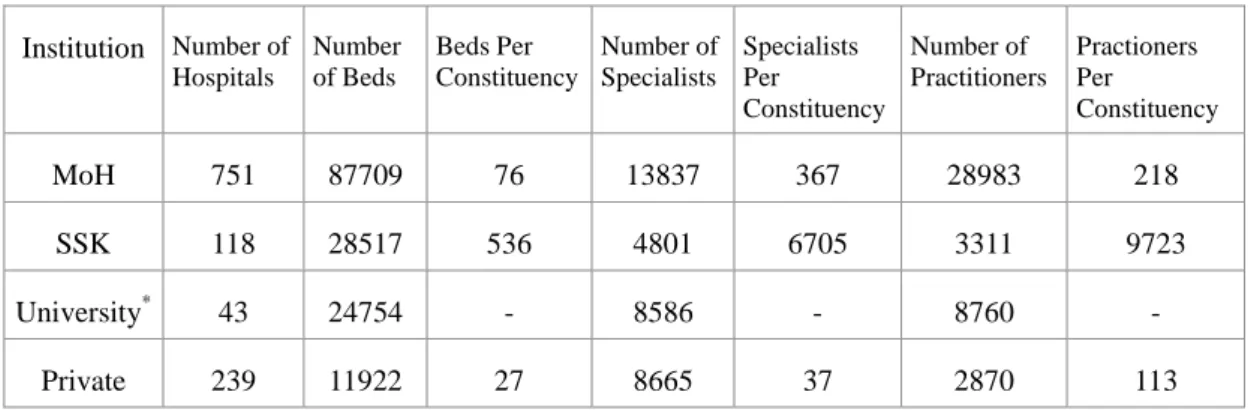
As table suggests, before the reform took place, private hospitals served for just %0.58 of the population whereas SSK was responsible for the health care delivery of %57.71 of the population which eventually led to overcrowding in SSK hospitals and unequal health service delivery among different institutions. Per constituency rates in table 2.1.2., clearly shows the extent of this inequality.
Table 2.1.2. Distribution, Endowments and Per Constituency Rates of Institutions
Institution Number of Hospitals Number of Beds Beds Per Constituency Number of Specialists Specialists Per Constituency Number of Practitioners Practioners Per Constituency MoH 751 87709 76 13837 367 28983 218 SSK 118 28517 536 4801 6705 3311 9723 University* 43 24754 - 8586 - 8760 - Private 239 11922 27 8665 37 2870 113
When compared to the rest of the institutions, SSK hospitals served for the maximum number of patients with minimum level of endowments before the reform. Obviously, in SSK hospitals, this would decrease the quality of health care and hence increase the inequality among patients treated. Thus, a successful reform attempt should be the one that could shift excess demand on SSK hospitals towards MoH and private hospitals in order to create more egalitarian health care delivery system. According to table 2.1.1., over the period of five years however, with a rather increased burden on SSK, coverage have expanded by about %10 both with respect to ratio of insured population and with respect to ratio of insured population covered by health services. However, the broadened coverage of the social security system
*Note that since university hospitals operate under the rule of MoH, to obtain per constituency rates for MoH hospitals, the number of beds, specialists and practitioners in university hospitals are added to those of MoH. So, there is no need to calculate per constituency rates for university hospitals, separately.
10
has been achieved at the expense of ever growing deficits of all social security institutions even since the early 1990s. These deficits have required increasingly large transfers from the general government budget, prompting several reform attempts. The cumulative value of these deficits between 1994 and 2004, plus their debt servicing cost (based on the Treasury bill rate), was 475 billion YTL (about €200 billion) in 2004 prices, or approximately 110% of the 2004 GDP and 1.5 times the total consolidated debt stock as at the end of 2004. Indeed, the unsustainable social security system deserved a large part of the blame for Turkey‟s fiscal imbalances over the past decade.
11 2.2. Transition Period
At the beginning of the year 2003, the government of Turkey has been in the process of designing a comprehensive reform of its social security system. The proposed reform has four basic components: (i) a pension reform aimed at unifying the currently disperse system and to increase the pension age to reduce the deficit of pension payments to revenues; (ii) introduction of Universal Health Insurance complemented with health sector reform; (iii) establishment of high quality, fair, protective, egalitarian and curative health care service for the whole population; and (iv) an institutional reform with the establishment of a unified social security institution.
Health sector reform has been an important and integral part of the social security reform since the rather dispersed and fragmented nature of the social security system also resulted in provision of health services in a rather dispersed manner such that each social security organization operating its own hospitals. Although the majority of the population was covered by the existing system, this partitioned structure of Turkish health system led to ineffective hospitals, low quality treatment and unequal access to health care services.
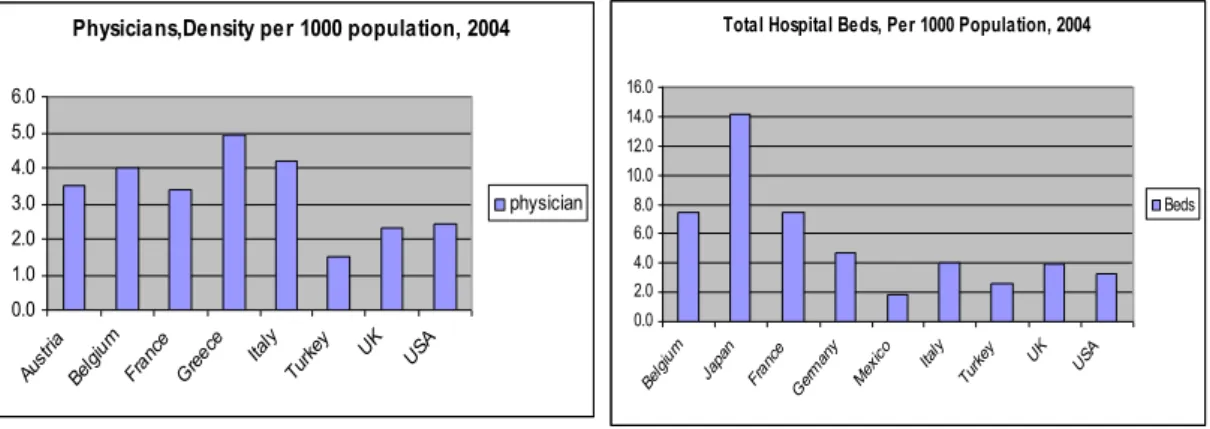
The weaknesses of the existing system could be better understood when basic health indicators of Turkey are compared to those of OECD countries. For instance, although the health expenditure has a large share in government's general budget (%4.3), total expenditure on health as a percentage of GDP is just 6 percent in Turkey, in 2003 whereas 15.1 in USA and 10.9 in France. Moreover, figure 2.2.1. shows that, in 2004, number of total hospital beds per 1000 population in Turkey is 2.6 whereas 14.2 in Japan and 7.5 in France and Belgium and physician density per 1000 population is 1.5 in 2004, in Turkey but 4.9 in Greece.
12
Figure 2.2.1. Hospital Beds and Physician Density per 1000 Population in Selected OECD Countries
Hence, in the light of those problems, in December 2003, with the support of IMF and EU, the government of Turkey declared a reform program called “Transformation in Health”. The motto of the reform was “Health for everyone” and the aim was to restructure, both functionally and administratively, MoH, cover all citizens by general health insurance, give autonomy to hospitals; attract the private investment into the health sector; distribute health personnel and facilities equally among regions and provide effective, accessible, egalitarian and high quality health care system that unifies all social insurance organizations under one roof. The main principles of the reform that were in line with both „Health for All in 21st Century‟ Policy of the WHO and „Accession Partnership‟ document prepared by the EU, were stated as human centrism, sustainability, continuous quality improvement, participation, division of power, decentralization and competition in service. (MoH, 2004: 70).
The reform process has been implemented gradually. First of all, as a result of the protocol signed between MoH and the Ministry of Finance in April 2003, civil servants are allowed to benefit from private health institutions. This reduced the
Physicians,Density per 1000 population, 2004
0.0 1.0 2.0 3.0 4.0 5.0 6.0 Aust ria Belg ium Fran ce Greec e Italy Turk ey UK USA physician
Total Hospital Beds, Per 1000 Population, 2004
0.0 2.0 4.0 6.0 8.0 10.0 12.0 14.0 16.0 Belg ium Japa n Fran ce Ger man y Mex ico Italy Turk ey UK USA Beds
13
excess burden on public hospitals without incurring any cost and enabled patients to save waiting time. This attempt could be considered as a first step towards unification of all social security institutions under a single umbrella.
As a second step, in July 2003, MoH, Ministry of Labor and Social Security and the Ministry of Finance signed a collective utilization protocol that enabled the members of BK, ES, active public employees and green card holders to benefit from SSK hospitals, and that enabled members of SSK to benefit from MoH (public) hospitals. The execution date of the protocol throughout Turkey was January 2004. With this attempt, the objective was to establish a common delivery and convergence in services of BK, ES and SSK which would enable equal access to health services, providing high quality treatment to patients and preventing patients to suffer from overcrowded hospitals.
As a third and final step, in Feb 2005, with law no 5502, ownership of all SSK hospitals are transferred to the MoH. Hence, with this final step unification process of the reform has been completed. Thus, all security institutions are united under the name of SGK (Sosyal Güvenlik Kurumu-Social Security Institution). In the current structure of health system all patients are covered by SGK and all patients could benefit from either MoH (public) hospitals, YOK (university hospitals) or private hospitals, operating under the administration of MoH. This initiated a new era in Turkish health system while the reform and transformation processes have not been completed yet.
14
CHAPTER 3
LITERATURE SURVEY
Next sub section, summarizes the existing literature on DEA technique, and the following sub section summarizes the literature on Malmquist Productivity Index.
3.1. Data Envelopment Analysis (DEA)
DEA is the optimization method of mathematical programming. DEA is based on the piecewise linear convex hull approach to frontier estimation and is first proposed by Farrell (1957). DEA basically uses linear programming methods to construct a non-parametric frontier over the data set and derives efficiency measures that are calculated relative to this frontier.
Two decades following the Farrell's paper, Shephard (1970) suggested the use of mathematical programming methods that could not receive much attention in the literature until the path breaking paper of Charnes, Cooper, and Rhodes (1978) in which the term DEA was first used. Since then, the method has become very popular in the literature. In their pioneering study, they developed an input orientated model with constant returns to scale (CRS) technology to measure relative efficiencies of decision making units. Their idea was extended further through the applied studies of
15
Fare, Grosskopf and Logan (1983) and Banker, Charnes and Cooper (1984) in which variable returns to scale (VRS) technology is assumed.
Following those pioneering theoretical studies, great number of empirical studies has emerged. The first use of electronic computers to deal with linear programming problems was by Charnes, Cooper and Mellon (1952). In their study, they explained linear programming techniques in the context of a commercial application, namely blending aviation gasolines.
Since 1978 paper of Charnes, Cooper, and Rhodes, thousands of uses of DEA have appeared in the literature to measure efficiency in various sectors. Up to now, the DEA has been used to evaluate and compare the performances of educational departments (schools, colleges and universities), health care (hospitals, clinics) prisons, agricultural production, banking, armed forces, sports, market research, transportation, courts, benchmarking, index number construction which finally lead to the Malmquist index and many other applications. Moreover, subsequent papers has extended the use of DEA to cover dummy or categorical variables, discretionary and non-discretionary variables, incorporating value judgments, longitudinal analysis, weight restrictions, and stochastic DEA. Since there are more than thousand of empirical papers employing DEA technique, this chapter will focus on its empirical applications on the health care.
Since DEA is a non-parametric technique in its original form, it lacked statistical properties. Opponents claim that DEA efficiency estimators that come from some random data generating process are non-statistical and statistical noise caused by DEA estimators would introduce bias to estimated efficiencies. However, to remove those anomalies inherent in DEA estimators, in their challenging studies Simar and Wilson (1993, 1998, 2000b, 2005) developed various measures based on the idea of
16
bootstrapping proposed by Efron (1979) originally. Moreover, Wilson (2008) developed a distinguished software package called Frontier Efficiency Analysis with
R (FEAR) that incorporates the idea of bootstrapping to compute not only DEA
estimates of technical, allocative and overall efficiency while assuming either variable, non-increasing or CRS but also Malmquist indices and scale efficiency measures.
All of those developments in the DEA literature attract many researchers from various fields of study and this made DEA a highly credited technique among the other alternatives in measuring the efficiency of decision making units. Increasing costs and growing demands for health care services in most of the countries raised the public concern on measuring the performance of health care providers which finally became a controversial topic debated within a great body of literature nowadays. Several econometric methods are suggested and various performance indicators are developed for performance assessment. Some of those studies employ DEA which is a very popular technique in the literature currently whereas others prefer to use different econometric approaches. Yet, studies carried out in this field are still open to improvement.
Amado and Dyson (2006) provide a detailed literature review and evaluates and compares the advantages and drawbacks of the methods used to measure the performance of primary care providers in UK. The paper, first classifies the empirical studies according to the technique used to measure performance: the ones that use Stochastic Frontier Analysis (SFA) which assumes a particular functional form for the production function and hence considered to be a parametric approach and the ones that use DEA, and then concludes that DEA has certain advantages over SFA. The study points out that if the specific functional form chosen for the stochastic
17
production frontier does not represent the actual technology of primary care providers, the specification bias may lead to misleading efficiency measurements. On the contrary, since DEA involves the use of linear programming methods to construct a non-parametric piece-wise frontier over the data, efficiency measures that are calculated relative to this frontier will not carry a specification bias and hence will be more accurate. Hence, the paper claims that DEA could be considered as a challenging alternative to the existing methods.
Puenpatom and Rosenman (2008) are concerned with the impact of Universal Health Coverage reform in Thailand on the efficiency of health care providers. They measure the efficiency before and during the transition period by using a two-stage DEA which involves bootstrapping and truncated regressions, proposed by Simar and Wilson (2005). Input orientated model with VRS technology is assumed. In the first stage of the analysis, efficiency scores are estimated and in the second stage non-parametric, bootstrapped estimates of efficiency scores are regressed on variables that are not considered in the first stage to account for exogenous factors that might affect hospitals' performance. Their sample consists of 92 Thai public hospitals (both regional and general) observed during the period 1999-2002. In the model, inputs are defined as the number of beds, physicians, nurses, dentists and pharmacists and other personnel and outputs are defined as the adjusted number of inpatient visits in acute surgical, in primary care and in others (where adjusted inpatient number refers to the ratio of large surgeries to total surgeries times the number of inpatients in related department). Their results suggest that transformation to new health system led to an improvement in large public hospitals' efficiency, particularly in the regional ones, and that the extent of efficiency improvement differ across regions in proportion to their wealth level. Moreover, as the number of referrals from other hospitals to public
18
hospitals increased, efficiency of both regional and general public hospitals improve. Another study to assess the performance of hospitals is proposed by Staat (2006). In his paper, he measures the performances of hospitals in Germany based on a 1994 data by using DEA-bootstrap approach which is credited by many authors in this literature based on Simar and Wilson (1998, 2000) work. Inputs are defined as per diem rate and number of beds and outputs are defined as number of cases treated per year and reciprocal of the length of stay. He, then groups hospitals according to their respective sizes. The results of the study show that significant productivity differences exist between nearly identical hospitals and that as a result of employing bootstrapping technique which provides bias-corrected results, hospitals which are indicated as inefficient by DEA studies done so far, are actually more inefficient than they are thought to be.
Rebba and Rizzi (2006) have also compared efficiency differentials between public and private health providers in Italy using DEA approach on a data set that is composed of 85 (public and private) hospitals. As an extension to the previous studies they put specific constraints on both input and output weights. Their results reveal that, low efficiency scores, especially for public hospitals, are attributable to external factors, which are not fully controlled by the hospital management and are mainly explained by past policy-makers‟ decisions. According to their results, non-profit private hospitals exhibit a higher total inefficiency while both non-non-profit and for-profit hospitals are characterized by higher levels of scale inefficiency than public ones.
Steinmann et. al. (2004) using DEA approach, measure and compare the performances of German and Swiss hospitals by using expenses (of academic, nursing and administrative staff), patient days and number of beds as inputs; and
19
number of cases treated (medical, pediatric, surgical, intensive) as outputs. Their study concludes that German hospitals are clearly more efficient than their Swiss counterparts and are larger in scale and size.
More currently, Bernet et al. (2008), conduct a study on efficiencies in Ukrainian polyclinics to see whether recent elections lower the efficiencies of polyclinics in eastern regions using two stage DEA procedure. However, they find that polyclinics in western Ukraine are less efficient. Possible explanations of this result are also discussed in the paper.
In addition to those studies discussed so far, Rosenman and Friesner (2004) and Kirkham and Boussabaine (2005) also studied the measurement of hospital performance based on DEA approach for USA and UK, respectively.
Apart from those, Farsi (2008) studied the temporal variation of cost efficiency in Switzerland's general hospitals by employing mixed effects model rather than DEA. The financial data used in the analysis is of 168 hospitals over the period 1998-2003. The paper constructs a cost frontier. In the model, output of any hospital is measured by the number of hospitalizations obtained through multiplying total admissions by an average cost weight calculated every year for each hospital and an amount of ambulatory services offered by the hospital. Two inputs that are considered are capital and labor and hence their prices are used as right hand side variables in the cost function. The paper concludes that there exists an increasing trend in hospitals' operating costs and the basic factor that determines hospital efficiency is the number of empty beds which indicate the existing unused capacity.
20 3.2. Malmquist Productivity Index
The Malmquist productivity index is used to measure and compare the productivity growth of different producing units from one period to another. Measurement is based on constructing best practice frontiers for adjacent years by using data on inputs and outputs of all producing units in the sample and then computing the output growth that is caused by shift of the frontier for each individual producing unit. What distinguishes Malmquist index from the other alternative productivity indices such as Törnquist and Fischer is that (since it is composed of distance functions) it does not require any information on prices to calculate the productivity. That is, Malmquist index is based only on quantity data and does not make any assumption on the functional form for the technology employed. Hence, Malmquist index is considered as superior to alternative indices, particularly in cases when researcher does not have any information regarding prices.
Another advantage of Malmquist index is that since it can be decomposed into two components, one which measures changes in technical efficiency (i.e. whether firms are getting closer to the production frontier over time), and one which measures changes in technology (i.e. whether the production frontier is moving outwards over time), it can provide additional insights (Bradley, 2006: 1).
Malmquist index is named after Stan Malmquist's (1953) study. The path breaking paper that was proposed by Caves et al. (1982) redefined the index as a ratio of distance functions and later, Fare et al. (1989b) showed how this index could be calculated by using non parametric linear programming methods. As a result of those successful attempts, the index has gained popularity in applied studies Based on those papers, Caves et al. (1982a, 1982b) showed how Malmquist index could be decomposed into two as efficiency change and technical change. Ray and Desli
21
(1997) has further decomposed Malmquist index as technical change, efficiency change and scale efficiency change. More recently, based on the inverse relationship between output distance functions and output oriented technical efficiency measures, Fare et al. (1995) proposed a method to calculate the Malmquist index relative to non parametric frontier (Borger and Kerstens, 2000: 303).
Those successful theoretical studies are followed by large number of applied studies in various fields. Up to now, Malmquist index has been applied to public sector, agriculture, banking, electric utilities, transportation, insurance companies, agriculture and countries to measure productivity.
In the literature, Malmquist index has been widely used in measuring the productivity of banking sector. In this field, the first attempt came from Berg, Forsund et al. (1992). They searched for the impacts of deregulation on the productivity of the Norwegian banks throughout 1980's. The results indicate that while the banking sector experienced a deterioration during the first years of deregulation, an improvement is observed in the following years.
Fare et al. (1994b) study the productivity growth in 17 OECD countries over the period 1979-1988 by using decomposed Malmquist productivity index obtained through nonparametric programming methods. They found that over the average productivity growth in USA is due to the technical change whereas Productivity growth in Japan which is highest in the sample, could largely be attributed to the efficiency change.
Forsund and Kittelsen (1994), applied the Malmquist index and its components to measure productivity developments in Norwegian electricity distribution utilities over the period of 1983-1989. They found that in the sector on average, there exists %2 overall productivity growth which is mainly due to the frontier technology shift.
22
Taskin and Zaim (1997) have also significant studies on the application of Malmquist index on comparing the performances of public and private manufacturing industries of Turkey over the period of 1974-1991 and on comparison of productivities of high and low income countries. They find that overall productivity growth of private sector is higher than that of public sector and decomposition of Malmquist index shows that although both sectors experience similar technological progresses, public sector suffers from efficiency loss hence reducing its overall productivity growth. In comparing the high and low income countries to test catching-up hypothesis, they employ Malmquist index obtained by nonparametric programming methods. The results indicate that the countries with low initial per capita income levels catch up at a faster rate whereas countries that have relatively high income depend more on technological progress for productivity increases.
Application of Malmquist index into the health sector has become a popular research field currently. One of the initial studies in the literature was Hollingsworth et al. (1998). They use DEA and Malmquist index in performance assessment and they find that public sector hospitals perform better than private ones in USA and in EU. Roos (1997) investigate the measurement of productivity in hospital services with concentrating on eye surgeries by using Malmquist index in Sweden and discuss the alternative methods on the measurement of productivity. The paper suggests that the use of Malmquist index approach is very appropriate in cases where the service provided is complex and where it is hard to collect data on quality of the health care, health status, number of patients or visits. Their results indicate that from 1980 to 1996, overall productivity of eye surgery had increased by %25 per year.
Giuffrida (1999) proposed a study to investigate the impacts of National Health System introduced in UK in 1990. The study covers the period of 1990/91-1994/95.
23
Analysis is based on the Malmquist index obtained using DEA methods and decomposition of Malmquist index into its components as pure technical efficiency, scale efficiency and technological change. The results show that over the period of study, there exists small amount of productivity improvement which largely stems from the pure technical and scale efficiency improvements rather than technological and there is very limited scope for productivity gains in this sector.
In education sector, Bradley et al. (2006) used DEA based Malmquist index approach to measure the productivity of Further Education providers in England. They have 500 observations over the period of 1999-2003. Their results show that the mean provider efficiency varies between 82% and 86% over the period. Productivity change over the period is nearly 17%, and this is comprised of 10% technology change and 7% technical efficiency change.
24
CHAPTER 4
METHODOLOGY
This chapter describes the methodology used in this paper to measure hospital efficiency and productivity. The first sub section is devoted to present the DEA technique. The following sub section presents the methodology underlying bootstrapping technique. Finally the last sub section explains how Malmquist index is derived by using those methodologies.
4.1. DEA Technique
This brief section on DEA estimation starts with some basic definitions and notation used in the DEA literature. In a simple production technology, there exist two main variables, namely inputs and outputs. On this basis, a multi-input and multi-output production technology involving N number of inputs and M outputs could be defined as follows:
(4.1.1) T
( , )x y RM N : x can produce y
where x(x1,...,xN)RN represents vector of inputs and y(y1,...,yM)RM
25 inputs and outputs such that x can produce y.
Production technology could equivalently be represented by output set (also known as production possibility set) which is defined as:
(4.1.2) P(x)
yRM : (x,y)T
Output set is assumed to satisfy: Strong disposability of outputs (and of inputs) if y*P(x) and y y* yP(x)
Possibility of inaction (i.e. nothing can be produced from given set of inputs) )
( 0P x
Non zero output levels cannot be produced from zero levels of inputs P(0)
0 P(x) is compact (i.e. closed and bounded) That‟s, given finite amount of inputs, only finite amount of outputs could be produced.
P(x) is convex
if y1,y2P(x) then
y1(1)y2
P(x)where
0,1In other words, if two combinations of output levels can be produced with a given input vector x, then any weighted average of these output vectors can also be produced.
Given the notation presented above, we now move on the definition of output (input) distance function which is very useful tool in describing the technology in such a way that it enables us to measure efficiency and productivity in a reliable manner. Distance function is simply based on radial contractions and expansions. Malmquist (1953) and Shephard (1953) introduced this notion, independently in their own studies. The advantage of using distance functions is that it allows to define multi input and multi output production technology without the need to specify a
26
behavioral objective such as cost minimization or profit maximization (Coelli et al., 2005: 47). A researcher could either use input or output distance functions depending on the objective of the analysis. Particularly, input distance function concentrates on the idea of minimal proportional contraction of the input vector, given the output vector whereas output distance function concentrates on the idea of maximal proportional expansion of the output vector, given the input vector. Since input and output distance functions are analogous, in this chapter only the output distance function is defined. Hence, given the input vector, one can define the output distance function as follows:
(4.1.3) DO(x,y)min
:(y )P(x)
where 0DO(x,y)1. The basic properties of output distance function that follow from the assumptions on output set P(x)discussed above are*:
DO(x,0)0for all non negative x
Non decreasing in y and non increasing in x Linearly homogenous in y
Quasi-convex in x and convex in y
To illustrate the idea of output distance function, see the figure 4.1.1. below:
*
27
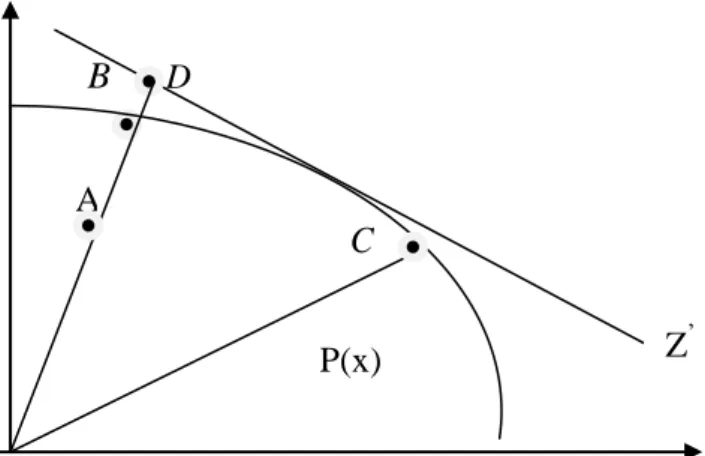
Figure 4.1.1. Production Possibility Set and Output Distance Function
B D
C
To illustrate, in Figure 4.1.1. there are three firms (i.e. observations) each using one unit of input to produce two different outputs, y and 1 y . Given the production 2
possibility set which is the area bounded by production possibility frontier and axes, the value of the output distance function for firm A equals to the ratio OAOB. In this setting, firm B constitutes the reference technology for firm A. By using one unit of input, firm B can produce more than firm A. Thus, given the input, firm A is inefficient by an amount of
.
In other words, to become efficient firm A should proportionally expand its production of both outputs by a fraction of 1 and it can still remain within the production possibility frontier. Thus, the value of distance function is the reciprocal of the factor by which the production of all output quantities could be increased while still remaining in the production possibility set. Moreover, since firms B and C are on the boundary of the set, they are the benchmark firms and the value of their distance functions equal to 1 which implies that those are fully efficient firms.Now we are equipped with enough tools to describe and measure the efficiency concept. The following discussion begins with Farrell‟s (1957) ideas of input and
Z y2 Z‟ A P(x) y 1 0
28
output oriented technical efficiency measures*. On this basis, Farrell first decomposes overall economic efficiency as technical efficiency and allocative efficiency and then he further decomposes technical efficiency as scale efficiency and pure technical efficiency. To illustrate the idea, again refer to the figure 4.1.1. If we have information on prices, then we can draw the iso revenue line ZZ‟, and define the Farrell‟s measure of allocative efficiency as OD OBi.e. the ratio of maximum feasible revenue to the revenue earned at the reference technology. Similarly, Farrell defines output oriented technical efficiency as OB OA i.e. the ratio of maximum potential output (at B) to actual or observed output (at A). Finally, overall measure of output efficiency which is sometimes referred as revenue measure of output efficiency is defined as OD OA. Now, it is easy to see the relationship between allocative, technical and overall efficiency:
) ( ) (OD OB OB OA OA OD In other words,
Overall Efficiency = Allocative Efficiency Technical Efficiency
More particularly, output oriented technical efficiency measure basically deals with how much outputs could be proportionally expanded without changing the input quantities used. In other words:
(4.1.4) FO(x,y)max
:yP(x)
which is called as Farrell Output Oriented Measure of Technical Efficiency.
At this stage, it is important to notice the inverse relationship between output distance function DO(x,y)and Farrell output oriented technical efficiency measure
*
Although there exists input and output oriented technical efficiency measures, this section only provides the discussion on output oriented measures. Note that they are equivalent measures only if CRS technology exists. For further discussion on this, see Fare and Lovell (1978).
29 )
, (x y
FO . Formally, equations (4.1.3) and (4.1.4) together imply that: (4.1.5) FO(x,y)(DO(x,y))1 1
So, FO(x,y)1 that directly follows from the 0DO(x,y)1. Hence, unlike output distance function, the value of Farrell output oriented technical efficiency measure which is equal to 1 indicates a fully efficient firm whereas a value above 1 indicates an inefficient firm by an amount above 1.
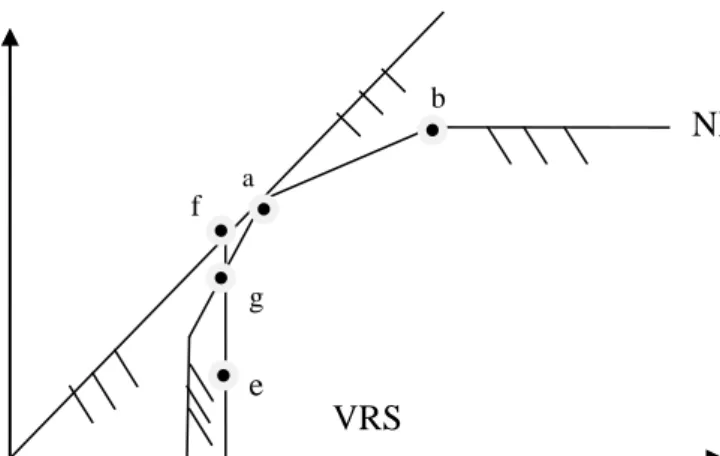
Choice of appropriate measure to calculate the efficiency is not the end of the story. Since it is possible to have firms that are efficient both technically and allocatively but that are not operating at an optimal scale, one should also be careful in choosing the appropriate returns to scale technology that will be applied to the analysis. Efficiency could either be estimated assuming CRS, VRS or non increasing returns to scale (NIRS) technology. However, the CRS assumption holds when all firms are operating at an optimal scale, but this becomes very unrealistic when imperfect competition, government regulations, constraints on finance etc. are considered. Moreover, when not all firms are operating at an optimal scale, assuming CRS, results in technical efficiency measures confounded by scale efficiencies (Coelli et al., 2005: 172). Hence, in such cases, it would be more appropriate to assume VRS yielding technical efficiency estimates that are free of scale efficiency effects. Another advantage of VRS specification is that this approach forms a convex hull of intersecting planes that envelope the data points more closely than the CRS and NIRS conical hull. To see this, consider the figure 4.1.2. in which one input (x) and one output (y) production technology is depicted with respect to the CRS, NIRS and VRS assumptions:
30
Figure 4.1.2. CRS, NIRS and VRS Frontiers and Scale Efficiency Mesurement
As it can be inferred from the figure, under CRS technology, proportional changes in outputs require proportional changes in inputs, whereas under NIRS technology, to scale up outputs, inputs should be scaled up by a larger amount. In figure 4.1.2. CRS technology is bounded by the x-axis and the ray trough point a. NIRS that does not allow for outward scaling but that allows for convex combinations of existing observations and the origin is bounded by the line segments Oa, ab, the horizontal extension from b , and the x -axis. Finally, VRS that allows only convex
combinations of existing observations, is bounded by the x -axis starting from point c , and the line segments ca,aband the horizontal line emanating from point b . On
this basis, according to Figure 4.1.2, Farrell output oriented technical efficiency score relative to CRS technology equals FOCRS df de whereas efficiency score relative to VRS technology equals FOVRS dg de. Thus, scale efficiency is given by
dg df
SE . Therefore, it can be concluded that: (4.1.6.) SE FOCRS FOVRS
which measures the deviations from CRS technology in the output direction. CRS NIRS VRS x y 0 a b c d e f g
31
Thus, an observation is said to be scale efficient if SE 1(i.e. VRS O CRS
O F
F ). And
scale inefficient, if SE1, by an amount above 1.
So far, required notation and theory underlying the DEA technique is discussed. Now, we are ready to formulate the DEA model that is used in this paper. Throughout the analysis, VRS technology is assumed because of the reasons explained above. Assume that there exist k 1,...Kobservations in the sample. Hence, given our data set and assumptions on output set presented so far, for VRS specification, an output set that holds for every period and for all observations can be constructed in the following way: (4.1.7) m K k km k M y y z R y x P
1 : ) ( m1,...M kn n K k kx x z
1 n1,...Nzk 0
k 1,...K
z K k k 1 1 where zk 's stand for the intensity variables (weights) assigned to each observation while constructing the production set. Thus, given the production set and constraints specified above, the linear programming problem solved by DEA (i.e. output oriented VRS DEA model) for each k, would be as follows:
It is the direct consequence of strong disposability of outputs. For a detailed discussion see Fare and Grosskopf (1998-2000).
Convexity constraint that imposes the VRS assumption . It ensures that an inefficient firm is only
benchmarked against firms of a similar size. That‟s, the projected point for that firm on the DEA frontier is a convex combination of observed firms.
32 (4.1.8) m K k km k z O k F x y z y y
1 , * : max ) , ( m1,...M kn n K k kx x z
1n1,...N
zk 0
k 1,...K
z K k k 1 1where 1 ≤ θ ≤ ∞. Note that, θ*
is the feasible proportional increase in outputs that could be achieved by the kth observation, if the given inputs were used efficiently. So, this linear programming problem should be solved for each observation in the sample, separately. Hospitals efficiencies are evaluated in terms of theirFO(x,y) scores. Hence, smaller the FO(x,y) , the better the performance of that hospital.
4.2. Bootstrapping
In the literature, it is argued that the efficiency estimates obtained from the DEA procedure described in the previous section would be biased upwards. In the context of DEA, since the best practice frontier is constructed on the basis of the sample in hand, the results would become very sensitive to sample selection. In such cases, bias arises when there exist efficient firms (i.e. hospitals) that are not contained in the sample. Thus, the observed efficiency scores of inefficient firms calculated on the basis of what is observed is an upward biased estimate of their true efficiency (Staat, 2006: 2259). Since the possibility of having unobserved but efficient firms is very high, the original efficiency scores obtained from DEA procedure would be biased. Up to now, to overcome this bias, various measures are developed by several authors such as Banker (1993), Korostelev et. al. (1995) and Kneip et.al. (1998).
33
More recently, in their 1998 and 2000 papers, for multi-input and multi-output model, Simar and Wilson suggested the use of bootstrapping technique which was originally developed by Efron (1979) to analyze the sensitivity of the efficiency measures to sampling variations* and to correct the bias of DEA estimators. This influential work, made bootstrapping highly credited technique that is used to obtain bias corrected efficiency scores.
To begin with, suppose a data generating process (DGP), generating a random
sample of:
(4.2.1.) S
(xk,yk):k 1,...K
By some method M, this sample defines estimators of T and P(x) discussed in the previous section, namely TˆandP(ˆx). Given those, for kth observation, the output oriented technical efficiency score at point
x ,k yk
can be calculated as follows: (4.2.2) ˆk max
:yP(ˆx)
which is the estimator of the true but unobserved population efficiency score k. The
problem is that sampling distributions of TˆandP(ˆx) could not be inferred because is unknown and the complexity of M makes it almost impossible to determine it. However, bootstrapping technique which is based on the idea that there exists a consistent estimator of , namely ˆ, enables us to obtain consistent estimators of T and P(x), even though is unknown.
Now, suppose that, given the sample S, by using our knowledge, we can produce a consistent estimator of namely, ˆ. Then, consider another sample S* which is generated by ˆ through random resamplings with replacement from S.
*