о I İM s S' T й T ’ Й II ·ϊ·.ί· t f! ■■tjt ί 6 Ш 1· ΐΐ i ΐ·ί ^ ¿ ÿ it Ш η wr L У
î.. 'TV'· Τ'iî* ':· Ci^, a 'Í v-tifcWv'i.to·'
^ iy I T'T ^ P "f Q X H P ■ P £ P f ^ ‘f ¡'•^•EîT ï T' OF £ I ‘Γ ï ^
^irry-' W ^ U Ч Ѵі>ѵЧ4Ч'П(^ fiV if 4 *Цр^
AUTOMATIC SPEECH SEGMENTATION BASED ON
SUBBAND DECOMPOSITION
A THESIS
SUBMITTED TO THE DEPARTMENT OF ELECTRICAL AND ELECTRONICS
ENGINEERING
AND THE INSTITUTE OF ENGINEERING AND SCIENCES
OF BILKENT UNIVERSITY
IN PARTIAL FULFILLMENT OF THE REQUIREMENTS
FOR THE DEGREE OF
MASTER OF SCIENCE
By
Argin Bozkurt
T V
^ гг?
I certify th a t 1 liave read this thesis and th a t in ray opinion it is fully ade(|uatc
ill sc.()|)e and in quality, as a thesis for the degree of Master of Sci('iir(\
Vvo
Prof. Dr. Ellis Çetiıı(,Supervisor)
I ( (sl iFy tliat I. have read I.Ins thesis and tliat in iny’ opinion it is rnlly a,d('(|iia(,('
in sco|)e a.nd in quality', a.s a thesis tor the degree of Mast(n· of Sci('ncc\
Assist. Prof. Dr. Orhan Arikan
I rc'rtify that I have read this thesis and that in my opinion it is fully adc-qiiate,
ill scope and in quality, as a. thesis for the degree of Master of Sch'inx'.
Approved for the Institute of Engineering and Sciences:
Prof. Dr. Mehniet l^ w y
To B ilge A y din . . .
looking forward to our Go gam e :)
ABSTRACT
SUBBAND DECOMPOSITION
Arçın Bozkiirt
M.S. in Electrical and Electronics Engine(n-ing
Supervisor: Prof. Dr. Enis Çetin
Janııaıy 1999
S|)('('di segiiientation refers to the problem of cleteiMiiiuiiig tlu' boimdai-ies of the phones in the speech signal. The proposed algoritlirn pa.ssc's the sp('eeh signal throngli a. spi'dally designed filter bank and calculates the lag-one autocorrc'laXion of the oiit|)ut of each, filter. The filters are designed using subband decoinposition which ('iiables us to sii|)|)ress iidbrniation from the noise contaminated fr(V|uency bands. TIk' iiltc'rs are ba.ndpa.ss filters a.nd every filter adds a new .Frequency l)and to tlu' analysis. 1ji the
^Mid th(' (nitii‘(' Frequency band is covered. A distortion measure is ns('d l,o (|nantify tlu' d('\’ia(.ions in the correlation structure. The distortion measure Foi· tlu' time instant / is ra.|eida.(.(vl using the autocorrelation values oF two Frames oF sp('edi signal which ar(' on ('iUi(u· sid(' of ti.me /:, such that, half of tlie Frames overlap. /\ symmetrized Knllba.c'k- b('ib('r type' measure is used to (|iuuitiFy the dissimilarity oF (Jie a.ntocorre'lalion values obtained From these frames. The peaks in the trajectory oF distortion measure' values, give' ns the loe.-.ations of the phone boundaries. The propose'd alge)i-itlm.i is te'ste'el iinele'i' e’.ar neuse'. The |)lK)nes determined with the se^gmentation algoritimi al)e)ve' are' alse) nseel in a. phone'-baseel re'cognition s^^stemi. Reasonable recognition rate's are e)btaine'd Ibr ve)ie‘ed sounds.
Keyword.^: Spex:xh seigiiieiiitati()n, phone bounda.ry de'te'e’tie)n, mnitirate' pre)C('ssing\ sid)bane| elee-e)mpe)sition, spectral distortion measures, lag-e)iie' aiite)e’e)ri-elatie)ii, e-ai* ne)ise', phe)ne'-base'el reex)gnition.
ÖZET
ALT BANT AYRIŞIMA DAYALI OTOMATİK KONUŞMA
BÖLÜTLEME
Arçın Bozkurt
Elektrik ve Elektronik Mühendisliği Yüksek Lisans
Tez Yöneticisi: Prof. Dr. Enis Çetin
Ocak 1999
Konuşma bölütleme konuşma işaretindeki seslerin sınırlarının belirlenmesi problemine karşılık gelir. Önerilen algoritma konuşma işaretini özel tasarlanan bir süzgeç öbeğinden geçirir ve her süzgeç çıktısının bir ötelemeli özilintisini hesaplar. Süzgeçler, gürültülü frekans kuşaklarındaki bilgiyi bastırabilmemizi sağlayan altbant ayrışım kullanılarak tasarlandı. Tasarlanan bant-geçiren süzgeçlerden her biri, çözümlemeye yeni bir frekans kuşağı ekleyerek, sonuçta tüm frekans bandını kaplarlar. Özilinti yapısındaki değişimleri nicelemek için bir bozunum ölçeği kullanıldı, t zaman anındaki bozunum, t anının çevresinde, yarısı örtüşecek şekilde alınan iki çerçeveden elde edilen özilinti değerleri kul lanılarak hesaplanır. Bu iki çerçeveden elde edilen özilinti değerlerinin farklılığını nicele mek için Kuliback-Leiber tipi bir bozunum ölçüsü kullanıldı. Bozunum değerleri gezin- gesindeki tepeler bize ses sınırlarının yerlerini verir. Önerilen algoritma araba gürültüsü ile denendi. Bölütleme algoritmasıyla belirlenen sesler, sese dayalı konuşma tanıma sis teminde kullanıldı. Sesliler için makul tanıma oranları elde edildi.
Anahtar Kelimeler: Konuşma bölütleme, ses sınırlarını sezme, çoklu hızlı işleme, alt-
band ayrışım, izgel bozunum ölçüsü, bir-ötelemeli özilinti, sıradüzensel tepe sezici, arciba gürültüsü, sese dayalı konuşma tanıma.
ACKNOWLEDGMENTS
illy tliaiik my supervisor Prof. Dr. Puis Çetin tor liis sng^c'stions, guidance and support throughout the development ot this thesis.
I would also like to thank Assist. Prof. Dr. Orhan An kan and Assoc. Prof. Dr. Ir.sadi Aksun, (Jie irieml)ers of iiiy jui\y, for reading and (X)ininenting on tlic' tlu'sis.
Sincere' thanks go to Cîülbin, my officemate and lab partner during tlu' nights of cold l)('eemb('r, Deniz (13.0.), 0 ü n and Tolga for all the good times w(' ha.vc' spend, toge'tlier; ( he lime-hes, elinners in. Table D’hote, the lengthy ^‘ge'yik'’s anel varie)iis erthe'i· e)e4;a.sie)ns W(' have' be'en te)ge-'tlier. I am gratetul to all for their e've'rlasl.ing trie'iielsliip. 'Tlianks te> l).(i. one-e' aga.in for the logistics she has provided. :)
Thanks 1,0 Bilge for helping me during the end of the' (irsl, ye'ar, vvlie'n 1 wa.s (,e'rril)ly in iie'eel of support in continuing iny thesis. W ithout he'r gene'i4)us snp|)e)i't, (,his work we)iilel end without even a start.
Müge' dese'rve^s the right to be .n.ientioned separately Ibi* be'ing with me' lor more' tlian е)пе' [e)iig year, for supporting and motivating me when neex'ssary anel for e;e)ming u|) witli inge'uoiis ideas and short-time plans to ma.ke me work on this tliesis. Ile'r jend'ulne'ss ha.ve aJwa.ys be'en a strong motive to end my times of deejection which is Гге'е|пе'п(, in e'ligine'e'ring e-e)imniini ty.
It is a |)leasure to express my special thanks to inorn and da.d Ibi’ tlieii· sinex'rc' le)ve, siippe)rt a.nd encourageiiient, even though they were a few liimdreel miles away in Izmir. Thank yon (bi· the 7 o ’clock calls. :)
C on ten ts
1 rntroclu ction 1
1.1 SixH'cli S('gmeiitaiioii Algoritliins 2
1.2 S('gnu'ii(,a.tioii l)y Pa,ra.irieti'ic F i l t e r i n g ... I
1.2. L Pa.ramctric l''iltering Based Distortion iV h'asnres... .'3
2 S p e e c h S e g m e n ta tio n U sin g S u b b a n d A n a ly sis 7
2.1 Sul)l)a,11(1 Aludysis Theory 7
2.2 y\ .N('vv Wa.y ol:' l)econi|:)osing the 8f)eeeh Signa.l... 9
2.. '5 t'cvitiirc' Fvxtra.ction I I
2.1 S ( 'g m e n ta .tio n ... 12
2 P e r lb r m a n c e A n a ly s is and S im u la tio n S tu d ie s 14
.'¡.I P<'rroiMua.nc('. A m U ysis... I I
.■).!. I lAud,ors Aihxd.ing P e rlb riu arice... 15
•'{.2 PlioiKi's in a (Jlcxui Specich l()
2.. 2 Characterization of Bounda.rie,s and Segments 18
2.1 Simidation S e t u p ... 18
2.1.1 P('a.k Detciction 20
v i n
3.5 Diilcreut Filter Ba.nk S tru ctu r es... 21
3.() l5-eliinina.r,y Results: S i and S2 VS. P F ... 21
o.G.l Discussion on S I ... 23
3.().2 Discussion on S 2 ... 2(i ;{.()..3 Pcîrlbrrnance of PF Based Segmentation 26 3.7 Px'sults Under Nois}^ E n v ir o n m e n ts... .31
•3.7.1 Car N o i s e ... ;F[ .3.8 EilV'ct ol Some Minor C lu m g es... 38
.3.8.1 In crea sin g //,... 38
.3.8.2 Mel-Scale decomposition instea.d of lineai· scak' dc'composition 38 3.f) l·'ina.l Vku'sion .39 •3.10 Performance Analysis and Discussions 39 •3.10.1 Detailed (Jom pa.rison... 13
4 P h o n e B a se d C o n tin u o u s S p ee c h R e c o g n itio n 46 1.1 System O v e r v ie w ... 47
1.1.1 f'eature E x t r a c t io n ... 47
1.1.2 .Markov Chain VS. Hidden Markov Modcvl... 48
4.1.3 Recognition P r o b le m ... 49
1.2 P I tone-Based Recognition 50
List o f Figures
1.1 Block dia.gram t'oi· param etric filterin g ... i
1.2 f\)le locations of the lit te r s ...
I..'5 hVeciiK'iicy response of the filters corresponding to difh'rent poh' locations 5
2.1 Basic building block 8
2.2 kVeciuency response of the low and high pass filters 9
2.2 l'V('(|iiency domain decomposition 10
2.1 N('w frequency range definition lor tlie filter bank 10
2.0 A system with the downsampling block in the m id d h '... 10 2.() d'lie ('(|iiivalent system with the downsampling block moved to tlu' c'lid 11
2.7 dVce structure used to decompose the speech signal 12
2.8 Block dia.gram for use with the new filter l)ank structmx' 12
2.1 "Kapı” recording 10
.2.2 “h4('sela” recording and the transition d e ta ils ... 17
•2.2 'I'he fra.mes taken to calculate ü t 10
2.1 T'wo liamming windows plotted with 50% overla.|) 10
.
2.0 (¡oi'iect |)hone boundaries of the “mesela” utterance'... 22
■ ).(} I\<'siill,s ()[ tlie iiltei’ bank Ktructiii'e S I lor cloa.ii “uicisc'ia.'’ г<ч'()Г(Пц[>| 24 • Î.7 !)<'(,a.ils ot the results in Fig. 3.()/.oomecl in у a x is ... 25 •h'S Kesnits of the filter bank structure S2 for clean ‘■mesela.” r('eor(liiig 27
•4.!) Dc'tails of the results in Fig. 3 .8 zoomed in ,y a.xis... 28
3.10 ТСЛ |)lot of S I for clean “mesela.” recording... 29
•3.1 I '14 'Л |)lo(, of S2 lor clean “mesela” recording... 29
3.12 КЫ distoi'tion measure results of 14"^ structuix'for ch'aii "nu'sc'la” rc'cording 31
•3.13 Car noise a.dd(;d “mesela.” reco rd in g... .32
3.1 1 Best ix'sults of S I and S2 obtained for ca.r noisc' a.dded “mes('la” ix'cording 33
3.15 FF ba..sed segmentation results for car noise a.dded “nu'sela” r('cording . . 34
3.1 G H.('snlts of the filter ba.nk structure S4 for car noisc' a.dded “m('s(4a.” r('cording 35
3.17 l)('tails of the results in Fig. 3.16zoomed in у a x i s ... 36
• i.bS T ( ! / \ plot of S4 for car noise added “mcrsela” i4 'co id in g ... .'17 3.19 Filtei· bank having mel-scale structure... 38
3.20 An example from a “dokuz” recording 42
4.1 Simple speech recognition .s y s t e m ... 47
List o f Tables
•'{.I l^lioiie l)()iincla.ries of the “mesela” I'ccordiiig 22
2.2 Siimnuiry of the performa,nee of S i for deal) “mesela.” r('eordiiig... 22
2.2 Summary of the performance of S2 for cleaji “mesela” le c o r d iiig ... 26
2.1 Siiinuiary of the p(vrfoririance of PF lor “mesela” r('eordiiig .20
2.5 Summa.ry of the performance of S4 for car iiois(' a,dd('d “iiK'sela.” ı·('coı■diмg 22
2.6 Success R c it e s ... 10
2.7 Dc'ta.iled results on noisy recordings (SNR = 0 dl2) 14
2.x .Aiia.lysis of o m is s io n s ... 45
1.1 Pec.ognitioii R a te s ... 50
C hapter 1
In tro d u ctio n
S|)('(v|i is a. ilii-i'ct, ec\sy and (.|uick way of co n in iu n ica ti()ii Гог lurm aii l.u'ings. Ik'cause
s|)('('cli is (,!)(' m ost natura.l fo rm of hum an (X)inm uiiicati()ii, s|)(X4‘li proc.i'ssing lia.s been OIK' o(‘ tlic' m ost e x c itin g areas of signai processing [1].
SpiX'cli. resea.rcli lias created many teclinicaJ impacts on soc.ic'ty. Voice da.ta can Ix' stored (diiciently with speech coding algorithms. Tliis (acnlitatc's voici' coimminication tliroiigli tli(' internet in applications like video conferencing. (om|)ut(U‘s will in tin' near riitiir(' ibllow linman voice commands via speech recognition teclmology and r(\spond wil.li a natural voice by means oi systems using speech syntİK'sis tecl)ni(|U('s. Tliesi' l-liree dideixud. aix'as, iiamely coding, recognition and synthesis aix' tlu' ma.in ix'si'arcli aix'a.s in tİK' (i('ld of speecli processing.
Speech ix'searcli, therefore, promises to provide a,n effective int('iTa.c(' tor hirman- roiu|)ut('i· (•()iiiniunication. W ith the advance of computıvr l,ecJinology and spec'clı pro- c('ssing, an era of true hum an-com puter interaction is about to İK'giıı [2].
Ill (.his (.İK'sis, we study the problem of speech segmentation in noisy ('iiviromiKuits. TİK' aim is l.o find every hoinogeneous unit in a spoxx.’li signal. TIk'sc' homogiuK'ous or stalioiiary units cormspond to the pliones in the utteranexx lly d('l,('rminiiig transition poiiil.s from one sta.tionary unit to another, we are able to sc'gment the sp('ech into its phoiK's.
In C hapter 2, we review multira.tesubba.nd analysis theory. A ik'w iiltei· bank struc ture' for (Iccoj-nposing the frequency spectrum using subband analysis is proposed for use in spe'ech segmenta.tion.
In (thaptei· we luxisent the results of tire simulation stndie's to analy/x' the- pc'rfor- iuanc(' of the proposed algorithm, '[’he setup used when running the simulations and va.rions crite.|-ia. tliat is used to judge tho' performance'. e>f l.lie- aJge)ritlims a.re' a.Ise) give'ii in this <-ha.pie'i·. Diflerent filter bank structure.'s a.re pro|)e)se'e| alejiig with a. dise'nssie)n and coiupa.i-isenis with e'ach otherr a.nel with an existing algenathni. VC.i'ieens pleets and talde's are' inediidevl to siiiumarize and cla.rify the' performaiiee' of e'ach algen-ithm. Ne)isy r('ce)ielings are' alse) included into the test cases to e)btain a. more' ı·e)l)ust alge)i-itlmi.
In Clia.pte'r 1, we present the application of the alge)ritlim te> a. .s|)e'e'e·h i'e'cognitie)n
( '.e)ne'lusie)n anel discussions are given in (Jha.pter 5.
'I'lie' following sections give an overview of the segmentation algorithms and review some', of the' existing methods used for speech segmentation. Special emphasis is given to th(' |)ai-ame'l.rie· filtering idea. [.5] a.s it forms the skeleton e)f enir se'giue'nl.atie)n a.lge)i-ithin.
1.1
S p e e c h S e g m e n ta tio n A lg o rith m s
V'a.rioiis a.|)|)i4)a.ches for seginenting speech d a ta ha.ve been pi’oposc'd ¡n ritei-aXiiR' [3, 1,() 21] for various a|)plicatioiis. These a.lgorithms can be classihed in(.o dilfei-cuit cat('gories il('p('iidiiig on till' ana.lysis strategic
Ли imIllicit segmentation algorithm decomposes speech signal into s('gments witli- ont using· ('xtra inibiMTiation such as phonetic transcription. TIk'S(' aii' also ralh'd blind aJgorithms [1,11]. These methods rely only on the implicit ih'linition of a sc'gmeiit, vvlrich says th a t within a segment the characteristics ol‘ i\\c acoustic signal stay the same, (ieiierally being statistically based, the nature' of the segmeiite'd units is not dehiK'd in a.dvance. This provides more reliable and speakei* iudepend('iit segmentation. On th(' otlic'r hand, an explicit segmentation algorithm ge'iierally uses phoiu'tic trans(‘rip- tioii of th(' nU,erance and referance templates [12,11]. Some properties oi' implidt. and ('xplicil- si'gmentation algorithms can be found in [0].
л m()(lel-l)a,se(l m ethod assumes a.ri underlying modc'l Foi- tin' sfHH'rlı signal [■■{,22]. Idua.nu'tric models vvliich include AR modeling as a special case' can Ik' c|iii('l. ('ilici('nt, if tİK'v lit the signal well. Autoregressive (LPC) modeling is tlx' most wid('ly nsc'd model lor sp<'ech signals. One dra.wback of LPC models is that, althongli they a.i(' snecessfnl in modi'ling vowels, they are not suitable for nasal sounds, fricative's, <>tc [2:!|. Mode'l free methods can be more a.ccura,te because they a.re based on dii'c'ct ntili/.ation of a.constic. signal or the speech spectrum coupled with a distortion measni'c'. T'lu' ,AR modc'ling [21] assumption lias also been employed as spectral estimators in the calculatİon of spectral disl.ortion measures for s|)ectral change detection [6,7,2Г), 2()j.
'The analysis performed in the segmentation may either lx- IVaiiu' bas('d or sa.mple based. This alfects the ri'solution of the o utput of tlie algoi’ithm. Sample basc'd seg- nH'iil.a.tion, when compared witli block or frame based segmenta.tion, providc's a more a.<( iira.t(' loea.tion of the bouuda.ries of the segments a.nd allows ns to proc('ss shorter Si'g llH'llts.
OiK' of tlie ea.rly metliods is a. statistical approa.cli thal. has bec'n proposi'd in lf)88 [2]. 'The main idea is to model the signal by an AP. rnodi'l and to nsc' tc'st sl.atistics to
'‘se(|ii('i detect •s in the parameters of the model. Spc'diically, it nsr's a gi'iK'ia.Iized likelihood ratio (GLP.) test under the assimi|)tion tha.t the spi'c'ch signa.l is a. pic'cc'wise AH, jirocess driven by white Ga.ussian noise. 'Phis mi'tliod foi' ('xa.mpl·' is a.ii implicit, model based one.
T'Ik' signal is a,ssumed to be described by a. string of liomogeneons units, ('a.cli of which is chara.ct('i'iz('d liy a. statistical model of (,hc form
p
Vn ~ d'iVn-i + { 1· 1)
i= l
wlu're (■„ is uncorrelated zero mean Gaussian so(|uenco with variance representing the 'weitation of (he a.coustic channel. The model is para.met('i-i/,('d by the' vi'cl.or B di-liiK'd bv
Q ‘ = («I, · · · ,а,„ф ‘ ) (1.2)
and (;) is a param eter vector which determines the se.(|uemx' rr„, 'I'lie nu'thod consists of |K'rforming on line detection of clumges in the para.nu'tc'r 0 , i.i'., sl.arl.ing IVom (,fie location of th(' |)reviously detected boundary, 1) detect vvlu'ii a change occui's, and 2) <'sl:ima.(,(' I.Ik' location of the change.
Tli(' (irsl liypotliesiH assumes only one inoclel Cor au ¡ii|)ii(, s(H|iK'nc(' oí Ic'iigUi 'l'lic oUk'i· liypotlieyi.s assuines one rnoclel Ibr Uie daCa l)el,weeii 1 (xj and anol.li('i· mod('l Cor Uie d a ta (rom /,: l,o N, wliere 1 < k < N. Tire deci.yion is l)as('(| on |,Ik' lila'liliood ral.io Ih'I.vvoími (.Ik'.s(' t.vvo hypotheses. A cliangc is detected iC (.lie ral.io is alxrvc' a l.liresliold. ,\C(.<T l.|i(' r.liange is delxrct.ed, tlie location oC (,lie cliange insl.aid. 1 is d('l,ermiii('d as t.lie iiisl.anl. vvliicli iimlves Ukí ratio inaxirnurn.
1.2
S e g m e n ta tio n by P a r a m etric F ilte r in g
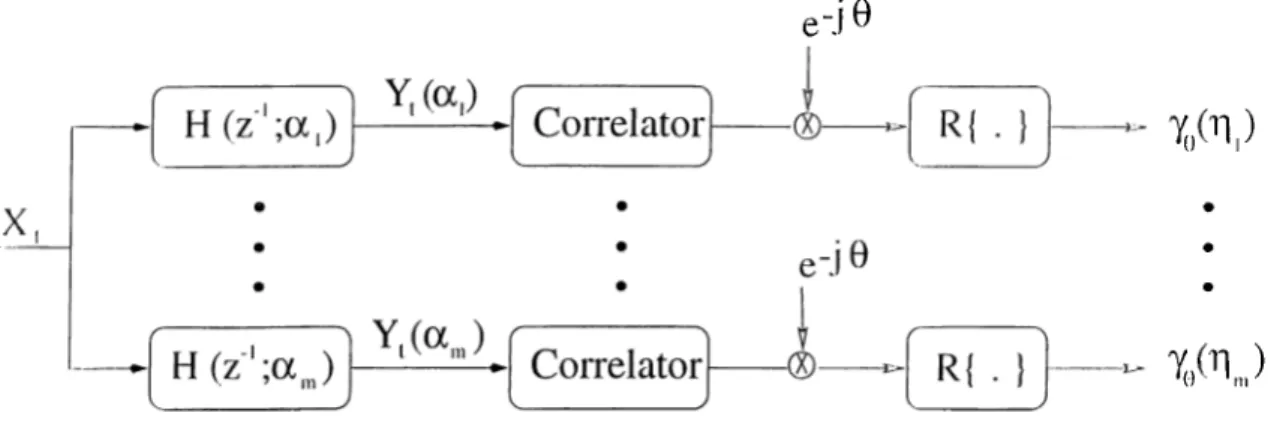
'I'liis iiK'l liod uses a pararnetric filter bank and analyzes Uk' d('modui;r(.ed la.g-one aii- (.oconelaliion oC the filtered speech data to produce a lu'vv charad.c'i'ization Cuiiction of I.Ik' s|)('ecJi sp('cf.rum [4]. Tlu' algorithm is based on a teclini(|U(' calk'd p(vi-(ini(·!vie Jillcr-
iufi [r>]. The diagra.rn of the block which extracts a feature vc'ctoi· from tin' iii|)ii(. signal
A'/ is givc'ii in Fig. 1.1.
y e
is given by
Figure 1.1: Block diagram .ior pcirametric. filtei-iiig
ns now examine the Ibrm of the filters II in the filter bank. Tire filter
H { z - ' - a ) = !. (I.:))
1 — a z '
wIk'ic' O' is the only parameter. This frequency res[)onse corrc'S|)oiids to an HR iiltc'r dc'liiK'd l)y tli(' recursive tim e doma.in relation
'X .‘
F/.(tv) = tvV'/._ı(o') + A/, = ( I· I)
vvlicrc' Л'·,, is |,1ю input, У'^,(а) is the output, and tv = is a. complc'x iuiml)ci· with
|y/| < I and 0 G (—7Г ,7г]. This a.ll-|)o1e (i1t<vi· has only one |)ole a.t = tv.
T Ik' dem odulated lag-one antocorrelation of У],{а) is dcdiiK'd by
10 {ri) = Tl{e- j o f-^'{b.+i(o')y'<(<'v)} (1.5)
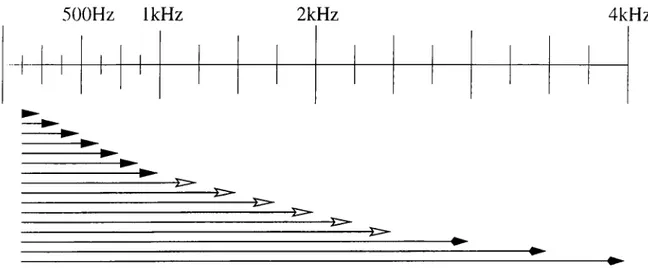
and it is us<'d a.s a new characterization function complementary to the I'ourier spo'ctrum. Ill applications, // is chosen uniformly between (-1,1) and a small positive value is chosen lor 0. TIk' locations of the poles and the fre(|uency response' of I Ik' eorre'sponding (liters ai('give'll in Fig. 1.2 and Fig. ixvspectively.
0.5
0
-0.5
b^’iguix' 1.2: Pole locations of the filters Figure 1.2: 1ччч|11('псу ix'spoiise of tlu' filters cori-espoiKling to difh'ixMil, pole lo cations
2 lie 7fy('//) va.lues obtained from diifcrent time insta.iits can be |)lott(xl on a single ligiii(' vvliicli is called the “Tim e Correlation Analysis Plot’h TIk' int(M-|)r('ta(,ion of this plot is detailed in [27].
1.2.1
P aram etric Filtering B ased D istortion Mecisures
For two fra.mes of speecli signal and X j ‘^ \ lo('>l) have' he'e'ii iise'el to de'rive' distortion MK'a.siii'es th a t ([uantify deviations in the correlation structures of tli(\s(' two iVaim's. TIk' m('a.siii(\s th at have boxm found eifective [28 -30] are the symmc'tri/x'd Knllba.ck-hi'iber type mea.sures K L lo = / ^ К Jn li'H ’l) p f \ v ) + K
T
m dOdij (Ft))M.IKl iiorin i — JÜ 10 (■'/) - lo in) v\pin) p\i\n) I//' dOdi! . i (1.8) In these expressions il is a subset of (-7r,7r) x [ - 1 , 1], and p j/’ and p\p are the normalized dcnsil.y runctions on [?/„.,'/t] C ( —1,1) wliicli is the subset in the // dinunsion. /y;(//) takes
tli(' form
vVin) “ y 11 * ^ d\) \nb)]^{n “ Vh) + + V'll \V'i ) ~ — I )]<^('/ — //a) I ( Id))
wli('i'(' 'ijiHv) cliara.cteriza.tion iunctions obtained I'rom Xj' K VVb.y the first two mea.-snies a.re r('feri-ed as the “synunetrized K L-type measures” ran be explained as follows: Mirst ( liey resc'inble the Kullba.ck-Leiber(KL) spectral div('rgenc-(' [81]
Ok l = r K
— 7T
f i M
/■¿{‘I’) (kiK (1.10)
w'lier«' /i ( a>) a.nd J2İ'U’) a.re the frec|uency response of two signals In'twc'cn vvliicli a. spc'ctral disten tion luc'asnre will be ca.lcula.ted a.nd K{ u) — u — log (/, — I. 'I'lu' r('a.son tlia.t (.l.u'.y are' (■a.ll('(| symmetrized is the fact th a t the nse of the integrant in hc|n. (1.10) twice' with tile' fra.ction inside reversed.
Sinee we use a filter bank in the applications and thei'efore obtain a linite' lumdjer of
noi'l) value's, the discrete versions of tliese rnea.sures are me)i'(' appre)priate for e)ur stueliers. 'I'lie' elise-i-e'(.e' version e)f Kcpi. (1.6) ta.kes the form
Ai'ö.i —
E
^ A:=0 I [Polkin). Poihin) + K p\)lkin) di!i/.:(■'/), 'Ik'IX' (I. id) 7 Î ' ' ( V ı ) - ( - l ) , k = 0 7Î'*(''h^+ı) - k = h · · · ’ 1 )· 1 - liiHnm), k = mThis me'asnre' use's th e I'ange of and the spa.cing betwex'ii the' yo ( / / ) value's. 'I'Ik' elise-i'ete'- time' ve'isie)iis e)f I'leins. (1.7) a.nd (1.8) a.re stra.ightforwa.rel afte'r tlie'se ele'linitie)ns.
C hapter 2
S p eech S egm en tation U sin g
Subband A nalysis
In lliis (•lia.|)iei·, a new feature vector for speecii segmentation is prc'sc'iiti'd. 'I'liis new [('al.nrc' vi'ctor contains the lag-one autocorrelation values ohtaiiK'd IVom I,Ik» suhhand a.nalysis of a IVa.me of speech signal. Subhand a.nalysis has the advan(.ag(' of pi’oviding lobiistness by appropriately de-ernplursizing the iTequency bands th at ar(' known to 1k' <’om ipt('d by noise'.
2.1
S u b b a n d A n a ly sis T h eo ry
TİK' ba.sic l)iiiJ(liiig block of subbancl clecornposition is the iilt(M' bank shown in 1^'ig. 2.1. h'liis s(.rnctnr(' consists ol a. low-pass filter, a high-pass filter and downsampling units. Tii(' pass-bands of the low and higli pciss filters are [0, Tr/2] a.nd [tt/2, tt], rc'spc'ctiv(dy, so that (,he fre(|uency domain is e([ually divided into two bands; nanx'ly, two halfbands. In this stnictiire, the input signal is first filtered by tlu'sc' eomph'iiK'iitary lowpa.ss and high|)a.ss (ilt(M-s. Tlie original signal is therefore decompos(vl into two snbsignals, .so(//.) and S| (//■), carrying low and high frequency contents of the original signa.l, r(\sp('cti vely. Th('S(' snl)signaJs are then passed to downsampling units vvluni' th(\v rli’op ('V('ry other
figure 2.1: Ba,sic l)ui]ding l)lork
d i l l ]
sa.in|)](\
The eiFect of tlie downsampling unit is to s|)read the spectrum of .S(j(·//.) and .s, (//,) over a largx'r portion oF the Freqiu'iicy band and reduce the .sani|)ling I’atc' l)y a Fad,oi· of two. h'liis op('ra.tioii does not cause aliasing because LPF and lil^l·' in Fhg. 2.1 a.ct a.s anti- a.lla.siiig (il(.('rs and Fiinit the signal to half oF tlie Fre(|nency ba.iid b('For(' l\\c d('ciinai,ion. y\Ft(M· th(' d(X‘imation, the spectrum of (k)(n) and d\ {n) covc'r l.lu' entii-(' Frc'(|ii('iicy domain.
t^acli oF tlu'se snbsigiicils can Further be decomposed into two ih'w sid)signals using tlie saiiK' stnic.tiire once again. This procedure can be re|)eal.(v| until the' d(\sir('d IV('f|U('ncy domain (leconiposition is achieved. Suppose we pass a signal through (Jiis structui*(' and obtain two subsigueds. if we once again apply the same decomposition to t.lu' subsignals w(' oblia.iiK'd at the end of the previous step, we get four subsignals with a (piaii.er oF tlu' l(uigt.h oF th(' original signal and frequency contents [0, tt], [tt/ bTr/2], [7r /2,27r/ I], [27t/ l,7r] oF th(' oi iginal sigiud, although they still cover the entire Fre(|U('iicy domain.
Th(' lowpa.ss Filter Li z) and the highpass filter H{ z ) tliat ar(' used in tliis divompo- sit.ioii have Ihc Form
(2.1) i 111 l.liis ('(|ua.t.iou L{z) = - + z C { K , Z ) . I (_ ,) « + / .-I , 77. (2.2) (2.2) (7v -77.)!(A' - 1 + 77.)!( 277. - I)·
as ,L<;iv('ii in [.22]. lleni, the index A', whidi can only take iiit<'p;(M· values, do'ternnnes the l('ii,!i;l.li oi ( lie (il(.('r. I'()r example, Ibr K = 2, the lengtli ol' the iiltei- is 7, vvliich is ohtaiiu'fl (Voin tlu' r('la.tiou lcu(jl:li = 4A' — 1. The corresponding transler runctioii Ibi· (Jh' lovv-p;i.ss
I.('l· IS
''igiirc 2.2: I'Ycquency response of the low a.nd liigli |>ass iilt('rs
(2.4)
vvliieli ¡s a. liaJi-band Нгюаг phase F IR filter. The higli-pass iiltc'i- //(.r) is a|)propi'iatody
d('(iiK 'd by
1И-) = ); “ 2 32 + -■ ') + 32 ('¿■■’ 1
'ГІК' Гіч'(|ікміеу response of the.se filters and liow tlu'v divid<' tlie Гіхѵ|ікчісу doina.iri inl.o two ha.ir-l)a.nds a.re shown in Tig. 2.2.
;.2
A N e w W ay o f D e c o m p o sin g th e S p e e c h S ig n a l
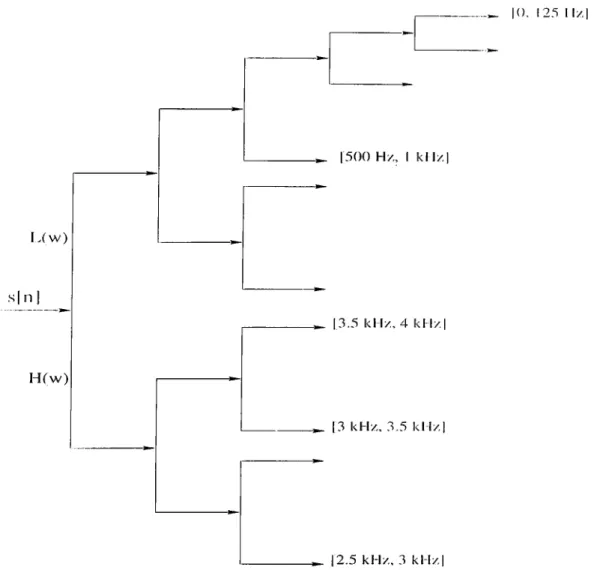
IOmcIi s|)(44*Ii (т а т е is decomposecl (Jiree levels using the basic siil)l)aiid analysis block shown in h^ig. 2 .1 . At the end of each successive level, the number of subsignaJs doul)l(\s, and Uieii· [Ve(|U(Ticy range is halved. At the end of tliis tlirec' l('V('l d(44)m|)osition, we hav(' eight siil)signals each having a passband of length tt/S, wliicli corr(\sponds (.o 500 Ц/, lor (S kllz sarnpling fre(|iiency. The resulting frequency domain d('C()mposil.ioii is shown in Kig. 2.5. Tlie subsignal which has [0, 500Hz] passband is (iirtliei· decom|)os(4İ two more (,im(\s to ol)tain a signal with passband [0, T2511z]. Tlie tr(4' structuiR' giv('ii in k^ig. 2.7 is ııs(4İ to decompose the signal in this way.Th(' s('cond st('[) is to use the subsignals generated during this df'composiljon a.nd lorm a.notİK'r set of signals which have a frequency range a.s shown in thg- -· I · dTis lu'vv
10
IkHz 2kHz 4kHz
[''igure 2.3: l'Yecıuenc}' domain decomposil.ioii
500H z IkHz 2kHz 4kHz
l'’ignre 2.4: New frec|uency riuige deiiiiition for tlu' iill.c'i· l)ank
set of sigiiaJs arc obtained by adding up tlie necessa.ry subsignaJs in t.lie (imc domain. TİK' l('iigtli of tlie.se subsignals need to be equal to be able to add them. I3ut tlu' subband d('composition a.nalysis explained above decreases the leiigtii of tlu' subsigiials a.t (-aeli lev<4 Ix'caiise oC tlie downsa.mpling block at the end of ea.cli lira.iich. 'I'o kcx'p the length of till' siibsignaJs equal to the original signal, we liave to get I’id of (Jk' downsampling block.
[''igure 2.5: A system with the downsa,mpling block in tlu' mic
VV(' ns(' the ec|uivalence of tlie two block diagrams shown in big. 2.5 and h'ig. 2.G to rea.eh oiii· goal [33]. In the lirst diagram given in Fig. 2.5, tlu' oiil pnl. of the- lirst liltn· is lilt('red by /'[¿(iii) after it is downsampled by 2. 'I'he second diagram given in F'ig. 2.(i, (iltc'is l.he o ut|)ut of the lirst filter by ¡‘'■¿{‘Ixo) arid moves the downsampling o|x'ia.tion to till' ('lid. VV(' can use the second block diagram and ignore' the downsampling at tlx' end to k('('p the length of our signals constant. We can ignore tiu' downsampliiig unit Ix'cause i(s eilV'ct is to decrease' the sampling rate so th a t the signal at the' o u tp u t is critically
11
l·'İL>;ııг(' 2.G: 'I'lic c'(|u’iva.lent systoni with the (lownsampling block moved to the' c'lid
sa.mph'd. 'I'lx' signal we ol)tain will lia.ve the same length a,s tlu' in|.)nt signal a.nd tlie rr(H|ii<'nry contemt will be the sa.ine with the lTe(|nency content of (he signal obl.aiiK'd al. th(' o u tp u t oF I'dg. 2.5.
2.3
F e a tu r e E x tr a c tio n
Tl)^' algoritlim oiitlined above takes a frame of speecli signaK and prodnrxhs nine signals of tli(' same length whicli ean\y information from different [тсчцкшсу bands. Altliougli I-Ik\s<^ nine sig.nals are not obtained by filtering the originaJ signal by піік' di(fer(nit filters, tli(' ('fleet of tli(' operation ontlined a.bove can be siiirrma.ri/x'd as піік' different filters having |)a.ssl)ands as sliown in Fig. 2.4.
In fJic' iK 'x t st.ep, we e x tra c t the lag-one a u to c o rre [a ti()ii ѵ а іік 'о Г ('a.eli signab o bf.a ining iiiiK ' vail I ('s fro m a fra m e o f s|)eech signal. Since wc'. use іч'аі valiu'd iilteihs, tlu ' iiltc'ix'd signals a.i(' also іч'аІ. T h e re fo re , tlie lag-one a u to c o rre la tio n c a lc u la tio n ma.y s im p ly Ik' g iv ('ii a.s
_ уііп)Уг(п - 1)
ѵѵіи'іч' г,: is the lag-one autocorrelation value For tlie brand), //, is tlu' siil)signal and .N is (lie length oF the frame.
'ГІК' com bination oF decomposing the speech signal a.nd Featui'e (',xti-a.c(,ion ai'c ivpiiv- aleid. (.<) (.he blodv dia.gi’a.m sliown in Fig. 2.8, where the input is a. Franu' oF s|)(4'di signal ceid.('i'('d a.(. tim e t.
12
2 .4
S e g m e n ta tio n
TİK' l.)asi(*. ii|('a in (Icterinining the segment or ])lione l)oııiKİai‘ies is to r()\u\)c\.vc tli(' leatiirc' ver-toi’s oF two a.djacent frarnes and corne out with variation measnix' which will i|iiaiitify tli(' s('veiT,y of the change From one segment to the otlieic Discix'te vei-sion oF any oF tlie iiK'thods given in IT|iis. (1.6), (1.7) and (1.8) in Section 1.2.1 can Ik' used to obtain a \;ii T i t i o n mea.siire l)etween tlie two Frames. Tl.i.e discrete' vx'rsie)n oF (1.6) was givx'ii in ( 1.1 1 J as an ('xample.
d'İK' \a.lii(' oF tlie valuation measure /2/. is calculated From two Ira.iiK's which a.ix' on ^'itİK'i· side' oF thx' time instant L. The va.Iue of Di will Ix' large when (Jic'sc' two IVaiiK's a.ix' taken From two diiFerenl [)hones. Otlierwise, it will lie e|e)s<' to 'acvo. TIk' variation m('a.snix' is a|)|.)lied for all time points and the trajectory of /2/ is e)|)(,ain('el. T Ik'ii, (.he hjcalion oF tlie significant peaks in the trajectory of Di aix' intei‘pret('e| a.s l.lu' loexitions of I.Ik' significant spectral changes in the speech d a ta which correpoiids to phoiu' transitions.
13 I3w ) s[nl H (w ) 10, \25 11/,| 1500 Hz, I к Hz I 13.5 kHz, 4 kHz I |3 kHz, 3.5 kHz] _______ ^ Г2.5 kHz, 3 kHz I
Figure 2.7: Tree structure used to decompose' tlie s|)eech signal
I'l(t)
C hapter 3
P erform an ce A n alysis and
S im u la tio n S tu d ies
In I,Ins cliaptcM·, characteristics of a clean s|:>eech signal arc' cliscnissc'd along vvil.li a. disciis- sioii on pc'i-fornianc'e arialysis. Tliis chapter also introduces the' setup nsc'cl to p('idV)rm the siinidations and the results of these siniulations for va.rions inethocls th a l arc' considc'i-ed in ( his tlic'sis. LCxperiincnits on the effect of car noise a.re also ¡nchidc'cl in (,hc' sinuilations.
3.1
P e r fo r m a n c e A n a ly sis
Tli('i4' is no (|ua.n(.il,ativc measure Гог determ ining the |К '|('огта1ич' of a s('gm(Mitatioii algoiitlim. '1'1к'Г(' are various factors aifecting the регГогтапс(' of such an algoritlim. 'I'Ik'sî' ra.ct.(U's are outlined in Section •'hi.l. The discussion on the |)<'1'Гогтапсе of the n.li>:oi'i(Jims arf' based on tlu'se factors.
15
o / 1 . 1
Factors A ffecting Perform ance
1. It should iiiid all the phones in the utterance. VVlieii an utterance' is L>;iv('ii, tlie al,ü;oritlun sliould be able to extract all the phones İTonı th at ntte'rance. The al- gor.il.hm can also detect the silence periods between tlie words, if tlie're' are any. /\ltliough silence is not a phone, articulation of some phone's like' / p / , / t / , / k / ' , e'l.e·. re'(|iiires a short stop before the sound comes e)iit. dliese' sl.e>ps a.|)pe'ar a.s sile'iie-.e' in the' recordings and detecting these stops are expeM-te'el. If we' ha.el se'gmente'd the ii(.t('rance' “kapı” (.Fig. 5.1) in Turkish, we would find five' segme'iils ('xeliiding tlie sik'iice' a,t the beginning and at the end. The four se'gme'iits (■e)i-re'spe)iid l.e> / k / , /a./, / p / , / 1 / ¿uid the fifth corresponds to the' she)rt stop be'feire' (he' ple>sive' / p / se)iind.
2. 1(. sheinlel not over-seegmemt tJie spe'eeli signal. The aige)i‘i(,lim s[ie)irld ele'termine only e)ii(' se'gmenit for e'aeli phone. There should not be' I,we) se'gments in part e>f tlie' iil.i.<'rane-(' which actually e-.orresponds to only e)iie plie)iie'. K('('ping l.lie' dise;iissie)n in (.lie' previe)us property in mind, this can be acce|,)(,ed e)nly if it. is naXiira.l t.e) have more' (.han one seigment for one plie)ne like a silence |)e'.i’ioel a.nel a. / p / se)iiiiel (‘oi· (,lie l('(.(,e'r “p” .
5. Tlie algorithm should clearly suggest a boundary pe)in(.. (T'ne'rally. Iionnda.ries are selee'ted by comparing the value of the distortie)n me'a.sure' a(. e'a.e’h ( ime pe)int witli a pre'determined threshold. Changing the ttiresh.oId aifects tlie num ber of boi.mda.ries found. Small changes in. the ‘T-orrect” thresliold should not affee't the i('siilt. This is possible only when the algorithm prexliiex's signilicaihjy lai-ge'r value's at. t.he' be)iindary points compared with the rest e)f tlie elis(.ane‘e' me'asnre values.
I. The' leie-.aXion of the phone boundarieiîs should ma.te:li (,lie' (•e)rre'e-t pe)si(.ie)ii e>f (.lie pile)IK' lioundaries.
5. It should be robust. The performance of the algoritlim slie)iilel rie)t de'gi-a.ele' under noisy environments.
T'll·' la.s(. pre)pe'r(.y is ve'ry im portant because it is not alwa.ys pe)ssibl(' lo make' cle'an li'eordings. İfa n algorithm, should prove it se:^lf useiful, it should be re'sisl.anl. te) ne)ise'.
16
l·’igm■e 3 . 1: " K a p r’ rocording
3.2
P h o n e s in a C lea n S p e e c h
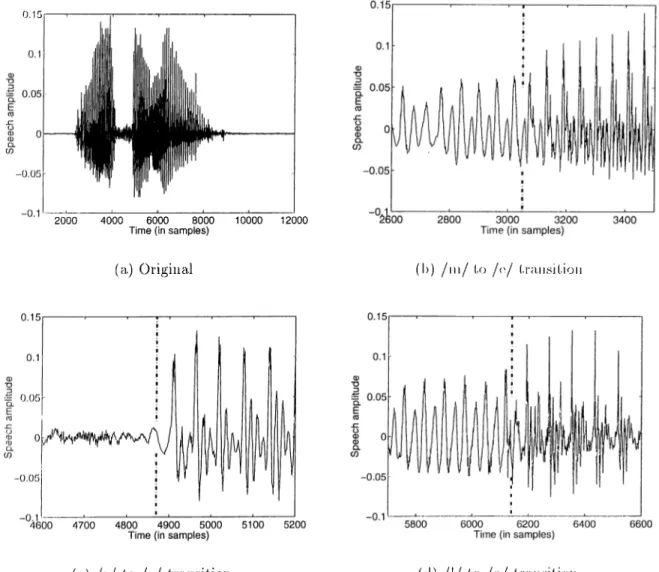
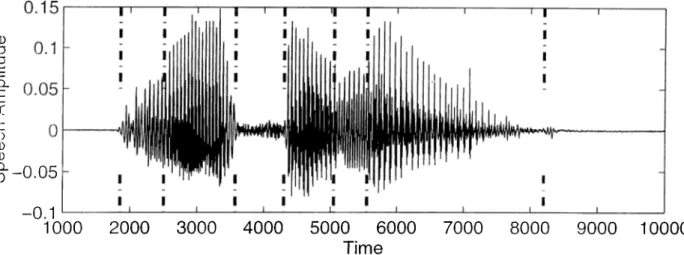
TİK' i-(H'()r(liiig vv(' consider in this section is the word iitteranre ^‘nu'sc'lcr in Turkish. 'rii(' r^'rording is given in Fig. 3.2(a). The recording is periorined in a (|ni('t room a,t a sn.inpling oF 8 kHz hy a rriaJe speaker.
Some utterances can easily be segmented by looking at the am plitude of the spc'ech signal. Ihit it is much easier and more reliable to det('rmine tlu' local.ion of transitions From oiH' phone to a.notlier, by time-scaling the spec'ch signal and ('xamining th(' Forms oF l.lie s ig n a l, 'riii’ee different transition regions are sliown in d('ta.il in Fig· 3.2(1)), 3.2(c) and 3.2(d). T Ik' transition from / s / to / e / in Fig. 3.2(c) is From an nnvoicc'd sound to a. voirc'd sound. Tlie tra.nsitions From / m / to / e / in Fig. 3.2(F)) a.nd /1/ to / a / in Fig. 3.2(d) a.i(' both From one voiced sound to another.
11, is ('asy to differentiate an unvoiced sound From. a. voicx'd sound. Fnvoici'd sounds lia.v(' low am plitudes and noise-like iiciture, whereas voiced sounds are periodic and liav(' higlu'r am plitudes. Altliough it is easier to distinguish voic.c'd and unvoicc'd sounds, it is also not difhcult to sepa.rate two voiced sounds. FFig. 3.2(h) and Fig. 3.2(d) cl('ai-ly show th(' rliFference betwc'en the waveforms of two adja.cxnit voic(vl phoiK's in l lu' spc'ech signal. Tlu' da.shed lines indicate the point wliere tlie tra.nsitions occur.
VVIkmi plioiK's are spoken in context, phoneine bounda.rii's hivoiiu' dilficnlt to diF- lei(Mitiat(\ This is due to tlie [)hysical properties oF sp(X'cli articulators. Voi’al Ira.ct a.rtinilatoi-s consist oF human tissue and their positioning From oik' phoiKune to tlu' iK'xt
17
0.15
2000 4000 6000 8000
Time (in samples) 10000 12000
(a.) Original (I)) / m / to /('./ I.ra n s itio n
(c) /s/ to /e / transition ((]) /1/ to / a / l.ra n s itio n
Figure 3.2: “Mesela” recording and the transition dc'tails
is executed l),y tlie inovernent of muscles that control articulatory movf'iiK'ut. Accord ingly, there is normally a period of transition between phones. In fact, the transition do('s not tak(; place at one point as suggested by the dasln'd liiu's in tlu' iigures. d'he flashed lines have been placed in the middle of the transition regions in which the sound dianges from one phone to another. Similar to the position of tlu^ transition rc'gions, tlu' position of these dashed lines are not exact.
1,8
3.3 C h a r a c te r iz a tio n o f B o u n d a r ie s a n d S e g m e n ts
A l)oiir.i(lary conxisponds to a change in the articulation or acoustics of tlu' sp('ech. Tlie hoiiiiilary may (\ither correspond to• an al)ru|)t change such as voice or frication onsets or termiiial.ioiis, oi·
• a.n onset oF gradual spectrcil change. The spectral ctiangc' may correspond (,o
- a, \'a.i*iation oF energy inside a Frequency l)and,
- a. driFt vai‘iation of a formant, or
- a. loss of the Ibrinantic structure.
'\’\\c si'gnuud.s can be maiidy classified into two classes, as (ollows:
• sta.tiona.ry segments which correspond to tlie steady part o(‘ a |)hon('m('
• ti’a.nsient segrrients whidi may be observed Ijetween
- (,wo voiced phonemes; inside such a segment, the Formants ı·(мna.iu monotonous
- a, voice phoneme and an unvoiced one
- a. pilóneme and a silence; the formantic structure is va.uishiiig
3 .4 S im u la tio n S e tu p
VVe ca.ii ('xtra.ct the correlation structure of the phones a.nd rh'chh' on the plioiu' lioiind- a.ri(\s in tlu' s|)eech signal based on degree of dissimilarity oF th(' correlation stru ctu re oF tli(' a.dja.aviit Fra.mes.
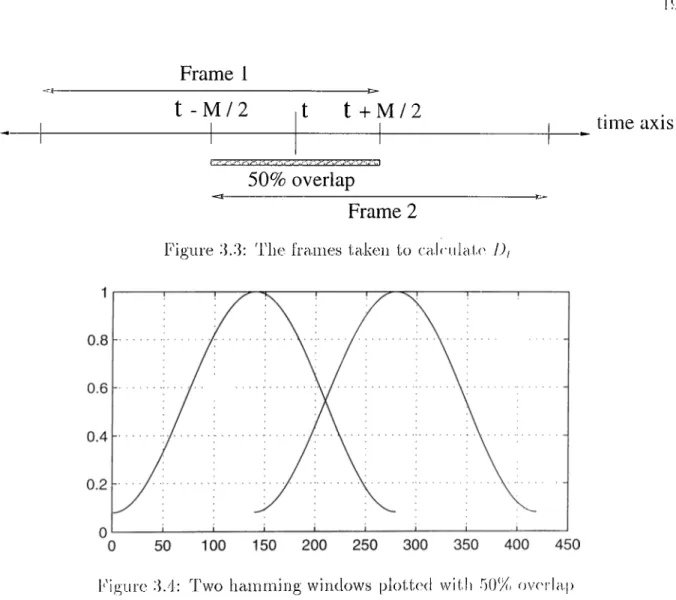
lu th(\se s[)('ech segmentation experiments, two 28()-poin(. Fram(\s oF tli(' signal aix' taken a.t each tim e instant. 280 points correspond to 35 millis('conds at 8 kllz sampling rat(\ TİK' center of these Frames differ by 140 samples. This corresponds to 50% ovxu'la.p oF lJ)(\s(' two Fra.mes. The Frames and their relative positions are d('pict(xl in Kig. 3.3. Iloth oF th('S(' Frames are then multiplied by tlie 280-point lla.imning window. Tliis windowing opi'ration gives more emphasis on the d a ta at the c('iit(u· oF th(' Franu' and (,he
19
Frame 1
t - M / 2
t
t + M / 2
50% overlap
time axis
Frame 2
Figure 3.3: T he frames taken to calculate' I)/
l''¡gure 3.4: Two ham m ing windows plotted with 5()% ovc'Hap
significance' e)f the reegions at both ends are diminished. Figure 3.4 e’la.riiies tlie eifee-t e)f the' liammijig window in conjunction with the distane-e Ire'twe'e'ii tlie twe) (Tames.
4'lie twe) windowed signals are fed into the block shown in h'ig. 2.8 whe're', at e-ach branch, they pass through a different filter, and a cori-clator which calculates the' lag-one autocorrelation of the o u tp u t of each filter. The set of filters used in all the branches will be referred to as the “filter bank” . In the discussion starting from Se'rtie)ii 3.5, different filter bank structurees are prope)seel anel analy/T'el.
4Vajee-te)ry of Di is obtaineed as discussed in Seictiexn 2.4 Iry applying the' e|iste)rtie)ii measure's mentioned in Section 1.2.1. Thresholding is applie'd te> detect the' loetations of the' siguifieuvut peahs in this plot.
20
3.4.1
P eak D e te c tio n
va.i-ia.tioii m easure plot is first exainined for any impulsi v(' p('aks vvliirh nvc ca.used l)y tli(' instability of the distortion m easure. The reasoji for tliis iiistal)ility is (\xplaiiied in Ser|,i()n d.!). y\fter these peaks are removed, the plot is sm oothened l)y a moving average filtcn·. This liel|)s to reduce very small local peaks. Peaks in the' D( |)lot nvc obtained by ( hii'sholding a.t 2 0. Fiacli. point is regarded as a candidate' pe'ak, if its value' is larger ( hail value e)iie pe)int to the leit and right and the pi’e'elete'rmine'd l,l)i’e'slie)ld value.
T'li('s<' e-andidate peaks are further |)roe4:'sseel te> get rid e)f snpe'i-(lne)ns p('a.ks. ЛП,ег l.li(' wi.liie of Di gets abe)ve the threshold, there may be' тогч' I lian oik' pe'ak de'(,e'e-te'el, until (lie vaiue gets below tlie threshold. All the:'.se peaks in tliis regiein slieinld a.e-tiially lie' e‘e)iisielei-e'e| as one large pe'ak. The m axim um valueel peak in tins regiein signilies this large' pe'ak, and the other superfluous peaks a.re discarded.
This m ethod is liased on the idea th a t w ithin a seigment tlie e-|ia.i-a.ci,e'ristie-s are' nearly (he' sa.me a.iiel the variation m easure will result in a small value'. VVhe'ii (,lie' va.ria.(,ion me'a.snia' pleit first excc'nds the threshold, this means th a t we are' e'lite'ring a (.ransitiein rr'gion. W hen tfie value gets below th a t thre^shold, this rae'aiis (.he' ti‘ansi(.ie)n ha.s (iiiished and we' are once again in a statistically stable region.
A hierareiiical scheme is employed for detecting the peaks. De'te'e-tieni sl.arl.s wit.li an iiiitia.l tliresheild value oi 20. The value of 20 has be^'en diose'ii by investigal.ing many variation mea.sure plots. Tliis appears to be optim al fen· our m ethod. Afte'.r gettin g rid of :aip('r(liioiis pe'aks, if the tim e diiferene:.e betwe-^en airy twe) pe'aks is abeive' a e-e'i-(.a.in value, (1и' vaJiK' of tlie (.lireshold is decreased and this re'giein is processeel eine-e' again wil.h tlie ne'w I liri'sliolel. Tlie reason for this step can be jiistifieel a.s (olleiws: Noi’inal s|)e'e'cli is a. la.sl, (.ransitieni e>f sounds. Tlierefore, it is not natural (.e> have' a vei'v leing plieineme' during spe'ee-h. Wlien our prior sef'g.merntation does not e|e't('e-t any p('aks lor a. long (line', we e;.an (.liink th a t there has Ьезеп a transition during this time' iie'i’ieiel, bn(, (,lie' traiisi(.iem wa.s e'itliei· a slow tran sitio n or it was not significant whie*h I’esnlted in sma.fi elistances. Py de'e're'a.siiig the thresliold, we expe^ct to catch these neit-sei-signilie'ant (.i‘ansi(,ie)iis.
21
3.5
D iffe r e n t F ilte r B a n k S tr u c tu r e s
In S('<'l,i()ii 2.2, wc introduced a iiiter bank stru ctu re, d'lie Ггесцкчісу rang*' of (Ik' IHI.cm's ill tliat (üter bank was also depicted in Fig. 2.4. This iilti'r liank vva.s chosen as the b<‘st a.mong various o th er choices. If we denote the passbaud of tlu' iiltcus by tlu'u ,//, was fixed at 125 liz and /e was changing linearly from 500 II/, to I k ll/ witli 500 llz stc'ps with a.n additional filter of passba.nd [125 И /, 250 ll/].
'ГІИ' (ІШеіч'пІ im plem entations that have been expi'rimented are listed Ik'Iow witli dill’erent labc'ls for ea.se of reference:
S I = 0, Jr changes linearly between 250 11/, and 4 kll/, with 250 11/ stc'ps, ,S2 J] ■= 1 k ll/, fi, changes linearly between 0 and .4750 11/ witli 250 11/ sl.<'|)s, 5 3 /;, = 0, fr clianges logaritlim icly between 250 11/ and 1 k l l / close' to nu'l scale' [;
5 4 Same' as S I but JJ = 125 11/,
.S5 Same' as Si but Ji, — 250 11/,
S6 r'inal ve'isiein. Explained in 2.2 and shown in Fig. 2.1.
All eiF theise filteir bank structnreis are examiimd in this ediapte'r. 'riie'ir pe'rldrmane'e' are' e-e)iii|)are'el w ith eacli e)their and the param etric liltering base'el se'gnie'nta(le)ii algeiritlmi me'iitioneel in Section 1.2.
'I'he first p a rt reviews the results obtairmd from the filte'r bank sti-iie-tiire's eh'se'ribed as S I anel S2. 'I'liese results are based on a clean speee'h re'eieireling. 'This part simws us the' siipe'riority e>f S I emrr S2. T he following p a rt exaniiiu's the' |)('rforma.ne'e' e>f S I uneler e ar neiise' and an o th er schem e (S4) is proposed. Some m inor moelifications are' elise-usseel and the'v h'a.el us to the final filter bank stru ctu re, 'rid s strue-ture', which was give'ii in Se'e tion 2.2, is exnnpareel w ith the P aram etric Filtering.
3.6
P r e lim in a r y R e su lts: S I an d S2 v s. P F
We start, with the filter bank stru ctu res S i and S2. 'The' unele'rlyiug iele'a is (he' sam e in I lu'se' (,vve) strue-.tureis. 'Fhe ideja is to fix one end of the passbanel of (he' filte'rs. 'I'lie
(D "O 13 "q. E < (D CD (f)^ 0 .0 5 1000 2 0 0 0 3 0 0 0 4 0 0 0 5 0 0 0 6 0 0 0 7 0 0 0 8 0 0 0 9 0 0 0 10000
Time
Figure' .‘F5: (¡orrex’.t plionc bouiiclaries of tlic' “in('s('la“ iil.f('i‘aiic(' D e sc r ip tio n o f th e o h o n e b o u n d a r ie s
15oiinda.ry
number Description Location
Boundary
numliei* l)(\scri |)i.ion Location
1 Silence to / i n / 1850 5 A'/ /1 / 5050
2 / i n / to l e i 2500 6 /1/ to /a./ 5550
;5 l e i to / s / 3570 7 /a./ to sih'iKX' 8200
1 / s / to l e i 4300
Table v5.1: Plione boiiii(laries of the 'Vnies('la" ri'cerdiiio,·
low ('lid of fli(' passba.iid of Idle filters is fixcxl in S I , on tlu' eoiitrarv. Idu' liiglio'iid is (ix('d in S2. ddiis is the difference in the iinpleinentation. TIk' Iovv-('i.kI of tlu' pa.ssbaiids Foi- ldi(' sti-iietiiri' S I is fixed at the lowest possifile vaine of /x'i‘o wli('r('a.s tlu' high-c'iid For th(' sti-iietiir(' S I is fixed at the highest possible values oF I kflz.
To !)(' a.l)le to a.iuiiyz(' tlu' perforrnaiKX^ of these inetlux^ls, w(' havx' to hnow I lu' eorr('d. locations oF th(' pliones in the “m esela” utterance. The coivixa-t localdions aix' supi'rposerl on th(' ’‘nu'sela/’ recording and are shown in Fig. 3.5. The d ab h ' 3.1 di'scidlx's (xudi plioiu' boundary and labels them with num bers. As a rernindei·, th(' locations should //,ot be (ak('ii as ( xa.ct, keeping in m ind the discussion in Section 3.2 al)oiit th(' Fuzzy ti-aiisition r(\gions.
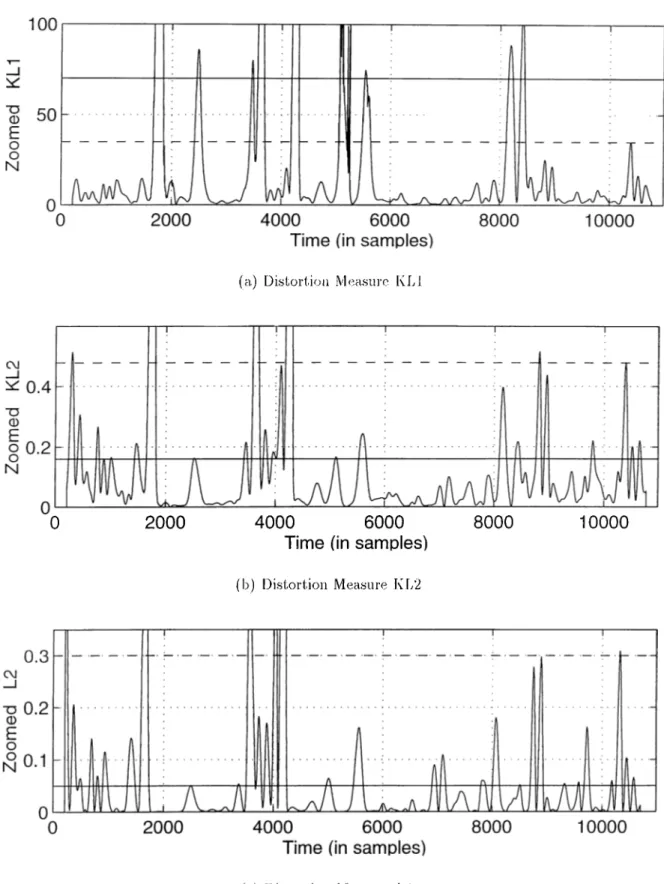
Th(' i-esiilts For the stru ctu res S I and S2 are given in Figs. 3.(i and 3.8. We also iKX'd to s(.'e the details of these plots at a finer resolution in the y-axis to tell more about th('ii· p('rFoi-man(x'. Details oF these (fistortion plots aix' pr(\s('iit('d in kdgs. 3.7 and 3.9.
2;}
B.y clK'ckiiig hotli of these grciphs we will tiy to judge tiu' |)erroi-ma,nr(' of tlic stm c tu re s under differejit distortion m easure algoritlim s.'I'Ik' dashed lines in the zoomed ligures show the value of iu th(' d istortion plot. 'I'lie solid lines represent the H V T '\ the highest vahui th a t eaii Ih' assigned to the thr<'shold to !)(' able to detect all the phone bouiidaries(PB s). VVIk'u the solid line is abov(' tlu' da.slied line, a threshold tlia.t is chosen between these two lines will give' us the eoi'rect bounda.ry loca.tions.
3.6.1
D iscu ssion on SI
'I'Ik' r('siilts of tlie lilter bank stru c tu re S i are shown in Figs. -'bG and 2.7. VV(' know from I' lg. 2)..2 a.iid Table 2.1 tha.t the utterance starts a.t sam ph' iiuiuIh'i· 1850, and (vnds at :>a.mpl(' luim lx'r <8200. W hat is before 1850 and after 8200 corresponds to the' ba.ckgi'ound sounds in tlie I'ecording. T he algorithm should not produce lai'gx' peaks in tlic'se regions.
'I li(' clistortion m easure K L l produces good results. Both K b2 and L2 cannot piodncr' high peaJvs for phone boundaries 2, 5, 6 a.nd 7. 'fable 2.1 sliows whicli bounda.ry eacli numlx'i· corresponds to. 'There are various high peaks a.t the Iregiuniiig a.nd at Uu' ('iid in bol.h tlie KT2 and L2 results. 'The peak around 10500 wlii(.lt is seen in all tlui tliree ligiiii's. ci4'a.tc's a problem in all the distortion calculation m ethods <'.xc('|)t K Ll; r<\snlts of wliieli a.i4' shown in Figs 2.G(a.) a.nd 2.7(a). We can .see from Figs. 2.7(b) and 2.7(c) l.ha.t what pushes the da.shed line up are the pea,ks around 9000 and 10500. KLl elimina.tes th a t pi’oblem and gives us correct residts. 'The results ar<' summa.rized in 'La.bh' ;L2.
D is c u ss io n on P e r fo r m a n c e o f S I K L l K L 2 L2 FBs found All 1, 2, 4 1, 2, 1 Plls missed None 2, 5, 6, 7 2, 5, G, 7 IIVT G5 0.18 0.05 m-'F 25 0.5 0.2
'I'abh' 2.2: Sum m ary of the. perlbrm ance of S i for clean "m('S('la” i4'cording
'I'Ik' loca.tions of the pea.ks produced by the algorithm s are conx'cl.. We l'a.c<' no
“(ll)iglH'st (l'')a.lse (P)ca.k: the thre.shold should be above this vahu' ■*(ll)ighest (V)alue for (T)lireshold
24
(a) D is to rtio n Measure K L l
(b ) D is to rtio n M easure K L 2
(c) D is to rtio n M easure L2
■m
(a ) D is to rtio n Measure K L l
0
2000
4 0 0 0 6 0 0 0Time (in samples)
(b ) D is to rtio n M easure KL·2
8 0 0 0 10000
(c) D is to rtio n M easure L2
26
|)i-ol)lcm in term s of th e locations b u t identifying those local peaks as phones boundaries is our m ain problem .
3.6.2
D iscu ssion on S2
i'lie results of the filter bank stru c tu re S2 are shown in Figs. .■1.8 ancl 3.9. This filter f)a.nk stru c tu re |)roduces good results when combined with th(' KL2 or L2 distortion m easures. Tlie results obtained from K Ll mea.sure does not Inip us l)eca.use of the insta.l)ility ol)servcd in Figs. 3.8(a) and 3.9(a). A lthougli, tlie solid line is aJrove the dashed line in the K L2 result s shown in Fig. 3.9(b), the two lines are close to each other. 'I'lK'ie are peaks at th e beginning and at the end which are com|jara.bh' wit.h t.lie fifth plioiK' boundary.
'!'!)(' levf'l of H F P is lower in L2 but this tim e the second plione f)oundary lias such a. small m agnitude th a t it can not be detected. Even if we ignore the peak a.t the very Ix'gilining which sets th e level of HFP, we still can not detect tlu' second phone boundary. 'I'Ik' results for S2 type filter bardi stru c tu re are sum m arized in 'Fable 3.3.
D is c u ss io n on P e r fo r m a n c e o f S2
K L l K L 2 L2
PBs found None All E ··}, f, 5, 6, 7
PI is inissod All None 2
IIV'F 0.8.5 0.16
IIFP 0.7 0.4
'Fable 3.3: Sum m ary of the perform ance of S2 for cl('a.n ‘"mesela.” recording
lloth KL2 and L2 lack th e sm ooth shape K L l produces when used in th e SI stru c tu re (See Fig. 3.6(a) for reference). T he high ratio of H V T to IIF P makes S i-K L l pair superior tlia.n tli(' otliers.
3.6.3
P erform ance o f P F B ased S egm entation
'File results of tlie param etric filtering based segm entation a.lgorithni is shown in Fig. .'1. f2(a). 'File disti'ibution of ?/ is clmsen uniform between -1 and 1 and 0 = 0.16 as recom m ended
27
(a ) D is to rtio n l\4oasure K L i
(b ) D is to rtio n Measure 1x1/2
(c) D is to rtio n M easure 1/2
28
0
2000
4 0 0 0 60 0 0Time (in samples)
(a ) I)is to ri.io n M easurn K L l
800 0 10000
(I)) D is to rtio n M e a s iiri' K L 2
(c) D is to rtio n M easure 1/2
29
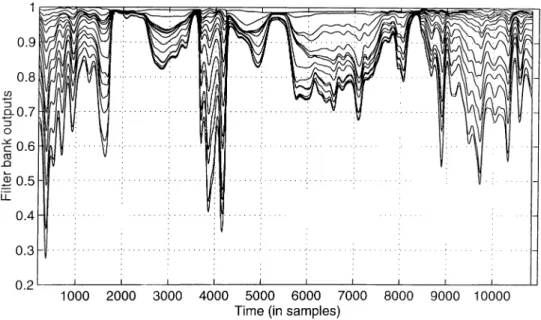
l*'igure 3.10: TCA plot of S I for cloian “iiK'sela” ı■(н·()Γ(fİIlg
Time (in samples)
;ю
'riic |)eiionncm ce is outlined in Table 3.4.
PBs found PBs missed H V 'r 1П''Р
1, 2, 3, 4, 6, 7 5 11 К)
Table .3.1: Sum m ary of the perlom iance of Pl·' for "mcsela.” ı·('(■()ıчli]
:И
(а ) K L 1 (l¡sl.o^i.ioıı т е а н и п '
О
2000
4 0 0 0 6 0 0 0Time (in samples)
8 0 0 0 10000
(b ) F ig . 3 .1 2 (a ) Zoom ed
h igiiiT' 3.12: IvLl (listortion measure results of W structure for rkviii "iiK'sela” r('C()r(fing
3 .7
R e s u lts U n d e r N o is y E n v ir o n m e n ts
3.7.1 Car N o ise
'ГІИ' aJg()ritlim.s lia.ve also been tested w ith a recording on wliidi car nois(' lias Ix'en arlch'd. 'I'Ik' signal we o b tain by adding car noise on the “mesela.” recording is s(4'n in Fig. ib id . 'ГІК' SNII of this signal is equal to 10 clB. T he frequency content of car noise' is known to localize' a.t leiw IVeieiueincieis. In this section, the performane-e eif S l and S2 are' a.nalyze'el imele'i· tliis spe'cial nehsy envirenimejnt.
;r2
Time
Figure' 2.13: Ca.r noise adcK'd "niesela” i-ecordiiig
In our pre'vious experim ents with S I a.nd S2 we lia.ve sliovvn tliat S I pe'i-forins good vvitli K hi distortion Inea.sure and S2 perform s modera,tely with KI/2 distoi'tion mea.siire. O tlier c|ioic('s vvei'o; considera.hly worse. In tliis section, tlu' car noise- a.dde-el “me-se-la.” le-roreling which is sliown in Fig. 3.13, will be tested using S l+ K b l a.iiel S'i+ l-il/i.
T Ik- ('Ih'ct of ca.r noise is ckxrrl^e seen in Fig. 3.1'1. In h'lg. -3.1 l(a.) , tlie'ie- a.re- two high pe-a.ks a.|)a.i’t from tlie pea,ks correspojiding to plioiu' boiindarie-s, vvhie-h sha.dow the other p(-a.k.s. Because of these two pea.ks the algorithni ove-r-se-gme-nts the- utte-i'ancx-. It will also miss tlie first and th e sixth phone boundaries because- of their low m agnitudes. In h'ig. 3.1 1(b ) , there is a disturbance in the distortion plot which masks the- fifth and s('V('uth ohoiie boundaricis.
Ihuame-ti'ic filtciring baseed segm entation algorithm is also allecl.e-d fi’om the a.ddition of car noise. 'I’he TC A plot a.nd the distortion m(',asure |)lot olrtained de-riveel li-om this 'l’(kA plot are shown in Fig. 3.15.
'I'o im prove the peirtbrmance of S I , the informa,tion we ga.tlier from the- ve-ry low e-nd of (he fr(:'(|uency speictrum is ignorexl by shifting the startin g point of tlie (iltei's in the (ilte-r bank stru c tu re to 125 Idz. This filter ba,nk stru c tu re corr('s|)onds to S4 give-n in S<-c|,ion 3.5. Since the car noise conta,mina,teis m ainly the low li'e(|U(-nci('s in the- spe-ctrum, I his iK'w sl.ructiire is expected to |)roduce b etter results than S i . 'I'lu- ix-sults of tlx- S4 striicl.iiix- is sliovvn in Figs. 3.IG and 3.17. K Ll a.gain pei-fonns betls-i- than K l/2 and b2. 'I Ik- r('sults aix- sum m arized in Table 3.5. Tlie corresponding 'I'f'A ph)l, is akso shown in 3.18.
(a.) S I + D is to rtio n M easure K L J
h'lgiiro 3.
(b ) S 2 + D is to rtio n M easure \ i \ / l
Bcist results of S I and S2 obtained lor car noise a.dded “mesela,” i('cording
D is c u ss io n on P e r fo r m a n c e o f S4 K L l K L2 L2 PBs Io u i kI All 3, 4, 7 3, 1, 0 PBs miss('d None 1, 2, 5, 6 1, 2, 5, 7 l l V ' r ()8 0.15 O.OS lll< 'P 35 0.28 0.14
и
1000 2000 3000 4000 5000 6000 7000 8000 9000 10000
Time (in samples)
(a ) T C A ])lo t fo r th e p a ra m e tric filte i' hank
(b ) P F + K L i d is to rtio n m easure
:}5 4 0 0
200
1 1 1 1 Г' J \__i
I K . ____________ 1^^a/\-4^/vWV/A—лл1о
о
2 0 0 0 4 0 0 0 6 0 0 0Time (in samples)
(a ) D is to rtio n M easure K IV l 8 0 0 0 10000 c\i
2
1.5 1 0.5 0 .■ ...1 ...j . 1... ... г.".··... 1... : ; гл]\ —1--- ---1 0 2 0 0 0 4 0 0 0 6 0 0 0Time (in samples)
(b ) D is to rtio n M easure K L 2 8 0 0 0
10000
1.5 CM 1 _i 0.5 h 0 j--- г 1 1 \---1;
__й___ЛуЛ___________________1 ____ лм
л
L__ с_лЛ^~ - i Л А. лА А ЛЛ.4 А . XV0
2000
4 0 0 0 6 0 0 0Time (in samples)
8 0 0 0 10000
(c) D is to rtio n M easure L'2
(a ) D is to rtio n .Measure K L l
0
2 0 0 0 4 0 0 0 6 0 0 0Time (in samples)
(b ) D is to r tio n M easure K L 2
8 0 0 0
10000
0
2000
4 0 0 0 6 0 0 0Time (in samples)
8 0 0 0
10000
(c) D is to rtio n M easure 1/2
37
1000 2000 3000 4000 5000 6000 7000 8000 9000 10000
Time (in samples)
38
3.8
E ffect o f S o m e M in o r C h a n g es
3.8.1 Increasing
I'lic startin g point of the filters, shortly ft,, was chosen as J25 11/. in the filter bank stru c tu re S4. We experim ented w ith th e value of ft, and increased it to 250 Ifz I'orndng the filter struc-ture S5. But in th e o u tp u t we observed th a t th e vaJue of some of the plione l)ounda.ries decreased drastically and they could not Ix' d('t('ct('d any more. The only transitiojis th a t W('re left, were th e / e / to / s / and / s / to /<7 transitions, which are the voicexl-unvoiced transitions corresponding to the m ost significant changes.
3.8.2 M el-Scale d ecom p osition in stead o f linear scale d ecom
p o sitio n
VVe consider the im plem entation S3 in this part. In this im ptementa.tion, Д is (Х|иа1 to 125 11/ and /,. changes logarithm icaly close to th e rnel scale [34] startin g from 250 llz. 'ГІК' pa.ssba.nd of the filters are shown in Fig. 3.19. Mel-sca.le decom position is included in our experim ents because m el-scale is in accordance w ith the' hum an percr^ption system . It is observed th a t this filter bank im plem entation does not iniprovr^ the |)erforma,nce of S4.
500H z IkHz 2kHz 4kH z
![figure 2.1: Ba,sic l)ui]ding l)lork](https://thumb-eu.123doks.com/thumbv2/9libnet/5608202.110710/21.955.199.760.212.389/figure-ba-sic-l-ui-ding-l-lork.webp)
![Table . 3 .1: Sum m ary of the perlom iance of Pl·' for "mcsela.” ı·('(■()ıчli]](https://thumb-eu.123doks.com/thumbv2/9libnet/5608202.110710/43.955.308.650.255.305/table-sum-ary-perlom-iance-pl-mcsela-ıчli.webp)