Seasonal Impacts on the Storage Capacity of EV
Parking Lots
Sıtkı GUNER
Istanbul Arel UniversityIstanbul, Turkey [email protected]
Aydogan OZDEMIR
Istanbul Technical UniversityIstanbul, Turkey [email protected] Abstract—Electric vehicles (EVs) are the new bilateral assets
of evolving smart electricity grids. Depending upon the technical benefits or economic expectations, they can be considered as non-stationary loads or they can serve as distributed storage units. Moreover, their behavior may change more than once a day. Therefore, their integration is both a challenge and an opportunity for smart power systems. From the point of electricity grids, parking lots (PLs) provide an occasion of supporting the grid by aggregating meaningful number of EVs. Car arrival departure pattern dominates the storage capacity of the PL. However, this pattern is sensitive to seasonal effects. The objective of this paper is to investigate this seasonal impacts of the environment on the storage capacity of the PL. Simulations are performed using car arrival/departure data of a representative PL in Istanbul. Time-dependent car park storage capacity of the PL is determined for a weekday for several periods of the year. The results are discussed from the point of distributed-storage availability of the grid.
Index Terms: Electric Vehicle, Parking Lot, Storage Capacity,
Seasonal Impacts
I. INTRODUCTION
Electric vehicles, EVs, are expected to become much more common in upcoming decades. Growing use of EVs has important implications for the electricity grid. They are mobile loads during their charging phases where smart charge management is required to minimize the integration problems especially during the day and even during peak demand periods. On the other hand, EVs can be used as distributed storage units at their discharging phases. Moreover, their operating phases can change one or more times a day with respect to several technical and economic concerns as a part of effective demand response programs. Hence planning and operation of EV integration is both a challenge and an opportunity for smart power systems.
Charging phase is known as grid to vehicle, G2V, operation mode. Significant portion of EV charging is aimed to take place at off-peak times, where the electricity prices are relatively low and while the vehicles are not used. Discharging phase where the EV is used as a distributed storage asset for the grid is named as vehicle-to-grid (V2G) operation mode. Since battery capacity of EVs is between 12.5-65.0 kWh, individual EV storage can be used for some small scale
vehicle-to-home or similar tasks. Effective V2G operation involves utilization of at least hundreds of EVs. Parking lots (PLs) play an important role since they aggregate huge number of EVs. Therefore, EV parking lot support is an important opportunity for the electricity grid, especially for metropolitan cities. However, when charging process or more precisely dynamic and bilateral operation of the lot, it is one of the most important challenges of the smart grid.
Car parking statistics show that the private vehicles are averagely parked almost 7 hours during working days [1]. Optimal sharing of this duration between charging, discharging and idle phases provide an opportunity for smoothing the daily operation curve along the parking period. Furthermore, incentives and promotions to increase the share of EV usage are increasing day by day all over the world. This will in turn strengthen the role of PLs in future’s smarter network due to their increasing storage capacities.
Studies about EV PLs have been growing rapidly in the literature during the last decade. They are related to the integration of EV PLs and RESs for an efficient operation [2], [3], intelligent EV PL models and PL operations [4]–[6], optimum allocation of EV PLs [7], [8], and the impact of the EV PLs on the distribution system reliability [8]–[11]. A recent paper introduced distributed storage capacity formulation of an EV PL that can be used in distribution system reliability improvement [12]. The storage capacity was determined by sequential Monte-Carlo simulations using real car arrival/departure data provided by the PL authority of Istanbul, technical parameters, and some side-specific probabilistic parameters. The proposed model was later improved by Kernel smoothing to achieve more realistic model [13]. Finally, it was revised according to city urban planning expectations and estimated travel behavior changes [1]. Moreover, impacts of several important parameters on the storage capacity of the PL were determined through sensitivity analysis.
Arrival/departure pattern was found to be the most important parameter affecting the available storage capacity of the PL [1], [13]. That’s why several studies used the statistical data composed by National Household Travel Survey (NTHS) [14]–[16] or country-specific data provided by ISPARK [1]. On the other hand, it is clear that optimal operation mode of 978-1-5386-1953-7/17/$31.00 ©2017 IEEE
the EVs depend on energy consumption style (load duration curve) and dynamic energy prices. However, both factors are strongly correlated with the meteorological conditions of the PL environment. The proposed models in references [1], [12], and [13] were developed for the car arrival/departure data in winter time (December 2014). This study is devoted to the seasonal impacts on the storage capacity of EV PLs where it used a whole year data for 2013-2016 period.
4-year data of a representative PL provided by The Chief Management of Istanbul Car Parking Corporation, ISPARK, is used in the study. The data included arrival and departure times of the cars.
II. PARKINGLOTSANDSIMULATION METHODOLOGY
There are several PLs having around 400-500 car capacities in Istanbul, where nearly 15 million people live. The number of PLs is expected to increase in parallel with mass transportation facilities in the future. Utilizing their idle capacity for the peak hours is a significant opportunity for the electricity grid. More generally, those bilateral assets may play an important role for energy efficiency.
EV PL storage capacity depends on several deterministic and stochastic parameters; namely, car arrival an departure times, state of charge (SoC) of EVs when arrived at the PL, battery capacity and energy expenditure of an EV, battery charger power etc. According to [12], arrival/departure times of the cars are the most important parameter to determine the available storage capacity of the PL. On the other hand, efficient use of PL involves coordination with the daily load duration curve of the grid. At this point, both the load and arrival/departure pattern of the cars are affected from the seasonal effects. Therefore, this study is devoted to determination of arrive/departure pattern of the cars for several periods of a year. The results of this initial phase are later used to determine the seasonal impacts on the storage capacity of a PL.
Car arrival/departure data for a sample PL in Istanbul along January 2013-December 2016 period is provided by ISPARK. The format of the data is given in Table I. At first, arrival/departure times of the cars and daily arriving cars are determined for the weekdays of each month for the specified period.
TABLE I. ISPARKDATARECORDFORDAILYARRIVINGCARSTO APL
Arrival Departure
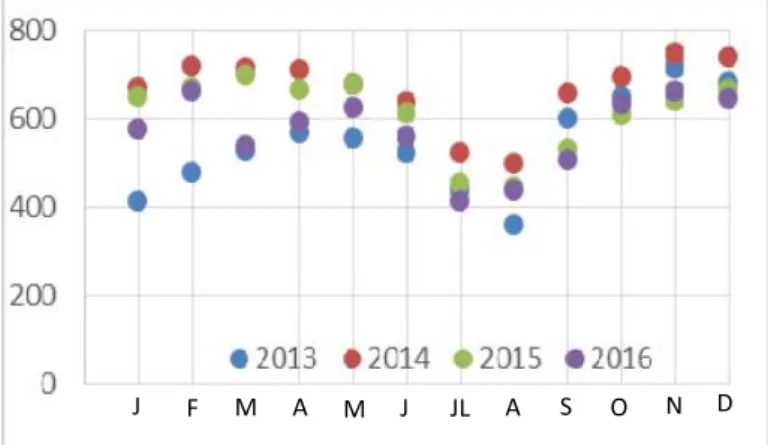
Date Time Date Time 6.10.2016 10:52:30 6.10.2016 17:42:13 6.10.2016 10:53:41 7.10.2016 20:13:41 6.10.2016 10:55:32 6.10.2016 19:12:13 Average number of arriving car in a day, from 07:00 a.m. to 00:00 p.m. for the specified period is illustrated in Fig.1 and
tabulated in Table II. It can be realized that the number of daily arriving cars increased in 2014 and then slightly decreased in 2015 and almost stabilized in 2016. In fact, PL capacity was decreased by 50 cars due to security reasons in 2015. Without loss of generality, we will use 2014 data where the average daily arriving cars are maximum for that year. On the other hand, the number of average daily arriving cars follow almost similar pattern along the year. It is high during November-April, then decreases during May-August and then again increases up to October. The year, therefore can be divided into three terms according to this behavior:
Term-1: November-April; crowded period
Term-2: May, June, September and October; moderate period Term-3: July, August; light period
Fig. 1: Daily average number of arriving cars to the sample PL. Fig. 1: Daily average number of arriving cars to the sample PL
TABLE II. DAILY AVERAGE NUMBER OF ARRIVING CARS TO THE SAMPLE PL.
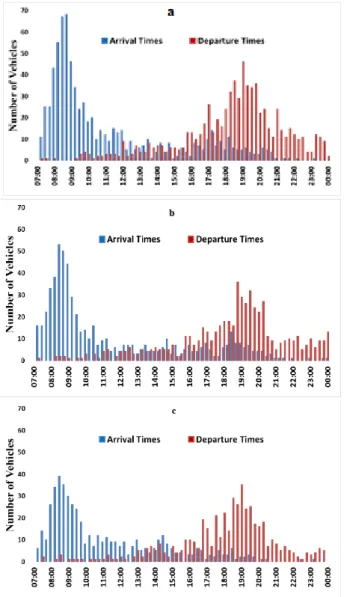
Then, arrival and departure time data for 2014 is processed and clustered in 15-minute time bins for each weekday. Fig. 2 shows car arrival and departure times in 15-minute time bins for the representative days of the aforementioned three terms. Although the numbers of daily arriving cars are different for the three terms, we can visualize from Fig.2 that the car arrival patterns of the terms follow almost the same pattern. There are some discordances in car departure times that will later be
Year→ Month↓ 2013 2014 2015 2016 January 413 670 650 576 February 480 720 670 663 March 527 714 700 540 April 568 710 667 592 May 557 680 680 627 June 525 640 615 560 July 437 525 454 413 August 361 500 444 439 September 602 660 530 508 October 650 697 610 635 November 715 750 642 661 December 682 740 665 645 J F M A M J JL A S O N D
improved by Kernel smoothing.
It was previously shown in [1] that the two-parameter Weibull probability density function, PDF, was the most appropriate one to model the arrival/departure times. 2-parameter Weibull PDF is expressed as,
Fig. 2: Car arrival and departure time distributions for sample days of the three terms in 2014
a) First term, b) Second term, c) Third term
(1) where, α and β show the shape and the scale parameters. Shape and scale parameters for each month are determined from the available data and are illustrated in Table 3, together with their statistics. When %95 confidence limits of each parameter value is considered, one can easily conclude that they are so closed to each other and a single pair can be used to model all the distributions along a year.
TABLE III. SHAPE AND SCALE VALUES OF 2-PARAMETER WEIBULL PDF Arriving data set Departing data set
Parameter→ Month↓ α β α Β January 1.00 16.80 4.85 50.90 February 1.00 16.88 4.82 50.93 March 0.98 15.68 4.76 50.42 April 0.98 16.30 4.81 50.84 May 0.99 15.90 4.79 50.35 June 0.99 16.53 4.86 50.66 July 1.04 17.22 5.27 50.09 August 1.03 16.63 5.24 50.07 September 0.99 15.90 4.90 49.98 October 1.00 16.00 4.85 49.95 November 1.00 16.33 4.88 49.94 December 0.98 16.80 4.67 50.00 Average 1.00 16.41 4.89 50.34 Standard deviation 0.02 0.45 0.17 0.38 At the final step, storage capacity of the PL for each term is calculated using sequential Monte-Carlo simulation, where several statistical and deterministic parameters are used. Statistical parameters are described with their probability density functions which were derived from the data provided by ISPARK. They are given below.
• The number of initial cars as 7:00 a.m., , is normally distributed. and σ for each term are given in Table IV. Initial EVs are assumed to be totally charged as 7:00 a.m., • The type of initial cars as 7:00 a.m. is expressed by binary
distribution. (1 = EV, 0 = ICE),
• Total number of daily arriving at the PL from 7:00 to 23:59 is normally distributed and and σ of each term are given in Table IV.
• Total capacity of the PL = 500 cars; 250 of them are equipped with V2G and G2V hardware
• Car arrival time ( ) follows Weibull distribution (α=0.99, β=16.60),
• Parking duration ( ) of each car is obtained using Kernel distribution whose algorithm and detailed explanation are given in [13].
• Departure time of each car is equal to
• The type of arriving/departing car ( ) is expressed binary selection. (1 = EV, 0 = ICE),
• Battery storage capacity of an EV = 25 kWh, • Energy consumption of an EV = 0.23 kWh/km, • Maximum charging power = 12.5 kW,
• The distance travelled by an EV when arrived at PL is normally distributed ( 30 km σ=15 km),
• SoC of EVs when arrived at the PL: is normally distributed ( 70% σ=15%),
• SoC of EVs while departing from the PL: Fully charged (100%). Average duration of a car at the PL is greater than 7 hours, which is long enough for full charging,
• Each EV is charged in accordance with an exponential distribution with a charging rate of α= 1.956 1/h, when arrived at the PL
TABLE IV. NORMAL DISTRIBUTION PARAMETERS FOR THE NUMBER OF AVAILABLE CARS AT 7.00 A.M. (N0) FOR EACH TERM
The number of available cars at the PL as 7.00 a.m.
Total number of daily cars from 7:00 to 23:59
σ σ
First Term 16 3 723 30
Second Term 17 3 667 50
Third Term 17 3 504 40
MC simulation is run one thousand times for each period using the aforementioned parameters under the following operating policies:
• There are 250 places in the PL for EVs, which are equipped with V2G and G2V facilities. Therefore, maximum number of individual EV storage is 250.
• If there is a vacant place in the PL, each arriving car will be accepted regardless of its type.
• EV and ICE parking locations can be used interchangeably when there is free parking area in one of them. If EV parking location is full and there is vacant place in ICE parking location, EV can be parked in ICE location, but its capacity cannot be used.
III. SIMULATION RESULTS
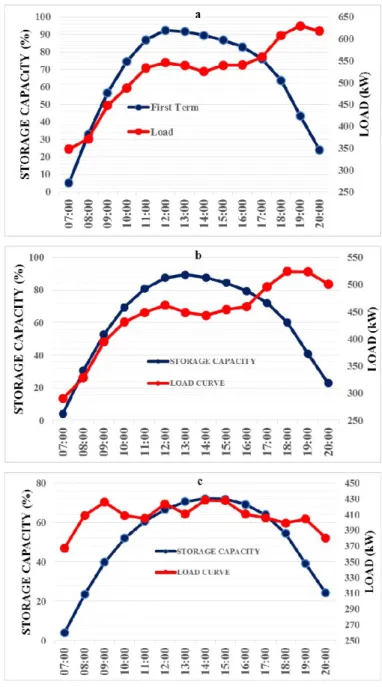
Average storage capacity of the PL at each day hour of the terms are shown in Fig. 3. Note that the storage capacity is expressed as a percentage of maximum PL storage capacity, which will simplify to adapt the simulation results for similar PLs have different car capacities as well as for different EV battery capacities.
Fig. 3: Average storage capacity of the PL
A fast check of the simulation results show that maximum available capacity of the PL is 92%, 89% and 72% for the first, second and the third terms, respectively. They are directly related with the number of daily arriving cars. On the other hand, peak storage capacity for the first and second terms are during noontime. However, this peak storage time for the third term (July, August) is achieved at around 2-3 p.m. It means that, we can make use of PL storage capacity during the
midday time for the 10 months in a year. However, the number of daily arriving cars during summer period should be increased to utilize the PL storage capacity for noon-peaks. Therefore, distribution companies should provide several incentives for the car owners that will motivate them to park their cars.
As stated above, in order to optimize the status of the PLs (scheduling charging and grid-supporting times) the storage capacity should be thought with the load duration curve of the distribution grid. Fig. 4 shows the average storage capacity and corresponding load variation curve along the day for the three terms.
Fig. 4: PL storage capacity and load variation a) First term b) Second term c) Third term
We can conclude that, under normal operating conditions when the conventional electricity tariff is valid, PL storage capacity can only be used for noon peaks of the grid. The cars
can be charged up to 10-11 a.m. and then the storage can be used up to 3 p.m. all the year besides July-August period. This will also improve the load consumption of the grid. However, it seems that the stored energy of the PL and the load duration curve are not convenient to use the PL as a storage asset. Moreover, charging process do not necessarily improve the load duration curve.
IV. CONCLUSIONS
This paper has presented the seasonal impacts on the storage capacity of the parking lots. Real-time car arrival/departure data for 2013-2016 period of a representative PL is used in the study. Stochastic parameters which affect the available storage capacity of the PL are determined for each month. The results showed that the months can be classified into three terms in terms of daily arriving cars. On the other hand, car arrival patterns are found to be similar and a single representative probability density function is used for all the months.
Simulation results showed that the available storage capacity of the PL is greater than 90% at weekdays for the first and second terms of the year. However, it decreases to 72% during summer time (July and August) due to lack of sufficient cars. Peak storage capacity for the first and second term are during noontime. However, this peak storage time for the third terms is achieved at around 2-3 p.m. It means that, we can make use of PL storage capacity during the midday time for the 10 months in a year. Nevertheless, changing drivers’ behavior due to the incentives of the distribution utilities or PL operators can increase the number of daily arriving cars during summer period and consequently PL storage capacity can be used for the noon-peaks.
Optimal operation of PLs (optimal scheduling of charging and grid-supporting times) are determined according to PL storage capacity, load duration curve and electricity tariff. Simulations showed that, under normal operating conditions when the conventional electricity tariff is valid, PL storage capacity can only be used for noon peaks of the grid. The cars can be charged up to 10-11 a.m. and then the storage can be used up to 3 p.m. all the year besides July-August period. This will also improve the load consumption of the grid. However, it seems that the stored energy of the PL and the load duration curve are not convenient to use the PL as a storage asset.
Note that this phase of the study is concerned with the charging phase of EVs while electricity tariff, discharging period, transmission limits, or physical restrictions are not considered. The study will later be extended those tasks in the future.
ACKNOWLEDGMENT
The authors would like to thank to ISPARK for their technical support.
REFERENCES
[1] S. Guner and A. Ozdemir, "Stochastic energy storage capacity model of EV parking lots", IET Generation, Transmission & Distribution, [Online]. Available:
http://digital-library.theiet.org/content/journals/10.1049/iet-gtd.2016 [2] M. Honarmanda, A. Zakariazadeha, and S. Jadida, "Self-scheduling of
electric vehicles in an intelligent parking lot using stochastic optimization", Journal of the Franklin Institute, vol. 352, issue 2, pp. 449-467, Feb. 2015.
[3] U. C. Chukwu and S. M. Mahajan, "V2G parking lot with PV rooftop for capacity enhancement of a distribution system", IEEE Trans. on
Sustainable Energy, vol. 5, no. 1, pp. 119-127, Jan. 2014.
[4] M. S. Kuran, A. C. Viana, L. Iannone, D. Kofman, G. Mermoud, and J. P. Vasseur, "A smart parking lot management system for scheduling the recharging of electric vehicles" IEEE Trans. on Smart Grid, vol.6, no.6, pp. 2942-2953, Nov. 2015.
[5] M. Honarmand, A. Zakariazadeh, and S. Jadid, "Optimal scheduling of electric vehicles in an intelligent parking lot considering vehicle-to-grid concept and battery condition," Energy, vol. 65, pp. 572-579, Feb. 2014. [6] C. Hutson, G.K. Venayagamoorthy, and K.A. Corzine, "Intelligent
scheduling of hybrid and electric vehicle storage capacity in a parking lot for profit maximization in grid power transactions", in Proc. Energy
2030 Conference Energy 2008.
[7] N. Neyestani, M.Y. Damavandi, M. Shafie-Khah, J. Contreras, and J.P.S. Catalão, "Allocation of plug-in vehicles' parking lots in distribution systems considering network-constrained objectives," IEEE
Trans. on Power Systems, vol. 30, no. 5, pp. 2643-2656, Sep. 2015.
[8] M. Rahmani-Andebili and G.K. Venayagamoorthy, "SmartPark placement and operation for improving system reliability and market market participation," Electric Power Systems Research, vol. 123, pp. 21-30, June 2015.
[9] A. Kavousi-Fard, M.A. Rostami, and T. Niknam, "Reliability-oriented reconfiguration of vehicle-to-grid networks", IEEE Trans. on Industrial
Informatics, vol. 11, issue 3, pp. 682-691, Apr. 2015.
[10] N.Z. Xu and C.Y. Chung, "Reliability evaluation of distribution systems including vehicle-to-home and vehicle-to-grid", IEEE Trans. on Power
Systems, vol. 31, issue 1, pp. 759-768, Feb. 2015.
[11] H. Farzin, M. F. Firuzabad, and M. Moeini-Aghtaie, "Reliability studies of modern distribution systems integrated with renewable generation and parking lots', IEEE Trans. on Sustainable Energy, vol. 8, issue 1, pp. 431-440, Aug. 2016.
[12] S. Guner and A. Ozdemir, "Distributed storage capacity modelling of EV parking lots", in Proc. 2015 International Conference on Electrical
and Electronics Engineering (ELECO 2015), pp.359-363.
[13] S. Guner, A. Ozdemir, and G. Serbes, "Impact of car arrival/departure patterns on EV parking lot energy storage capacity", in Proc. 2016
International Conference on Probabilistic Methods Applied to Power Systems (PMAPS 2016).
[14] D. Wu, D. C. Aliprantis, and L. Ying, "Load scheduling and dispatch for aggregators of plug-in electric vehicles", IEEE Trans. Smart Grid, vol. 3, no. 1, pp. 368–376, Mar. 2012.
[15] D. Wu, D. Aliprantis, and K. Gkritza, "Electric energy and power consumption by light-duty plug-in electric vehicles", IEEE Trans.
Power Systems, vol. 26, no. 2, pp. 738–746, May 2011.
[16] Z. Darabi and M. Ferdowsi, "Aggregated impact of plug-in hybrid electric vehicles on electricity demand profile", IEEE Trans. Sustainable Energy, vol. 2, no. 4, pp. 501–508, Oct. 2011.
View publication stats View publication stats