İSTANBUL BİLGİ UNIVERSITY INSTITUTE OF SOCIAL SCIENCES
INTERNATIONAL FINANCE MASTER’S DEGREE PROGRAM
RESERVE OPTIONS MECHANISM
Etem ÖZTEKİN 107664011
Prof. Dr. Cenktan ÖZYILDIRIM
İSTANBUL 2019
III TABLE OF CONTENTS ABBREVIATIONS IV LIST OF FIGURES V LIST OF TABLES VI ÖZET VII ABSTRACT VIII INTRODUCTION 1 LITERATURE 5 SECTION ONE 1.1. FACTORS AFFECTING ROM UTILIZATION 9
1.1.1. Cost Related Factors 9
1.1.1.1. Definitions 9
1.1.1.2. The Utilization Rate Implied by Breakeven ROC 11
1.1.2. Other Factors Affecting ROM Utilization Rate 12
1.2. EFFECTS OF ROM ON CBRT GROSS RESERVES 14
SECTION TWO EMPIRICAL FINDINGS ON FACTORS AFFECTING ROM UTILIZATION 2.1. DATA DESCRIPTION 17
2.2. EMPIRICAL FINDINGS 20
2.2.1. The Explanatory Power of Cost Related Factors 20
2.2.2. The Explanatory Power of Other Factors in 2018 35
CONCLUSION 48
IV
ABBREVIATIONS
AKP : Adalet ve Kalkınma Partisi
BDDK : Bankacılık Düzenleme ve Denetleme Kurumu BIST : Borsa İstanbul
BRSA : Banking Regulation and Supervision Agency CBRT : Central Bank of the Republic of Turkey ECB : European Central Bank
FC : Foreign Currency
FED : Federal Reserve (US central bank) OLS : Ordinary Least Squares
ROM : Reserve Options Mechanism ROC : Reserve Options Coefficient ROR : Reserve Options Ratio RR : Reserve Requirement TL : Turkish Lira
TSI : Turkish Statistical Institute USD : United States Dollar
V
LIST OF FIGURES
Figure 1. Evolution of For. Currency Reserve Options Coefficients (ROCs)…….3
Figure 2. FC ROM Utilization Rate of the Banking Sector...9
Figure 3. Effect of ROM on CBRT Gross Reserves (Bio USD)...15
Figure 4. Expected ROM Utilization (Cost Related Factors) Vs. Realization...20
Figure 5. Net Capital Flows – Emerging Markets...27
Figure 6. Net Capital Flows – Turkey (bio USD)...29
Figure 7. TL and USD Interest Rates (2012-2018)...30
Figure 8. CBRT Interest Rates...32
Figure 9. Regression Forecast and Realized ROM Util. Rate (Percent)……...40
Figure 10.TRYBASKET Currency and Realized ROM Util. Rate (2018)……...41
Figure 11.USD/TL Currency and Weight of FC Deposits in Total Deposits...43
Figure 12. Confidence Index and Realized ROM Utilization Rate (2018)...44
Figure 13. Turkey 5Y CDS Rate and Realized ROM Utilization Rate (2018)...45
Figure 14. Loan/Asset Ratio and Realized ROM Utilization Rate (2018)...46
Figure 15. Total Liquidity Ratio and Realized ROM Utilization Rate (2018)...47
Figure 16. TL And USD Interest Rates Vs. Realized ROM Util. (2018)……...49
VI
LIST OF TABLES
Table 1. Current Tranches and Coefficients for FX ROM...11
Table 2. Statistical Summary of Dependent Variable (Jul. 2012 – Dec. 2018)...17
Table 3. Regression Summary of Period-1 (Jul. 2012 – Sept. 2013)...23
Table 4. Regression Summary of Period-2 (Oct. 2013 – Dec. 2014)...24
Table 5. Regression Summary of Period-3 (Jan. 2015 – Dec. 2015)...26
Table 6. Regression Summary of Period-4 (Jan. 2016 – Dec. 2016)...28
Table 7. Regression Summary of Period-5 (Jan. 2017 – Dec. 2017)...31
Table 8. Regression Summary of Period-6 (Jan. 2018 – Dec. 2018)...33
Table 9. Statistical Summary of Dependent Variable (Jan. 2018 – Dec. 2018)....35
Table 10. One Factor Regression Summary (Jan. 2018 – Dec. 2018)…………...36
Table 11. Two Factors Regression Summary (Jan. 2018 – Dec. 2018)...37
VII ÖZET
REZERV OPSİYON MEKANİZMASI
Finansal piyasalarda yaşanan şoklardan dolayı sermaye akımlarındaki oynaklıkların Türkiye piyasalarına etkisini minimize etmek ve Türkiye Cumhuriyet Merkez Bankası (TCMB)’nın brüt döviz rezervlerini güçlendirmek amacıyla, TCMB tarafından 2011 yılında hayata geçirilen rezerv opsiyon mekanizması (ROM), zorunlu karşılık yükümülülüğüne sahip bankalara ve finansal kurumlara bu yükümlülüklerinin belirli bir kısmını yabancı para (YP) ve altın olarak tesis etme imkanı tanımaktadır.
Bu çalışmada ROM kullanım seviyelerini etkileyen faktörler incelenmekte, daha önceki çalışmalarda etkin çalıştığı konusunda şüphe duyulan ROM’un otomatik dengeleyici özelliğinin, 2018’de Türkiye piyasalarında yaşanan finansal çalkantı döneminde işlevini etkin bir şekilde yerine getirip getirmediği araştırılmaktadır. Bankacılık sektörünün ROM kullanımı davranışları incelendiğinde 2018 yılından önceki dönemde TL ve YP faiz oranlarının önemli rol oynadığı maliyet kaynaklı faktörler öne çıkarken, 2018 yılında yaşanan finansal çalkantı döneminde ise sektörün ROM kullanımı ile maliyet kaynaklı faktörler arasında önemli bir ilişki bulunamamıştır. İlgili dönemde çoklu regresyon analizi kullanılarak ROM kullanımını etkileyen faktörlerin Dolar TL kuru, Türkiye CDS oranı, banka bilançolarındaki verilen kredilerin ağırlığı, ekonomik güven endeksi ve bankacılık sektörü toplam likidite rasyosu olduğu sonucuna ulaşılmıştır.
Bu çerçevede 2018 yılında Türkiye piyasalarında yaşanan finansal çalkantı dönemi gibi dönemlerde bankacılık sektörünün ROM kullanımında dikkate aldığı faktörlerin, maliyet faktörlerinden ayrıştığı, bu sebeple de böyle dönemlerde ROM’un otomatik dengeleyici özelliğinin etkin bir şekilde çalıştığı sonucuna ulaşılmıştır.
Anahtar Kelimeler: Rezerv Opsiyon Mekanizması, Otomatik Dengeleyici Özelliği, Sermaye Akımları, Finansal Çalkantı, ROM Kullanımını Etkileyen Faktörler
VIII ABSTRACT
RESERVE OPTIONS MECHANISM
The reserve options mechanism (ROM) is a monetary policy tool adopted by the Central Bank of the Republic of Turkey (CBRT) to increase the efficiency of the gross reserves management and soften the possible negative effects of capital flows on the macroeconomic and financial stability. It allows banks or financial institutions, which are subject to reserve requirement, to keep certain portion of their TL reserve in foreign currency or in gold.
In this study, the factors affecting ROM utilization of banking system are investigated. The automatic stabilizing feature of mechanism which is suspected in previous studies is examined throughout this paper especially focusing on 2018 financial turbulence period. Breakeven ROC, which depends on the relative cost of Turkish lira versus foreign currency funding is the main determinant of ROM utilization in Turkey for the period between 2012 and 2017. Whereas in 2018, any significant correlation between ROM utilization and the breakeven ROC cannot be found in our analysis. Using step multiple regression analysis, we have found that the factors significantly explain ROM utilization in 2018 are USDTL exchange rate, Turkey CDS rate, loan to asset ratio in banking sector, total economic confidence index and total liquidity ratio of banking sector.
In this context, the result of the study indicates that during the periods like financial turbulence Turkish financial system experienced in 2018, the factors affecting ROM utilization differs from the cost related factors and this enables automatic stabilizing feature of mechanism to work efficiently.
Key Words: Reserve Options Mechanism, Automatic Stabilizing Feature, Capital Flows, Financial Turbulence, Factors Affecting ROM Utilization
1
INTRODUCTION
Following the Lehman Brothers crisis in 2008, central banks have introduced a variety of financial policy instruments to handle the challenges and comply with of the new financial world. The reserve options mechanism (ROM) is a monetary policy tool adopted by the Central Bank of the Republic of Turkey (CBRT) to increase the efficiency of the gross reserves management and soften the possible negative effects of capital flows due to financial shocks on financial and macroeconomic stability. Following the catastrophic period of 2008 financial crisis, major central banks such as Federal Reserve (FED) and European Central Bank (ECB) initiated expansionary monetary policies which cause large amount of foreign capital flows into emerging markets. Turkey was one of them and it was a new kind of challenge for the CBRT. Capital flows to Turkey may have some sort of imbalance problems for Turkish economy such as overvaluation of Turkish Lira (TL), increasing overheated economy due to the excessive credit supply of Turkish banks to the private sector, and thus widening the current account deficit.
One of the main purposes of CBRT was to reduce the financial fragility of the Turkish economic system and strengthen its reserves which would relieve the liquidity conditions in case of financial turbulences. Thus, ROM was expected to work as a stabilizer which would withdraw the excess liquidity in the market during capital inflow which would prevent possible problems such as currency overvaluation and current account deficit. On the other hand during capital outflows the ROM utilization was expected to be lower which would help financial system with additional liquidity which was previously parked at CBRT accounts.
ROM is an instrument that allows banks1 to hold a certain portion of TL reserve requirement in foreign currency (FC) or gold. This portion is defined by the CBRT
1 Banks and financing companies are subject to Reserve Requirement and also to ROM in Turkey. For the sake of simplicity “banks” refers to all banks and financial institutions subject to ROM.
2
and can be changed in time according to the capital flows, liquidity conditions, interest rate levels and monetary policy of the CBRT.
According to ROM mechanism, the banks which prefer to use this option, have to hold more in USD, EUR2 and/or gold3 compared to original TL required reserve amount. Reserve Options Coefficient (ROC) is the amount of foreign currency or gold that a bank must keep at its CBRT account instead of one unit of TL required reserve. For instance if the ROC is set as 3 and the original TL reserve requirement amount is 1 TL, then the banks which utilize ROM are expected to keep 3 TL equivalent of FC or gold instead of keeping RR in TL.
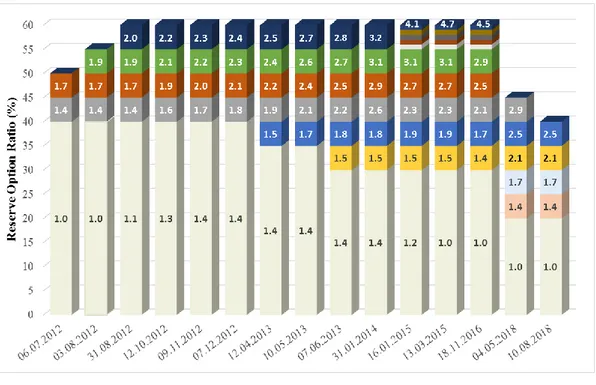
Figure 1. Evolution of Foreign Currency Reserve Options Coefficients (ROCs)
2 CBRT has taken EUR out of ROM mechanism on 15th Aug, 2014. From this date on, banks have been allowed to keep USD and/or gold in ROM mechanism. 3 ROM does not only allow banks to keep reserve requirement in foreign currency but also in gold instead of TL. As banks highly prefer to adjust the utilization ratio of foreign currency ROM instead of gold ROM due to the liquidity levels of the markets and differences in coefficient variations, we will be investigating the foreign currency ROM rather than gold.
3 Source: CBRT
Figure 1 shows the change in reserve options coefficients between July 2012 and December 2018. Each color in graph represents a different ROC tranche. For example as of July 2012, a bank must keep 1 TL equivalent of FC instead of 1 TL reserve requirement up to %40 of the total TL requirement. For the next tranche of %5, it must keep 1.4 TL equivalent of FC instead of 1 TL reserve requirement. And for the last tranche of %5, it must keep 1.7 TL equivalent of FC instead of 1 TL requirement.
CBRT has changed the maximum reserve option ratio and reserve option coefficients according to the capital flows, liquidity conditions and the pace of credit growth in time.
CBRT’s main purpose of adopting ROM was to minimize the adverse impacts of financial shocks and/or capital flows on domestic economy. That’s why it set ROC as an increasing function of the reserve option ratio. The main assumption here is that banks would adjust their ROM utilization depending on their constraints (such as liquidity, balance sheet ratios and etc.) and objective functions (such as cost of
4
TL and FC funding, foreign exchange rates and etc.). For example during capital outflows, FC funding costs would increase and this would motivate banks to utilize less ROM by starting to release from the most costly tranches. As a result of less ROM utilization, demand for FC would decrease and this would help to provide smoothing the effects of financial shock and/or capital outflows on domestic economy.
In the early stages of ROM adoption, the idea above was more a theory and did not say much about mechanism’s probable reaction to changes in other macro variables or different types of shocks. The previous papers had mostly investigated 2012-2014 periods and tried to find an answer to this question by shedding light on the factors affecting FC ROM utilization rate. By understanding the factors, they tried to find out what would be the banks’ ROM utilization behavior when financial and economic environment changes. One important finding is about automatic stabilizing feature of ROM. The previous researches concluded that significant changes in ROM usage of banking sector are mainly driven by the changes in CBRT’s TL interest rates. As expected, central banks’ first reaction to capital outflow is to rise short term interest rate level of local currency which encourages banking sector to increase ROM utilization due to cost advantage of FC funding. At the end of the day, CBRT’s interest rate policy action in case of significant capital flows may weaken ROM’s stabilizing feature4
.
Our study aims to investigate the ROM utilization in Turkey between 2012 and 2018 periods. By better understanding of the relation between ROM utilization and other factors as well as cost related factors, automatic stabilizing feature of ROM will be investigated mainly concentrating on 2018 financial turbulence period.
LITERATURE
5
As stated in the introduction section, ROM has been introduced in the last quarter of 2011 and from that date the mechanism has been incessantly in practice. During the adoption and development processes many researches has been written about ROM. These studies can be categorized into two blocks.
First block is more focused on the theory of ROM which mainly describes the mechanism, its aims and the factors affecting ROM utilization rate.
Alper, Kara & Yörükoğlu (2013) firstly introduced ROM and ROCs. Then they explained breakeven ROC by studying the determinants of ROM utilization decision. Conceptually they pointed out what is expected from the mechanism during capital inflows/outflows. They concluded that ROM is expected to be a beneficial monetary instrument to strengthen macroeconomic and financial stability. Whereas as it was almost the beginning of the implementation of mechanism, they admitted that they had not have enough chance to test how the mechanism would work in practice in cases of different types of shocks.
Küçüksaraç & Özel (2012) calculated the breakeven ROCs for different funding alternatives in their research named Reserve Options Mechanism and Computation of Reserve Options Coefficients. They stated that the breakeven ROC mainly depends on TL and FC funding costs, foreign liabilities’ RR ratio, USD London Interbank Offered Rate (LIBOR) and TL swap rates. And finally they observed that ROM utilization has the most significant correlation with the movement in foreign borrowing spreads which implies mechanism’s high potential to act as an automatic stabilizer.
Sahin, Dogan & Berument (2015) studied the effectiveness of the reserve option mechanism as a macroeconomic prudential tool in Turkey. Their empirical evidence suggest that the ROM decreases the effects of capital flows. Moreover the effects of capital flows on interest rate and exchange rate also decrease with a higher ROM usage. Thus, they concluded that the existence of the ROM might be used as one tool the central banks of small open economies may use to decrease the effects of capital flows on financial markets.
6
B. Demirhan (2013) studied the effects of monetary policy instruments such as reserve requirements, ROM and asymmetric interest rate corridor that CBRT applied in last a few years. She explained the details of these instruments and stated that they effect on financial stability by the channels of liquidity support, risk taking, bank capital, and credit.
Aslaner, Çıplak, Kara & Küçüksaraç (2015) aimed to find out the factors affecting the usage of reserve options mechanism in Turkey. They tried to find an answer to the question of “Does ROM work as an automatic stabilizer?” They have reached to some important empirical findings. Firstly they investigated which TL interest rate has more relation with ROM usage. For this purpose, using alternative types of TL interest rates (BIST o/n repo, CBRT 1w repo, CBRT overnight lending and CBRT weighted average cost of funding) and interest rates of FC deposits, they compute expected ROM usage level implied by the breakeven ROC. Then using Ordinary Least Squares estimation, they tried to clarify the index which has the most explanatory power on actual ROM usage rates. Regression results show that CBRT wacf and BIST o/n repo rate are statistically significant in explaining the realized ROM usage rate. The last finding was about automatic stabilizing feature of ROM. They stated that FX deposit rates variability are quite low and almost all the movement in breakeven ROC comes from the changes in TL interest rates. This result indicates that significant changes in ROM usage of banking sector are mainly driven by the changes in CBRT’s TL interest rates. These findings imply that the change in CBRT’s policy rates as a respond to any possible shock may lower the success of automatic stabilizer effects of the mechanism, since banking sector would prefer to utilize higher rates of ROM utilization.
M. E. Bocuoglu (2015) studied the effects of ROM together with CBRT’s interest rate and reserve requirement policies on banks’ balance sheets. He stated that the use of ROM is a very attractive option in terms of the cost advantage for banks, and this cost advantage is the most effective factor for banks to use this tool intensively. Tuna A., Öner S. & Öner H. (2015) examined the process of the Reserve Options Mechanism and cost advantages for Turkish banking system in case of optimal use.
7
They found that at optimal level, the yearly cost advantage of ROM utilization for banking sector is approximately 2.5 Billion TL.
Second block was more interested in the influence of reserve options mechanism on credit growth, credit volatility, exchange rate and money multiplier. Oduncu, Ermişoğlu & Akçelik (2013) wrote a paper named “The new instrument of the Central Bank reserve options mechanism and fx volatility”. They compared the exchange rate volatility in the periods before and after the ROM was implemented using GARCH method. Their analysis indicated that ROM has a significant status in lowering the exchange rate volatility in the studied period.
Another paper on this block is written by Değerli & Fendoğlu in 2013 named “Exchange rate expectations and CBRT monetary policy”. Using implied expectations data from FC options, they compared Turkey and other similar EM economies in terms of volatility, skewness and kurtosis of TL against USD. They argued that these financial variables have fallen after reserve options mechanism and asymmetric interest rate corridor started to be implemented.
Effect of ROM on exchange rate volatility is also studied by I.Y.Gok in 2016. Using GARCH (1,1) model, he concluded that ROM significantly decreases the exchange rate volatility and he stated that ROM is a more efficient tool than interventions while decreasing the volatility.
“Reserve options mechanism and exchange rate volatility: An implementation for Turkey” is written by Kantar in 2017. In this study, the effect of ROM on exchange rate volatility is examined. In this context, the effect of GARCH approach and ROM on exchange rate volatility has been investigated during 2011 and 2016 period. The result of the study indicated that ROM has statistically a power on reducing the volatility in exchange rates. The paper suggest that economies similar to Turkish economy in terms of size and vulnerability to short term capital flows may use ROM in order to provide financial stability.
Aktürk, Göçen & Duran studied the money multiplier impacts of Reserve Options Mechanism in 2015. They reported that ROM has an increasing effect on the
long-8
run trend of the multiplier. In addition to this they concluded that ROM has side effects such as declining in volatility in monetary system which ensures better financial stability.
Alper, Binici, Demiralp, Kara & Özlü (2014) studied on reserve requirement, liquidity risk and credit growth. They identify that lending behavior of banking sector has a significant correlation with reserve requirements and liquidity positions.
SECTION ONE 1.1. FACTORS AFFECTING ROM UTILIZATION 1.1.1. Cost Related Factors
1.1.1.1. Definitions
Each bank solely decides its own ROM utilization level considering some factors. These factors can be categorized into two parts. First part is composed of cost related factors which are mainly about banks’ local and foreign currency funding costs. Second part is more related to other factors such as liquidity conditions, exchange rate movements, global risk appetite and etc. Considering all these
9
factors, banks decide the portion of TL reserve requirement that they will keep in foreign currency. ROM utilization rate for the sector is an indicator of how deeply reserve options mechanism is used by banking sector.
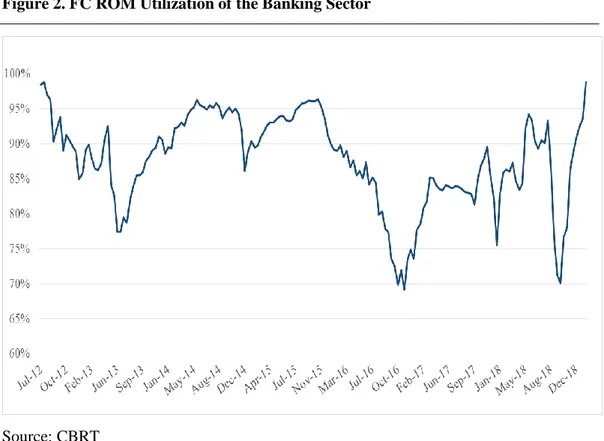
Figure 2. FC ROM Utilization of the Banking Sector
Source: CBRT
When we look at the changes in total ROM utilization rate of the banking sector, we see that there are many fluctuations across time. Figure 2 shows the aggregated ROM utilization rate of the banking sector between 2012 and 2018. We see that it has been fluctuated roughly between %70 and %100 in studied time period. Both internal and external macroeconomic and political circumstances have been experienced during this period. They have both affected the banks’ ROM utilization decisions on the upside or downside directions. These circumstances will be investigated in further sections comparatively with the ROM utilization rate. As it was stated in introduction part, one of the most important aim of ROM adoption is the automatic stabilizing aspect of ROM. In order to clarify if the
10
automatic stabilizing role works effectively, it is crucial to find out the factors affecting the ROM utilization. This will also assist us to understand how the mechanism will behave in respond to different shocks.
Cost related factors are the most important factors affecting utilization rate of reserve options mechanism. It is approximately relative cost of TL funding to FC funding. ROCs which are designated and established by CBRT are also significant in calculating the cost of ROM. Reserve requirement ratios for TL and foreign currency are the third important factors that are used in cost of ROM. Final determinant of ROM cost is remuneration paid by CBRT to banks in return for the reserve amounts that banks keep in CBRT accounts. CBRT has been paying remuneration for TL reserves since 07/11/2014 and for FC reserves since 08/05/2015. Starting from those dates, TL and FC remuneration rates have also taken place in calculation of breakeven reserve option coefficient.
Breakeven rate is the coefficient banks feel indifferent between utilizing and not utilizing the reserve option facility. It can be approximately calculated by using these six determinants.
In the equation ROCB represents breakeven ROC. RRFC and RRTL represent FC and TL reserve requirement ratio, rTL and rFC represent TL and FC interest rates. Lastly rTL;RR and rFC;RR represent TL and FC reserve requirement remuneration rates respectively.
1.1.1.2. The Utilization Rate Implied by Breakeven ROC
Breakeven ROC is mainly the ratio of cost of keeping RR in Turkish Lira to the cost of keeping RR in foreign currency. If we assume that RR ratios and remuneration rates do not change in the short run, main determinants of the breakeven ROC are the Turkish Lira funding rate and foreign currency funding rate. Banks are expected to utilize the tranches with the coefficients lower than the breakeven ROC. As keeping RR in foreign currency would be more costly than
11
keeping RR in Turkish Lira, banks are not expected to utilize the tranches if the coefficient of that tranche is over the break-even ROC.
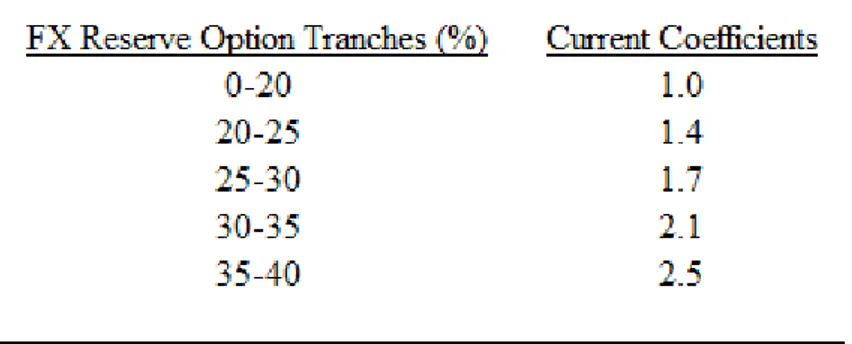
Table 1. Current Tranches and Coefficients for FX ROM
To formulize the rational utilization rate with the current ROCs and tranches, the utilization rate should be 0% if the breakeven ROC is smaller than 1.0; it should be 20% if the breakeven ROC is between 1.0 and 1.4; it should be 25% if the breakeven ROC is between 1.4 and 1.7; it should be 30% if the breakeven ROC is between 1.7 and 2.1; it should be 35% if the breakeven ROC is between 2.1 and 2.5; it should be 40% if the breakeven ROC is bigger than 2.5.
Reserve option coefficients are step functions which means any small change in breakeven ROC does not lead to a variation in actual utilization rate which may cause a complication in regression models. “Expected ROM Utilization Rate Index” is constructed to overcome this complication. This index shows the usage rate which breakeven ROC implies. The rational formulation above is used in the construction process. For example if the breakeven ROC is calculated as 1.9 (with currency tranches and ROCs stated in Table 1), although the interpolated utilization rate is something between 30% and 35%, banking system would utilize up to 30%. Because the breakeven ROC should have been bigger than 2.1 for system to utilize more than 30%. That’s why the expected ROM utilization index is calculated as 30% in this case.
The expected ROM utilization rate which is computed using cost related factors is expected to be the main explanatory variable of the realized ROM utilization.
12
1.1.2. Other Factors Affecting ROM Utilization Rate
In addition to cost related factors, there are also some other factors affecting ROM utilization rate. Liquidity is one of them. Banks need to consider their liquidity conditions while deciding their ROM utilization levels. Although breakeven ROC (computed via cost related factors) implies a certain utilization level, the liquidity conditions at that point may obstruct the utilization of that ROM level. So there may be periods where realized utilization rate is smaller than expected due to liquidity shortage. The previous researches have only taken the foreign currency liquidity into account propounding banks need FC funds to utilize reserve options mechanism. We will be investigating the effect of total liquidity on ROM utilization instead of foreign currency liquidity. Because of the reserve options coefficients, a bank which uses ROM facility has to keep more liquidity in total at their CBRT accounts compared to non-using ROM facility scenario. Under the assumptions of current tranches and coefficients levels stated in Table 1, a bank which fully utilizes ROM facility at 40%, has to keep 1.46 times more liquidity at CBRT accounts than the case of that bank utilizes ROM facility at 20%. That’s why banks, in practice, consider total liquidity conditions while deciding ROM utilization rate. They consider not only the current liquidity conditions but also the future expectations. When the leading indicators, for instance, started to be deteriorated in an economy, treasury departments of the banks increase the frequency of preparing contingency funding plan reports. Releasing ROM and using the additional liquidity that is parked at CBRT account is one of the most important possible action of banks in cases of liquidity crisis.
Exchange rates are also expected to affect ROM utilization rate. In theory exchange rate movements do not have any direct impact on breakeven ROC as the cost of TL or FC funding does not change according to the exchange rate levels. On the other hand it can affect the ROM utilization via liquidity channel. When TL appreciates, TL equivalent of FC reserves already parked at the CBRT decreases. At that point banks have two choices. First one is to send additional FC reserve to CBRT to be able to keep the original ROM utilization rate. But if there is any liquidity constraint
13
then second choices may come into prominence which is to decrease ROM utilization level. It should be noted that the option for the use of EUR in reserve options mechanism has been revoked in August 2014. In our analysis we take both USDTRY and EURTRY movements between 06/07/2012 and 01/08/2014 and only USDTRY between 15/08/2014 and 28/12/2018. In addition to exchange rate movements, the change in exchange rate volatility will also be tested in this research.
As we stated above CBRT’s main aim of adopting ROM was to minimize the effects of financial shocks and/or capital flows on domestic economy. So it is clear that the relationship between ROM utilization rate and global risk appetite should also be investigated. VIX is a good indicator of global risk appetite. It is the Chicago Board Options Exchange Volatility Index which reflects a market estimate of future volatility based on weighted average of the implied volatilities for a wide range of strikes. Investors, research analysts and portfolio managers look to VIX values as a way to measure market risk, fear and stress before they take investment decisions. In a sense, ROM utilization is an alternative way of asset allocation for banks. They may prefer to use their funds directly to extend loans instead of utilizing ROM. Loan extension may also be in FC loans or TL loans using swaps if needed. So the willingness of banks to give loans in their balance sheet should also be taken into account in this research. In this context, ratio of loans to asset size is also included as an additional independent variable.
Capital flows is an important dimension of reserve option mechanism. Under normal market conditions, capital flows to a country is expected to have a negative correlation with riskiness level of that country. Moreover banks’ perspective and liquidity necessities may also substantially changes with the riskiness level of the economy. In order to capture the effects of riskiness level, we include Credit Default Swap Spreads of Turkey into investigation. CDS spreads have direct proportional relationship with the risk associated by the market/investors to the underlying assets. Markets react to unfavorable news by increasing the spreads and to favorable ones by decreasing the spreads.
14
Economic confidence may also have significant effect on banks’ ROM utilization decisions as encapsulates consumers’ and producers’ evaluations, expectations and tendencies about general economic situation. 5 Turkey total economic confidence index is combined by means of a weighted aggregation of normalized sub-indices of consumer confidence, seasonally adjusted real sector (manufacturing industry), services, retail trade and construction confidence indices. The economic confidence index indicates an optimistic outlook about the general economic situation when the index is above 100, on contrary it indicates a pessimistic outlook when it is below 100.
1.2. EFFECTS OF ROM ON CBRT GROSS RESERVES
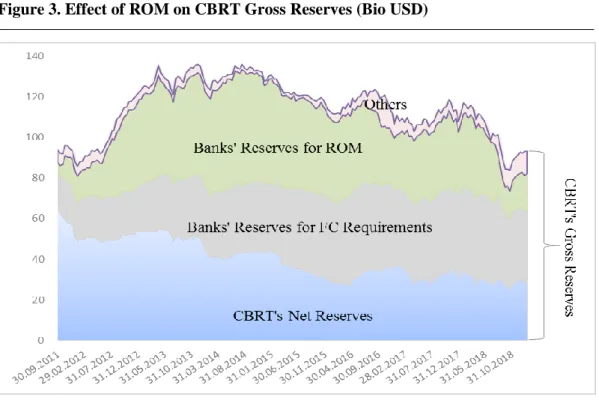
One of the other main motivations of implementing ROM is to increase the gross reserves of CBRT. Figure 3 shows the effects of reserve held by banks through ROM on CBRT’s gross reserves.
Figure 3. Effect of ROM on CBRT Gross Reserves (Bio USD)
Source: CBRT
15
The adoption of ROM has increased the gross reserves of the CBRT but did not have an impact on net reserves. Figure 3 shows that gross reserves have increased gradually after the introduction of ROM in last quarter of 2011, while net reserves displayed a flat course. As private sector in Turkey holds the most of the external debt compared to public sector, the rise in CBRT’s gross reserve thanks to ROM increases the resilience and the efficiency of the financial system. Actually this is also confirmed by the movement in CBRT’s gross and net reserves in the second half of 2016 (coup attempt in Turkey) and in the second half of 2018 (financial turbulence in Turkey). After the coup attempt, ROM utilization rate decreased from 50.7% in 15th of July 2016 to 41.5% in 18th of November 2016 as it can be seen in Figure 2. Similar movement has seen in financial turbulence in 2018. After the turbulence had spiked in August 2018, ROM utilization rate has decreased gradually from 40.5% in 27th of July 2018 to 28.0% in 5th of October 2018. CBRT’s gross reserves have also displayed similar movement in relevant periods. As banks have released some portions of their ROMs, CBRT’s gross reserves have decreased substantially while net reserves were more resilient in same periods. In other words, the excess liquidity which is parked by banks to their accounts in CBRT through ROM played a critical role in both financially volatile periods in 2016 and 2018 years. By releasing ROM, banks had able to create extra liquidity which helped them to pass distressed period more smoothly. We also observe that when the volatility and liquidity risks in financial markets decreased, banks started to increase ROM utilization again and this reflected positively on CBRT’s gross reserves as well.
16
SECTION TWO
EMPIRICAL FINDINGS ON FACTORS AFFECTING ROM UTILIZATION
2.1. DATA DESCRIPTION
Our sample data for the empirical analysis starts from 2012, June because it was the date when ROCs were initially started to differentiated from one. The final date for our sample is December 2018 which indicates the latest available data that we can gather for this research.
The statistical summary of dependent variable (realized ROM utilization rate) for the investigated period (2012 - 2018) is as follows:
17
Table 2. Statistical Summary of Dependent Variable (Jul. 2012 – Dec. 2018)
The length of the reserve maintenance periods in Turkey is two weeks. The liabilities subject to reserve requirements are calculated on Friday in every two weeks. Friday is also the first day of reserve maintenance period. Banks have 2 or 3 days to decide and inform CBRT about their ROM utilization levels before the new maintenance period starts. Under the lights of this information, the frequency of the data is decided as two weeks which is the same frequency with reserve maintenance in Turkey. So there are 170 observations from July 2012 to December 2018 in our empirical analysis.
First part of the analysis try to find an answer to how much of the realized utilization rate can be explained by the cost related variables. We need to calculate breakeven ROC for each 170 observation. This will bring us to expected ROM utilization rate. The explanatory power of cost related factors will be investigated in next sections by testing the relationship of realized and expected ROM utilization rates.
CBRT reports the statistics of actual ROM utilizations periodically on its website under the section named ‘Required Reserve Data Set’. We can reach maintenance periods, maximum ROM facility rates, realized utilization rates and weighted average reserve requirement ratios for TL and for foreign currency which are all used in our empirical analysis in ‘Required Reserve Data Set’. Remuneration rates applied to required reserves in TL and in foreign currencies are also gathered from CBRT.
Liquidity adequacy ratio for the banking sector is reported by Banking Regulation and Supervision Agency (BRSA) on the monthly basis. 7 days, 1 month, 3 months and 12 months ratios are calculated and reported by BRSA. As similar ratio named Basel Liquidity Coverage Ratio (LCR) is interested in liquidity conditions in one
Num. of observations 170 Mean 89.02%
Min 70.00% Mod 91% - 95% - 97%
Max 100.00% Mod Frequency 13
Std. Deviation 6.63% Median 90.28% - 90.37%
18
month period, the market practice is looking at 1 month liquidity ratios before taking actions such as ROM utilization. That’s why we take 1 month liquidity adequacy ratio data.
Exchange rates are also gathered from CBRT. As banks decide ROM utilization 2 days before the start of maintenance period, exchange rates are also taken as of dates 2 days before the start of maintenance periods. Same logic is applied for VIX and CDS (5 year USD CDS) as well. VIX index and CDS spread data as of dates 2 days before the start of maintenance periods are gathered via Bloomberg.
Data source of banking sector’s loan size and asset size is CBRT. They have been reported on monthly basis by CBRT. We have computed the ratio of loans to balance sheet size for each month of the reserve maintenance period.
USDTRY 1 month at the money implied volatility is a measure of the market expected future volatility of USDTRY exchange rate until 1 month maturity date. The future volatility is the single undeterminable variable in the common Black Scholes option pricing model. Bloomberg ATM implied volatilities which we used in our analysis can be used to obtain the correct Black Scholes price for a delta neutral straddle struck at maturity.
Turkey total economic confidence index is a type of economic sentiment indicator which tracks overall sentiment in an economy. This index is constituted and reported by Turkish Statistical Institute. It is derived from the results of both consumer and business surveys.
There are various Turkish Lira interest rates for different types of funding sources for banks. Aslaner, Çıplak, Kara and Küçüksaraç (2015) tried to find which TL interest rate represents the funding costs of the banks. They run a reverse engineering empirical analysis. They first calculated the expected utilization rates implied by the breakeven reserve option coefficient for different funding sources. Next, using empirical analysis, they tried to find out which type of interest rate is more successful in explaining the realized ROM utilization rate. CBRT average funding rate is selected as statistically the best explanatory variable of realized
19
ROM utilization rate among all other funding rates such as BIST o/n repo rate, swap rate, CBRT 1 week repo rate, TL deposit rate and CBRT o/n lending rate. As it is statistically significant and its explanatory power is more than others, we will use CBRT average funding rate as TL interest rate in our empirical analysis.
Like Turkish Lira, banks have different types of funding sources in foreign currencies as well. Deposit has a high density in the total FC funding of the banking system and we can reach its time series data. On the other hand there are also other funding sources from abroad such as syndication loans, securitization loans, Eurobond issues and etc. But due to the lack of time series data for these alternative funding sources, we have chosen foreign currency deposit rates up to 3 months maturity. Interest rates of new production deposit rates are reported on the weekly basis by CBRT.
2.2. EMPIRICAL FINDINGS
2.2.1. The Explanatory Power of Cost Related Factors
In order to find the explanatory power of cost related factors on ROM utilization rate, we calculate breakeven ROC and the expected ROM utilization rates using Turkish Lira funding rate (CBRT average cost of funding), foreign currency funding rate (deposit rates up to 3 months maturity), Turkish Lira reserve requirement ratio, foreign currency reserve requirement ratio, Turkish Lira reserve requirement remuneration rate and foreign currency reserve requirement remuneration rate. Then using OLS estimation we try to see how successful realized utilization rates are explained by the cost related factors. The dependent variable is realized utilization rate and explanatory variable is expected utilization rate in our regression.
20
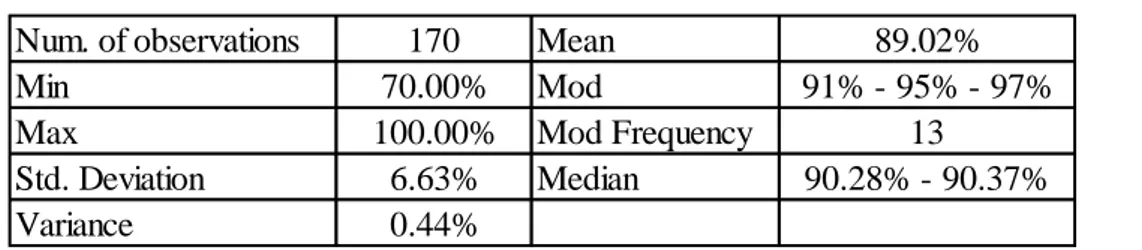
Figure 4. Expected ROM Utilization (Cost Related Factors) Vs. Realization
Source: CBRT
Figure 4 shows the historical movements of realized ROM utilization rate and expected ROM utilization rate which is implied by the breakeven ROC calculated using cost related factors. We can state that both movements of the two series display parallel movements in general. However, there are still significant differences between expected utilization implied by breakeven ROC and realized utilization in some periods.
Figure 4 indicates that realized ROM utilization rate has over performed compared to expected ROM utilization rate in some periods like starting from 2015-first quarter till 2016-second quarter. On the other hand in the period starting from 2014-first quarter till 2014-end and also period starting from 2017 2014-first quarter till 2018-end realized ROM utilization rate has underperformed compared to expectations. Period starting from 2012 July till 2013 July, realization was almost the mimic of the expected data. Turkey has experienced many financial and political events both domestically and globally during these periods. So it make more sense to divide our
21
sample data into different periods and interpret the statistical results together with the important financial and political events experienced in local and global markets. Integrated interpretations on the explanatory power of cost related factors under different financial and political environments are expected to turn the light on other factors which may affect ROM utilization rate in Turkey.
First investigated period starts in July 2012 and ends in September 2013. Before starting to analyze this period, it will be enlightening to summarize the important local and global economic/political goings-on took place in the period of time before 2012.
Between 2002 and 2007, the country's economy grew at an annual rate of average 7.2%. Turkey also performed relatively well throughout the global financial crisis: after a slowdown in GDP growth to just 0.6% in 2008 and a subsequent recession (which saw a 4.6% contraction in GDP), the economy strongly rebounded, producing 8.8% growth in 2010 and 9.2% in 2011. The economic success was partly the result of a series of reforms initiated by Economy Minister Kemal Derviş in the aftermath the 1999-2001 economic crises, and partly thanks to the 2000-2001 IMF stabilization programmes. These reforms were continued by the Justice and Development Party (AKP) after the party secured a parliamentary majority in the 2002 elections, which stabilized the country’s political scene and created the right conditions for implementing reforms. The government began the privatization of loss-making state-owned enterprises, which resulted in an unprecedented inflow of foreign direct investment. It also carried out a successful reform of the banking system, which protected it against the fallout from the global financial crisis. In addition, Turkey adopted a floating exchange rate system, lifted restrictions on foreign capital inflows, tightened fiscal discipline, increased the independence of the Central Bank, and stabilized inflation. The Turkish economy also benefited from objective conditions: its geographical location, namely, its proximity to EU markets, as well as from a growing population. Turkey has also capitalized on the upward economic trend in other parts of the world and on the launch of accession
22
talks with the EU, which have been a catalyst for further reforms and have had a positive influence on the perception of the country among foreign investors. We had passed to 2012-2013 term under such local and global economic/political circumstances. Turkey’s 2012 year-end CPI was 6.16% which is the lowest rate in last 25 years. In May 2013, Turkey’s credit rating was upgraded by Moody’s to Baa3 which is investment grade. Turkey 2Y Benchmark rate improved to 4.81% which is the all-time low. On the international politic side, positive agenda launched, intended to bring fresh dynamics into the EU-Turkey relations.
Table 3. Regression Summary of Period-1 (July 2012 – September 2013)
ROM it = 43.940 + 0.522 EROM it
SUMMARY OUTPUT
Regression Statistics Regression Statistics
Multiple R 0.860 R Square 0.739 Adjusted R Square 0.730 Standard Error 2.949 Observations 33 ANOVA df SS MS F Significance F Regression 1 762.221 762.221 87.657 0.000 Residual 31 269.559 8.695 Total 32 1,031.781
Coefficients Standard Error t Stat P-value Lower 95% Upper 95%
Intercept 43.940 4.870 9.022 0.000 34.0072 53.8733 Expected Utilization Index 0.522 0.056 9.363 0.000 0.4080 0.6353
23
In the model, “ROM” represents the realized ROM utilization rate, “EROM” represents expected ROM utilization rate. Regression results for Period-1 (July 2012 – September 2013) show that the expected ROM utilization index calculated using CBRT average funding rate, foreign currency deposit rates up to 3 months maturity, TL and foreign currency reserve requirement ratios and Turkish Lira and foreign currency reserve requirement remuneration rates are statistically significant in explaining the realized utilization rate. This period differentiates from other periods in terms of the explanatory power. The index calculated by same explanatory variables (cost related factors only) has more explanatory power in the first period than other periods.
Thanks to strong economic fundamentals, reform agenda and net capital inflows, banking sector had chance to consider nothing other than cost related factors while deciding ROM utilization level during 2012-2013 period which clarifies high explanatory power of expected ROM utilization on realized ROM utilization. As it is seen in Figure 7, TL and foreign currency interest rates had decreased significantly between July 2012 and June 2013. CBRT weighted average cost of TL funding rate was 4.53% as of June 2013 which was the all-time low. Thus keeping reserves in TL became cheaper than keeping in foreign currency which gave rise to lower level of expected and realized ROM utilization rates.
24 ROM it = 64.284 + 0.314 EROM it
Starting from mid-2013, Turkish economy had experienced some distressed periods which partially arisen from social & political happenings. At the end of May 2013, Gezi Park protests took place which is followed by FED’s signals about end of stimulus policy, known as quantitative easing. Domestic and global events started to show their effects on Turkish economy at the second half of 2013. USDTRY peaked to 1.9564 which was the all-time high as of June 2013. CBRT took actions such as raising interest rates and additional monetary tightening by selling USD to market against TL.
At the end of 2013, 17-25 December corruption investigation took place in Turkey. At the same time FED started to decrease the monthly quantitative easing amount from 85 bio USD to 75 bio USD in December 2013 and ended the stimulus program in October 2014. It was new record for USDTRY at 2.38 and for EURTRY at 3.26 in January 2014. Political agenda was also quite hectic in 2014. A local and a presidential election took place in March and in August respectively.
Those were the days Turkish economy had begun to be criticized by international financial authorities. Its credit rating watch was changed from stable to negative by Moody’s and S&P in 2014. Moody’s criticized Turkey in terms of economic
SUMMARY OUTPUT
Regression Statistics Regression Statistics
Multiple R 0.822 R Square 0.676 Adjusted R Square 0.665 Standard Error 1.700 Observations 32 ANOVA df SS MS F Significance F Regression 1 180.706 180.706 62.519 0.000 Residual 30 86.713 2.890 Total 31 267.419
Coefficients Standard Error t Stat P-value Lower 95% Upper 95% Intercept 64.284 3.794 16.942 0.000 56.5351 72.0331 Expected Utilization Index 0.314 0.040 7.907 0.000 0.2326 0.3946
25
slowdown, high inflation, external fragility and independency of important institutions such as CBRT.
Figure 3 shows the reflections of economic and political distresses on ROM utilization rate. Turkish banking system preferred to utilize less ROM rate than what breakeven ROC implied. Both realized and expected ROM utilization rates moved to same direction whereas realization was not as high as the expectation.
When we look at the regression results in Table 4, we can say that the explanatory power in period-2 is less than it is in period-1 but it is still powerful. Significance of our results is also well in this period. Those results show us that in period of October 2013-December 2014, ROM utilizations can be still successfully forecasted with the model which is builded by the cost related factors only.
26 ROM it = 95.984 - 0.013 EROM it
After finalization of QE program at the end of 2014, the FED entered into a cycle of rising interest rates. After performing seven years as the most accommodative monetary policy in U.S. history, the FED increased its target funds rate by 25 bps in 2015.
Unlike FED, European Central Bank started a new QE programme with monthly asset purchase amounts to 60 billion Euro. Accordingly ECB supported QE programme with negative interest rates policy during 2015. It has lowered the rates even more negative at the end of 2015.
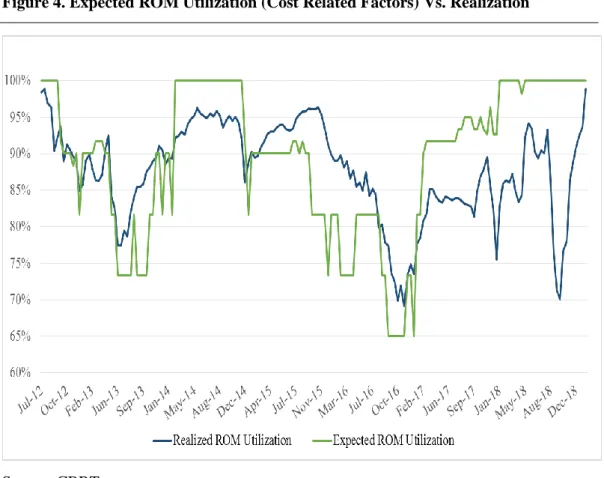
Figure 5. Net Capital Flows - Emerging Markets
SUMMARY OUTPUT Regression Statistics Multiple R 0.026 R Square 0.001 Adjusted R Square -0.041 Standard Error 2.333 Observations 26.000 ANOVA df SS MS F Significance F Regression 1 0.087 0.087 0.016 0.900 Residual 24 130.578 5.441 Total 25 130.665
Coefficients Standard Error t Stat P-value Lower 95% Upper 95%
Intercept 95.984 8.676 11.063 0.000 78.077 113.891
27
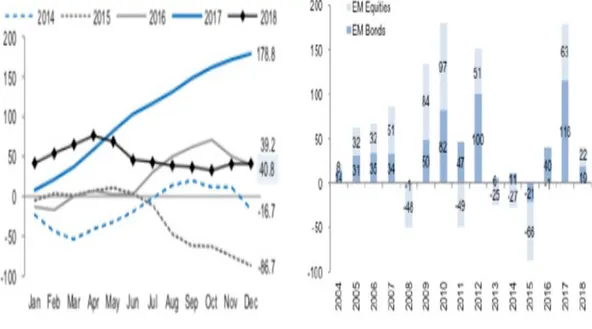
2015 was quite a tough year for the emerging markets. Both EM equity and bond markets experienced significant capital outflows in 2015 (Figure 5). Same outlook for Turkey’s net capital outflow can be seen in Figure 6. We can see its reflection to Turkey’s international reserves in Figure 3. Both gross and net reserves of CBRT have decreased during 2015. Turkish Lira depreciation continued and USDTRY reached to 3.05 in September 2015 which was the new record as of related date. In September 2015 Turkey 5 year CDS spreads were also tightened and reached to 335 which was the highest level since January 2012. Local currency long term debt credit rating was still at investment grade in 2015 (Baa3 by Moody’s and BBB- by S&P). 2015 was the year the number of terror attacks peaked. In 2 attacks took place in July and October, 137 people lost their lives and hundreds of people were injured. On the politics side, Turkey’s ruling Justice and Development Party (AKP) has won a critical parliamentary election in November 2015, regaining the majority it lost in June.
Figure 4 shows that the expected ROM utilization rate has decreased dramatically especially starting from the fourth quarter of 2015. In addition to this, realized ROM utilization rate was quite resilient and performed consistently over the expected ROM utilization rate during whole 2015. It means that banking system in Turkey
28
preferred to utilize ROM more than what breakeven ROC calculation suggested especially in the last quarter of 2015. The theoretical reasons of this situation may be excess liquidity, depreciation of TL against USD and/or EUR, rising level of confidence to economic conditions, robust capital inflows to Turkish economy. The low correlation between realized and expected ROM utilization (based on cost related factors only) is also verified by the regression summary output placed in Table 5. In addition to fact that explanatory power is quite low, the coefficient of expected utilization index is statistically insignificant.
Table 6. Regression Summary of Period-4 (Jan. 2016 – Dec. 2016)
ROM it = 24.534 + 0.782 EROM it
The deterioration in macroeconomic indicators of Turkey has continued in 2016. Yearly growth rate has declined to 3.2% which is the lowest level between 2010 and 2018. Inflation was still under control (CPI at 8.53% at the end of 2016) with the help of slowing economic activities whereas the unemployment rate increased to 10.9% in same period (it was 10.3% in 2015). One of the biggest deterioration was on currency side. Especially after the coup attempt being held in 2016 July, TRY depreciation has accelerated (USDTRY 3.53 in 2016-end compared to 2.90 in
SUMMARY OUTPUT
Regression Statistics Regression Statistics
Multiple R 0.753 R Square 0.567 Adjusted R Square 0.550 Standard Error 4.748 Observations 27.000 ANOVA df SS MS F Significance F Regression 1 739.130 739.130 32.781 0.000 Residual 25 563.695 22.548 Total 26 1,302.825
Coefficients Standard Error t Stat P-value Lower 95% Upper 95%
Intercept 24.534 10.225 2.399 0.024 3.475 45.592
29
2016 June-end). Figure 6 shows that the net capital flows to Turkish economy was positive but quite weak during 2016. It is important to note that Turkey was downgraded by S&P and Moody’s in 2016 and has lost its investment grade. Only Fitch’s credit rating for Turkey was over investment grade as of 2016.
Figure 6. Net Capital Flows – Turkey (bio USD)
Source: CBRT
ROM utilization rate has dramatically declined from 92% in 2015 December to 69% in 2016 November. Expected ROM utilization rate has also declined from 82% in 2015 December to 65% in 2016 November. Those were the lowest levels for both realized and expected ROM utilization rate between 2012 and 2018 (Figure 4). Table 6 shows the regression summary output for ROM utilization in 2016. According to the output, cost related factors still have important power on explaining realized ROM utilization during 2016.
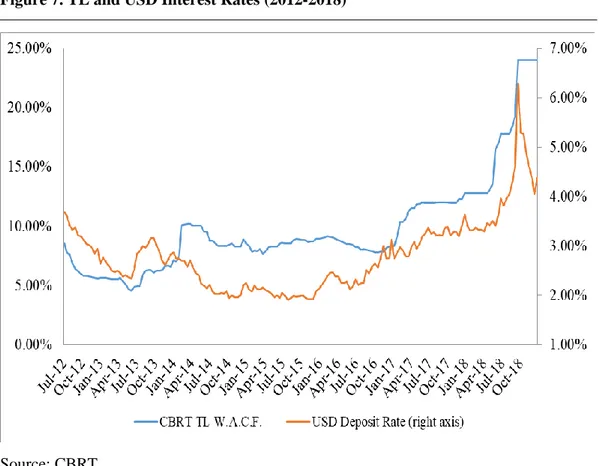
When we look at Figure 7, we see that foreign currency interest rate has risen significantly while TL interest rate has decreased during 2016 resulting fewer ROM utilization rates. Because keeping reserves in foreign currency became more costly compared to keeping reserves in TL, banks preferred to release some portion of
30
their ROM utilization in 2016. High explanatory power of expected ROM utilization on realized ROM utilization implies that banking sector mainly consider cost related factors while deciding ROM utilization level in 2016.
Figure 7. TL and USD Interest Rates (2012-2018)
Source: CBRT
Table 7 indicates that although the explanatory power of the model is lower than it is in the periods of 2012-2013 and 2013-2014, the model is still statistically significant in 2017.
31 ROM it = 40.690 + 0.478 EROM it
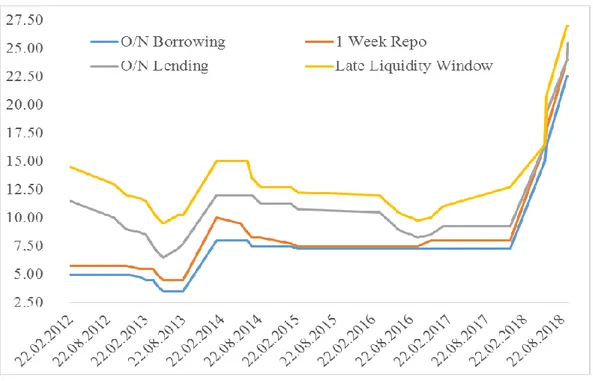
It is important to summarize economic and political circumstances of 2017. CBRT has decreased the reserve requirement rate for foreign currency liabilities at the beginning of 2017 and injected USD 1.5 bio additional liquidity to the system. On the other hand CBRT extended the interest rate band by increasing o/n lending rate from 8.50% to 9.25% and late liquidity window rate from 10.00% to 11.00% at the beginning of the year. The band was even wider at the end of the year such as 1w repo rate at 8.00%, o/n borrowing rate at 7.25%, o/n lending rate at 9.25% and late liquidity window rate at 12.75%.
Figure 8. CBRT Interest Rates SUMMARY OUTPUT
Regression Statistics Regression Statistics
Multiple R 0.536 R Square 0.287 Adjusted R Square 0.258 Standard Error 2.590 Observations 26.000 ANOVA df SS MS F Significance F Regression 1 64.926 64.926 9.681 0.005 Residual 24 160.953 6.706 Total 25 225.879
Coefficients Standard Error t Stat P-value Lower 95% Upper 95%
Intercept 40.690 14.138 2.878 0.008 11.511 69.869
32 Source: CBRT
Turkey has lost its last investment grade credit rating by Fitch in 2017. Fed continued to hike interest rate by three times (75 bps in total) in 2017. ECB decreased monthly asset purchase amounts from EUR 80 billion to EUR 60
Billion in its QE programme. Although the economic conjuncture outside was not so supportive, 2017 was the year one of the biggest capital inflows have been experienced not only by Turkey (Figure 6) but also by other emerging markets (Figure 5).
So it can be judged that negative financial fundamentals are compensated by the net capital inflows to Turkish economy during 2017. As the gap between cost of TL and foreign currency funding increased (Figure 7), both expected and realized ROM utilization rates has increased in 2017 (Figure 4).
33 ROM it = -44.095 + 1.322 EROM it
Deterioration in Turkish economy has peaked in the second half of 2018. Annual CPI has reached to 25.24% in October. It was the highest level since 2003. Annual GDP growth has declined to 2.6% at the end of 2018 (the lowest level since 2009). In 13 August 2018, USDTRY and EURTRY have increased to 7.01 and 7.98 respectively which are the all-time highs. As we can see in Figure 4 capital movements to emerging markets was positive but quite poor during 2018. Turkey’s performance was even worse as stated in Figure 5. The deterioration of macroeconomic indicators showed its effects on CBRT’s gross reserves as well. While net reserves were steady, gross reserves has declined significantly from 117 bio USD in January 2018 to 84 bio USD in October 2018 (Figure 3). While CBRT was following tight monetary policy to cope with the high inflation and depreciated TL, fiscal policy showed some expansionary signs such as tax cuts and project based incentive program.
On political side, presidential and parliamentary elections were held in 2018. Recep Tayyip Erdogan has been elected as the first executive president of Turkey under the new presidential system. His party’s alliance, the People’s Alliance, secured a majority of seats in parliamentary elections. Consistently deteriorating relations between the U.S. and Turkey over recent years have risen to alarming levels,
SUMMARY OUTPUT Regression Statistics Multiple R 0.064 R Square 0.004 Adjusted R Square -0.034 Standard Error 7.186 Observations 28.000 ANOVA df SS MS F Significance F Regression 1 5.568 5.568 0.108 0.745 Residual 26 1,342.714 51.643 Total 27 1,348.281
Coefficients Standard Error t Stat P-value Lower 95% Upper 95%
Intercept -44.095 402.240 -0.110 0.914 -870.911 782.721
34
dealing a severe blow to both Turkey’s economy and its currency. We saw some relief when Turkish court ordered release of Andrew Brunson, who had been held on terrorism charges related to the failed 2016 military coup.
Table 8 shows how well the cost related factors explain the realized ROM utilization during 2018. As we can see the cost related factors alone are not statistically significant in explaining actual utilization in 2018. Realized ROM utilization rate was consistently under what breakeven ROC implied during whole 2018 period (Figure 4). Especially during the period between August 2018 and November 2018, the difference between expected and realized ROM utilization was prominence. While breakeven ROC implies %100 utilization, the realization ROM utilization had fluctuated around %75 levels.
As can be seen in Figure 8, CBRT TL interest rates increased dramatically starting from 2018 first half. The interest rate band significantly narrowed in this period. Figure 6 shows how USD deposit rates and CBRT TL WACF rates behaved during 2018. CBRT TL WACF rates increased from 12.75% in January 2018 to 24.02% in December 2018 while USD deposit rates increased from 3.41% to 4.38% in same period. As TL interest rate movement was steeper than USD interest rate movement, ROM utilization had an edge over TL reserves. Expected ROM utilization rate has risen to 100% levels but realized ROM utilization rate moved well lower than the expectation.
This picture shows us that we need to investigate the effects of other independent variables on ROM utilization for the period of 2018. The result of this investigation will give us an opinion about the rationale behind banking sector’s ROM utilization behavior under financial turmoil or crisis periods such as 2018. The analysis of cost related and other factors’ effects on ROM utilization will also shed light on automatic stabilizer aspect of mechanism.
2.2.2. The Explanatory Power of Other Factors in 2018
Although breakeven ROC, which is calculated using cost related factors, is the main determinant of ROM utilization in general, there are still huge differences between
35
expected utilization ROM rate which is implied by breakeven ROC and realized ROM utilization in certain terms. As stated in previous section, cost related factors alone are not sufficient to explain the realized ROM utilization in 2018. This observation indicates that other factors may also be deterministic for banks while deciding ROM utilization level during financial turmoil or crisis periods.
To this end, we use other explanatory variables explained in the previous sections such as exchange rate, Turkey CDS, share of loans in the balance sheet of the banks, confidence index, banks’ total liquidity ratios, VIX and USDTRY volatility. Timing of the variables is as follows: we use the most recent data released before the start of each maintenance period. In other words, we use the data set by the time banks claim their ROM utilization. In addition, we use one month moving average data for USDTRY volatility. Because it makes overall level easier to look at. It is a good way to judge strength of trends.
The statistical summary of dependent variable (realized ROM utilization rate) for 2018 is as follows:
Table 9. Statistical Summary of Dependent Variable (Jan. 2018 – Dec. 2018)
We run stepwise multiple regression method to be able to evaluate the effect of other variables on realized ROM utilization. Stepwise regression is a method of fitting regression models in which the choice of predictive variables is carried out by an automatic procedure. In each step, a variable is considered for addition to or subtraction from the set of explanatory variables based on some prespecified criterion.
We first start with one factor regression analysis to observe the explanatory power of other factors (exchange rate, Turkey CDS, share of loans in the balance sheet of
Num. of observations 26 Mean 85.83%
Min 70.08% Mod 86.34%
Max 94.17% Mod Frequency 2
Std. Deviation 6.60% Median 86.34% - 86.45%
36
the banks, confidence index, banks’ total liquidity ratios, VIX and USDTRY volatility ) on realized ROM utilization individually.
As seen in Table 10, exchange rate, USDTRY volatility and confidence index are individually statistically significant. The signs of the coefficients are in the expected direction for USDTRY volatility and confidence index. As the volatility decreases and/or the confidence index increases, the ROM utilization also increases. Whereas the sign of the coefficient of exchange rate is in the other direction than the expectations stated in previous papers. This observation will be analyzed more in detailed in following sections.
Table 10. One Factor Regression Summary (January 2018 – December 2018)
Table 10 also shows that the explanatory powers of one factor models are not so strong. The highest one belongs to the model with exchange rate with %25 R-Square. The equation of this model is as it exists below:
ROM it = 107.440 – 3.876 EXC i, t-1
In the model, “ROM” represents the realized utilization rate, “EXC” represents exchange rate.
Explanatory Variables Model 1 Model 2 Model 3 Model 4 Model 5 Model 6 Model 7 Total Liquidity 0.464 (0.393) Exchange Rate -3.876 ** (0.009) Turkey 5y CDS -0.020 (0.102) VIX 0.225 (0.405) Loan/Asset Ratio 85.543 (0.193) USDTRY Volatility -0.326 ** (0.030) Conf. Index 0.275 ** (0.037) Constant 36.015 107.440 ** 93.298 ** 83.489 ** 34.233 93.769 ** 61.878 ** (0.547) (0.000) (0.000) (0.000) (0.396) (0.000) (0.000) R-Square 0.031 0.249 0.107 0.029 0.069 0.181 0.168
37
In second step, we go with the 2 factors regression analysis. We keep expected utilization implied by breakeven ROC (cost related factors) as one of the two factors and add other factors one by one to the model. We try to see how other factors and cost related factors affect ROM utilization when they come together.
Table 11. Two Factors Regression Summary (Jan. 2018 – Dec. 2018)
As seen in Table 11, explanatory power of two factors models, which are composed of cost related factor and one of other factors, is not significantly higher than one factor models. For instance, the highest R-square belongs to Model 2 which includes cost related factors and exchange rate as its equation exists below:
ROM it = -148.505 + 2.571 CRF it – 4.057 EXC i, t-1
In the model, “ROM” represents realized utilization rate, “CRF” represents cost related factors (expected utilization implied by breakeven ROC) and “EXC” represents exchange rate.
Explanatory Variables Model 1 Model 2 Model 3 Model 4 Model 5 Model 6 Model 7
Cost Related Factors 0.195 2.571 2.191 0.765 2.127 2.611 2.305
(0.961) (0.459) (0.565) (0.844) (0.587) (0.474) (0.529) Total Liquidity 0.458 (0.420) Exchange Rate -4.057 ** (0.008) Turkey 5y CDS -0.021 (0.092) VIX 0.223 (0.419) Loan/Asset Ratio 93.850 (0.172) USDTRY Volatility -0.347 ** (0.026) Conf. Index 0.289 ** (0.034) Constant 17.168 -148.505 -125.198 7.048 -183.475 -166.710 -169.760 (0.965) (0.666) (0.741) (0.985) (0.649) (0.645) (0.644) R-Square 0.031 0.267 0.121 0.0307 0.081 0.199 0.183
38
Model 2’s R-square is just 2% higher than one factor model which includes exchange rate only. In addition to this, the coefficients of cost related factors are not statistically significant in any model that exists in Table 11. So we can make an inference that adding cost related factor as independent variable into the model is not enhancing the success of the model.
Among two factor models, like their performance in one factor models, USDTRY volatility and confidence index are again other significant explanatory variables. In third step, we apply multiple regression variations to be able to find the best model to explain realized ROM utilization during 2018 financial turbulence period. We try all combinations of explanatory variables from one factor model to seven factor model with using exchange rate, Turkey CDS, loan/asset ratio, confidence index, total banks liquidity, VIX, USDTRY volatility and cost related factors.