Procedia - Social and Behavioral Sciences 175 ( 2015 ) 503 – 510
ScienceDirect
1877-0428 © 2015 Published by Elsevier Ltd. This is an open access article under the CC BY-NC-ND license (http://creativecommons.org/licenses/by-nc-nd/4.0/).
Peer-review under responsibility of I-DAS- Institute for the Dissemination of Arts and Science. doi: 10.1016/j.sbspro.2015.01.1229
International Conference on Strategic Innovative Marketing, IC-SIM 2014, September 1-4, 2014,
Madrid, Spain
The Antecedents of Complex Destination Image
Gökçe Özdemir
a,*, Ömer Faruk Şimşek
baYasar University, Universite Cad. Agacli Yol, No: 35-37 Bornova, Izmir, Turkey
bİstanbul Arel University, Türkoba Mahallesi Erguvan Sokak No:26 / K 34537 Tepekent – Büyükçekmece, İstanbul, Turkey
Abstract
The aim of this study was to propose a model of complex destination images by examining the interconnecting relationships between the destination image, perceived price, perceived quality, perceived value, and overall satisfaction. The empirical data was collected in Izmir, Turkey, home of many civilizations such as Persians, Lydians, Romans, Byzantines, Seljuks and Ottomans. A total of 449 questionnaires were collected and the data of 396 were analyzed using Structural Equation Modeling. The results indicated that: (1) the perceived price and perceived quality were both direct antecedents of the perceived value; (2) the perceived value directly influenced satisfaction; (3) the satisfaction had a direct and positive impact on the destination image; (4) the perceived quality both directly and indirectly influenced the destination image; and (5) the perceived price indirectly affected the destination image.
© 2015 The Authors. Published by Elsevier Ltd.
Peer-review under responsibility of I-DAS- Institute for the Dissemination of Arts and Science. Keywords: Tourism Marketing; Destination Image; Image Formation; Structural Equation Modeling
1. Introduction
In the tourism industry, increasing competition between destinations necessitates both effective destination management and marketing approaches. Destination marketers try to create, change, or highlight an image that is to closely relate to actuality, and thus, destination managers try to realize that very image. However, marketing a tourist destination is often difficult to organize as there are often many stakeholders involved, all with their own aims, goals, and motivations, which have to co-exist (Grangsjo, 2003). As Kozak & Rimmington (2000) imply, new
* Corresponding author. Gökçe Özdemir. Tel.: +90- 232-411-5000. ; fax: +90-232-374-5474. E-mail address: [email protected] (G. Özdemir).
© 2015 Published by Elsevier Ltd. This is an open access article under the CC BY-NC-ND license (http://creativecommons.org/licenses/by-nc-nd/4.0/).
destinations get established, some existing ones make further progress, and others decline. Since destinations seek competitive images, it is crucial to understand the factors affecting the image of a destination. In fact, tourists experiencing a weak or even neutral image in their minds will probably not consider the destination as worth visiting again and will not recommend it to their acquaintances. Although changing organic images is not an easy task, strong marketing efforts through an umbrella construct and a very well managed destination experience can result in a positively improved image. Although Mackay & Crompton (1997) imply that image is subjective knowledge, the aim of the branding efforts through advertisements and other marketing tools is certainly to generate a positive image that is distinctive in several aspects. Additionally, the brand image should be consistent with the destination and its inherent benefits.
A complex image is derived from the destination experience itself, and therefore it can be appreciated as being more realistic. Thus, a positive complex image results from the high satisfaction of tourists with the destination attributes and the experience they had in the end. In order to create a high-value destination image, the components of a destination product should be managed effectively to enhance the quality of products and services as a whole. Moreover, pricing each component is another issue that contributes to the value of the product, satisfaction of the tourist, and image of the destination. In this study, we aim to structure a model that could explain the formation of complex images, that is, the creation of images through the destination experience. Analysis of the antecedents of complex destination image was derived from the data collected from the international tourists in İzmir. İzmir, 8500 years old city, is located on the Aegean Coast of Turkey well known with its archaeological, historical and cultural assets. İzmir is a multicultural city also characterized by the Jewish, Christian and Muslim heritage of each religion. Three of the First Seven Chruches mentioned in the Bible are located in İzmir; Ephesus, Smyrna and Pergamon. Additionally, İzmir is also known as the birthplace of Homer, the author of Iliad. İzmir with all of the seaside resorts surrounding it is popular with its leisure tourism, health tourism and cruise tourism.
2. Literature review
Several researches have taken a conceptual approach in describing how destination images are formed, and offer structural models to explain this process (Baloglu & McCleary, 1999; Chi & Qu, 2008; MacKay & Fesenmaier, 1997). Overall destination competitiveness is determined by price and non-price factors (Dwyer, Forsyth, & Rao, 2000). Prices are seen as inhibitors of the choice of destinations (Nicolau & Mas, 2006). Given some evidence of the price sensitivity of the demand for travel, destinations need to monitor their price competitiveness relative to alternate locations (Dwyer, Forsyth, & Rao, 2000). Pricing strategies for quality products need to reflect consumer expectations and their willingness to pay a higher price for quality products. Low prices could detract from the quality image of the product (Henchion & McIntyre, 2000). In fact, people who manifest an intellectual need to know and discover new places (the Ulysses Factor) are willing to pay a higher price (Nicolau & Mas 2006).
Quality is mostly considered as a destination management attribute whereas pricing, satisfaction, and the image are evaluated in terms of destination marketing. The relation among these variables has previously been studied by many scholars who focused on destinations (Baloglu & McCleary, 1999; Chen & Tsai, 2007) and events (Cole & Illum, 2006; Yuan & Jang, 2007). Although considerable research has been devoted to the mediating effects of quality and price on a complex destination image, rather less attention has been paid to the direct effects on the destination image. The dimension of intention to return has also been studied in previous researches (Baker & Crompton, 2000; Castro, Armario, & Ruiz, 2007) as another dependent variable of quality, value, satisfaction, or image.
Murphy et al. (2000) state that quality perceptions are thought to reflect a positive summary evaluation of the trip experience. In simple terms, quality refers to the totality of features and characteristics of a product or service that bear on its ability to satisfy needs (Kotler, 1997). As a fact, according to Go and Govers (2000), quality is a major interest of private and public operators in the emerging global market and deserves a comprehensive approach and a definitive integration among its key stakeholders (residents, tourists, and trade) and in-depth knowledge of their needs and expectations. However, the communication of quality as a source of differentiation and its value to potential consumers is fundamental to the concept of quality itself (Henchion & McIntyre, 2000). In the study of Murphy et al. (2000), it was concluded that when tourists develop a sense of trip quality, their perceptions of the trip
value are also thought to be enhanced. Additionally, Cronin et al. (2000) point out that not only does quality affect perceptions of value and satisfaction, it also influences behavioral intentions directly.
According to Fakeye & Crompton (1991), one of the most effective types of information sources for forming images is the tourists’ onsite experiences. If the tourists’ actual experiences are more influential in the formation of the destination image than external sources, that positive experience plays a significant role in repurchase decisions (Gartner, 1989). The time that a tourist spends at the destination may be the best opportunity for destination managers to create a favorable destination image. The more favorable the perceptions of tourists, the more favorable the image is, and the greater the likelihood of choice from among similar alternatives in the future (Goodrich, 1978).
Lee et al. (2007) claim that as competition increases, tourism businesses and organizations need to develop effective methods for being more responsive to peoples’ needs. As towns and cities worldwide face critical challenges over the next few years, they must become cleaner, greener, and safer in order to compete in terms of inward investment, tourism development, and commercial advantage (Ratcliffe & Flanagan, 2004). However, quality evaluations are not made solely on the outcome of a service—they also involve evaluations of the process of the service delivery (Parasuraman et al.,1985). Since each personal transaction is going to be different (and to the extent that tourism services are highly personal in nature), there will be great variations in quality/output (Keane, 1997). Beerli & Martin (2004b) also state that one of the factors related to personal experience is the intensity of the visit, or, in other words, the extent of an individual’s interaction with the place.
According to Ekinci (2003), the quality of services should be improved in order to influence customer satisfaction. Ekinci (2003) also points out that managers should maintain a good balance between what they offer (benefits to customers) and what they charge for their services in order to influence satisfaction, as deserved expectation and desires congruence both positively influence the satisfaction decision. Thus, value—the ability to give tourists what they want and denominating it to enrich a community’s stakeholders—is a touchstone of modern destination marketing practices (Mykletun, Crotts, & Mykletun, 2001). In other words, value is the consumer’s overall assessment of the utility of a product, based on perceptions of what is received and what is given (Woodruff, 1997).
Zeithaml (1988) stresses that value is a price–quality comparison, and quality is also thought to be instrumental in the formation of value perceptions. Additionally, Parasuraman and Grewal (2000) support that the perceived service quality enhances the perceived service value. Oh (1999) also concludes in his study that the perceived value is an immediate antecedent to customer satisfaction. Therefore, according to Lee et al. (2007), having a satisfying experience is desirable, but it is more important to develop strong perceptions of service quality and service value for tourists.
The performance of a tourist destination and the satisfaction of tourists with the destination are of paramount importance to the destination competitiveness since the pleasantness of the experience is more likely to influence tourists’ future behavior (Baloglu et al., 2003). Satisfaction is thus a multifaceted concept and is even more complex when the focus is on a destination rather than an individual service provider (Truong & Foster, 2006). Understanding the tourists’ levels of satisfaction with and reaction to their experience in the destination is thus essential to destination managers for improving their products and services, and effectively promoting to target markets for new and repeat tourists (Yu & Goulden, 2006).
In the case of destinations, satisfaction is assessed by reference to many individual aspects of the holiday encounter, including the services and facilities used. In this way, both a measure of the overall satisfaction and a diagnostic evaluation of those aspects of the holiday responsible for satisfaction may be obtained (Truong & Foster, 2006). In other words, the attributes satisfaction and dissatisfaction are significantly related to the positive and negative effects, respectively, and to the overall satisfaction (Oliver 1993). Similarly, in the study of Yu and Goulden (2006), the main concerns deal with how satisfied the tourists are with the attractions, the transportation, the food, the hospitality of the local people, the service quality, and the price. It is important to understand that tourist satisfaction is not achieved exclusively through the quality of service. However, the quality of service is likely to be the key medium for providing satisfaction (Lee, Petrick, & Crompton, 2007). The majority of tourists have experiences with other destinations, and their perceptions are influenced by comparisons between facilities, attractions, as well as service standards (Laws 1995). Therefore, satisfaction of the tourists at a destination will certainly influence the destination image in a positive light when compared to other destinations.
Parasuraman et al. (1994) claim that a customer’s overall satisfaction may be related to their assessment of not only the service quality (e.g., courtesy, responsiveness, etc.), but also the product features (e.g., size of hotel room, etc.) and price. In a similar vein, Soutar (2001) suggests that satisfaction may be affected by both the service quality and value. Perceived service quality and perceived service value are cognitive responses to a service experience, whereas satisfaction is an emotional response (Cronin, Brady, & Hult, 2000). This may be particularly important in the case of tourism destinations where the costs of visitation are known to differ. Any measure of satisfaction therefore needs to be able to take this into account (Truong & Foster, 2006).
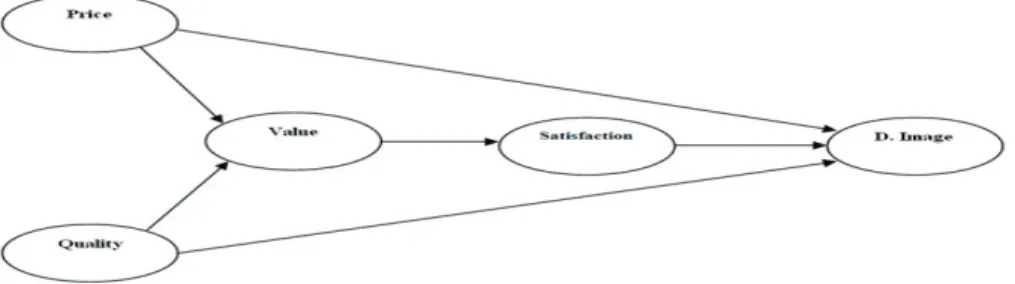
Fig. 1. Hypothesized structural model relating perceived price, perceived quality, perceived value, satisfaction and destination image. 3. Methodology
This study aimed to measure the formation of complex destination images by perceived price, perceived quality, perceived value and satisfaction. After getting all the necessary permissions from the Governorship of İzmir and other authorities, the survey was conducted at Adnan Menderes Airport in Izmir over a four-week period in August. This time of the year is preferred to conduct the study as it is the peak season of Izmir which enabled both business and leisure tourists participate in the study. Relevant questionnaires consisting of 6 sections were distributed to the foreign tourists. Self-administered questionnaires in English were distributed by a researcher at the airport departure halls after tourists had completed their check-in procedures and waiting for boarding at the gate. The researcher used convenience sampling because of its convenient accessibility which is one of the non-probability sampling techniques. The researcher selected and approached the departing foreign tourists randomly explaining the purpose of the research and invited them to participate in the survey. If refused, the researcher randomly located the next visitor and repeated the procedure until a voluntary participant was found. At this point, tourists were thought to have the chance to assess their perceptions of destination attributes more clearly according to their final experiences. Furthermore, the experience was still fresh in their minds. After the questionnaires are distributed, 449 questionnaires were collected for the survey and the data of 396 were used in the analysis. According to Anderson and Gerbing (1984) for a "low risk of drawing wrong conclusions" a sample size of at least 200 is necessary which the sample size of this survey has already exceeded. The researchers used the valid mean substitution in replacing the missing data. A research model was projected in which six hypotheses mentioned above were tested. Data collected through the relevant survey was analyzed through structural equation modeling (SEM) in LISREL . the implementation of the statistical approach in the LISREL computer program, latent variable modeling has become a popular research tool in the social and behavioral sciences (Baumgartner & Homburg, 1996). The main aim in the statistical analysis used here was to determine whether the effect of perceived price and perceived quality on destination image was mediated by perceived value and satisfaction. In order to test this meditational model, nested models strategy (Anderson & Gerbing, 1988) was used. The level of statistical significance was defined as 0.01 for all the statistics in order to eliminate Type 1 error.
Test of the Measurement Model
The measurement model specified the posited relations of the observed variables to their underlying constructs allowed to intercorrelate freely. Five latent variables were used in the structural equation model testing: perceived quality, perceived price, perceived price, satisfaction, and destination image. Test of the measurement model resulted in the following goodness of fit statistics χ2(142, N = 396) = 513.14, p<.05; GFI = .98; AGFI = .98; CFI = .99;
RMSEA = 0.082. Most of the loadings of the measured variables on the latent variables were large and statistically significant (standardized values ranged from 0.36 to 0.99, p<.001, see Table 1). Therefore, all of the latent variables appear to have been adequately operationalized by their respective indicators. In addition, correlations among all latent variables in the model were all statistically significant (Table 2).
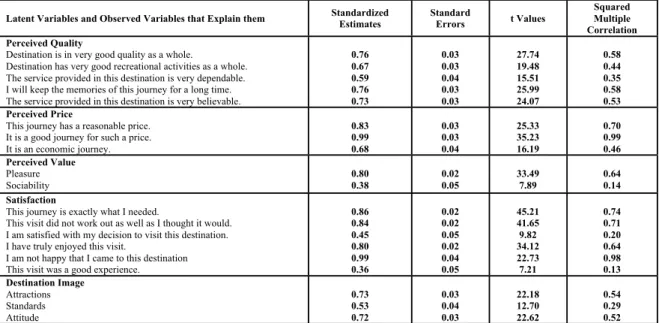
Table 1. Factor Loadings, standard errors, and t-values for the Measurement Model
Latent Variables and Observed Variables that Explain them Standardized Estimates Standard Errors t Values
Squared Multiple Correlation Perceived Quality
Destination is in very good quality as a whole.
Destination has very good recreational activities as a whole. The service provided in this destination is very dependable.
I will keep the memories of this journey for a long time. The service provided in this destination is very believable.
0.76 0.67 0.59 0.76 0.73 0.03 0.03 0.04 0.03 0.03 27.74 19.48 15.51 25.99 24.07 0.58 0.44 0.35 0.58 0.53 Perceived Price
This journey has a reasonable price. It is a good journey for such a price.
It is an economic journey. 0.83 0.99 0.68 0.03 0.03 0.04 25.33 35.23 16.19 0.70 0.99 0.46 Perceived Value Pleasure Sociability 0.80 0.38 0.02 0.05 33.49 7.89 0.64 0.14 Satisfaction
This journey is exactly what I needed.
This visit did not work out as well as I thought it would. I am satisfied with my decision to visit this destination. I have truly enjoyed this visit.
I am not happy that I came to this destination This visit was a good experience.
0.86 0.84 0.45 0.80 0.99 0.36 0.02 0.02 0.05 0.02 0.04 0.05 45.21 41.65 9.82 34.12 22.73 7.21 0.74 0.71 0.20 0.64 0.98 0.13 Destination Image Attractions Standards Attitude 0.73 0.53 0.72 0.03 0.04 0.03 22.18 12.70 22.62 0.54 0.29 0.52
Table 2. Correlations among Latent Variables for the Measurement Model.
Latent Variable 1 2 3 4 5 1 Perceived Price - 2 Perceived Quality .41 - 3 Perceived Value .50 .73 - 4 Satisfaction .39 .76 .85 - 5 Destination Image .47 .85 .72 .77 -
Note. N = 396 ; p<.001 for all statistics.
Test of the Mediation Model
Although the measurement model was estimated entirely on the endogenous side of the LISREL model, the full latent variable model requires the use of both endogenous and exogenous sides of the model (Kelloway, 1996). The theoretical model of this study is represented by two exogenous (perceived price and perceived quality) and three endogenous constructs (perceived value, satisfaction, and destination image). Structural model was tested using a set of nested models in accordance with the proposed model. Within the framework of nested models strategy, the effect of perceived quality and perceived price on the destination image was analyzed in terms of meditational effects of both perceived value and satisfaction. In other words, the tests of mediation were performed by examining whether there were differences among the partially mediated model represented in Figure 1 which included the direct paths from perceived price and perceived quality to destination image, and the models in which one of them are omitted.
Test of the partial mediated model in Figure 1 (Model 1) resulted in a good fit to the data as indicated by the following goodness of fit statistics: χ2(145, N = 396) = 536.45, p<.05; GFI = .98; AGFI = .98 CFI = .99; RMSEA = 0.083. In the second model, perceived quality is connected to destination image only through perceived value and satisfaction while perceived price has both indirect and direct paths to destination image. This new model was obtained by deleting the path that directly connects the perceived quality variable to destination image. The chi-square difference test was conducted to determine how much negatively the absence of this path will affect the model’s fit to the data. Chi-square difference test was (80.49, 1; p<0.01) showed that deletion of the path from perceived quality to destination image affects the model negatively, so this path should remain in the model. The
third model was tested by ignoring the direct effect of perceived price on destination image. In other words, the path from perceived price to destination image was deleted, and the effect of the absence of this path to the model’s goodness-of-fit was tried to be determined by the aid of chi-square difference test. The resultant chi-square difference with one degree of freedom (4.88, 1; p>.01) showed that the deletion of this path had no effect on the goodness of fit of the model tested. According to nested models strategy, between two models having the same goodness of fit, the more parsimonious model should be taken as valid. It is clear, then, this path should be deleted in the model.
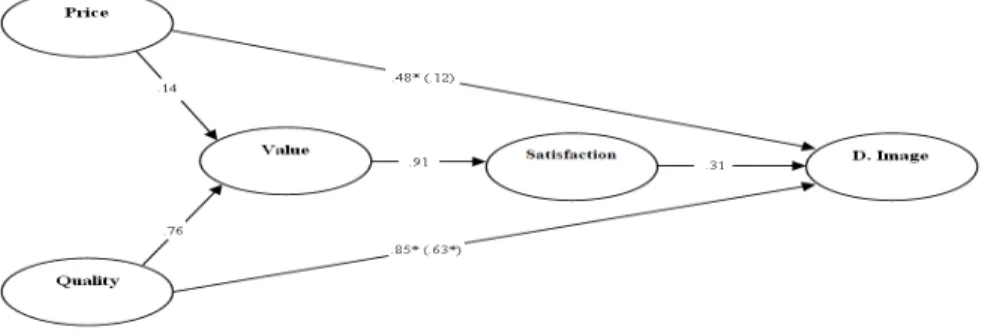
Overall, the results of the mediational tests indicated the effect of perceived quality on destination image was partially mediated by perceived value and satisfaction while the effect was fully mediated concerning perceived price. As a result of the processes concerning mediational effects, the final model was accepted as depicted in Figure 2. This model accounted for 69% of the variance in value, 57% of the variance in satisfaction, and 73% of the variance in destination image.
Fig. 2. Standardized parameter estimates of the final structural model.
Notes: The numbers in parentheses refer to the coefficients for the direct paths when the mediator is included in the model.
4. Conclusion and Discussion
In the presence of previous experience, tourists do not engage in information research very much unless if they need to update their knowledge about the destination. Therefore, tourists having prior visit experience do not easily get impressed by the image induced by the destination marketers through various marketing channels. A tourist having an organic and/or induced image in their mind is subject to change his image of destination according to the experience he has. Therefore the proposed model may guide the destination managers in being distinctive by creating a distinguished tourist product and reimage a destination positively. In fact in the structural model, the complex image of a destination has been identified with the antecedents such as quality, price, value and satisfaction. Therefore, the conducted study includes a proposed model and hypotheses to test in order to confirm the relationships between the relevant dimensions such as perceived quality, perceived price, value, satisfaction and destination image. The relationship between destination image and other dimensions that are assumed to affect the complex destination image (perceived quality, perceived price, value and satisfaction) suggest that destination managers should center their marketing efforts on developing strategies in order to enhance tourists’ satisfaction and quality of the overall destination experience. It’s certain that complex image of a destination is the most realistic image because it’s formed through the exact reality performed by the destination and perceived by the tourists. As it’s drawn from the study; perceived price has no direct effect on the complex destination image. Findings also revealed that perceived price compared with quality has a significant indirect effect with the mediation of value and satisfaction on the onsite image of the destination. Therefore the formation of image, deriving from the actual visit, proceeds by the comparison of price and quality forming the value, then affects the destination image through
satisfaction. As a result of the analysis it should be noted that although price has no direct effect on the image, besides having an indirect effect, perceived quality has a direct effect on the destination image in addition to indirect effect mediated by perceived value and tourist satisfaction. These findings lead us to the importance of quality and indirect effect of price compared to the quality. Therefore, price is regarded as less important factor in the formation of complex image among other dimensions in the model. Thus, the results of the study indicate that complex image of a destination is formed through various dimensions and each dimension should be carefully analyzed to enhance the overall destination image. This study has some certain limitations in its nature. First of all, here the complex image refers to the combination of organic, induced and actual image; therefore the effects of actual experience on complex image cannot be isolated. Secondly, the survey was conducted in high season, thereby different data could have been collected at different seasons.
REFERENCES
Anderson, J. C. & Gerbing, D. W. (1984). The effect of sampling error on convergence, improper solutions, and goodness-of-fit indices for maximum likelihood confirmatory factor analysis. Psychometrika, 49 (2), I55-173.
Anderson, J. C. & Gerbing, D. W. (1988). Structural equation modeling in practice: A review and recommended two-step approach. Psychological Bulletin, 103(3), 411-423.
Baker, D. A. & Crompton J. L. (2000). Quality, satisfaction and behavioral intentions. Annals of Tourism Research, 27(3), 785-804.
Baloglu, S., Pekcan, A., Chen, S. & Santos, J. (2003). The relationship between destination performance, overall satisfaction, and behavioral intention for distinct segments. Journal of Quality Assurance in Hospitality and Tourism, 4(3/4), 149-165.
Baumgartner, H. & Homburg, C. (1996). “Applications of structural equation modeling in marketing and consumer research: A review”. International Journal of Research in Marketing, 13(2), 139-161.
Castro, C.B., Armario, E. M. & Ruiz, D. M. (2007). The influence of market heterogeneity on the relationship between a destination’s image and tourists’ future behavior. Tourism Management, 28, 175–187.
Chen, C. & Tsai, D. (2007). How destination image and evaluative factors affect behavioral intentions?. Tourism Management, 28, 1115–1122. Cole, S. T. & Illum, S. F. (2006). Examining the mediating role of the festival tourists’ satisfaction in the relationship between service quality and
behavioral intention. Journal of Vacation Marketing, 12(2), 160-173.
Cronin, J. J., Brady, M. K. & Hult, G. T. M. (2000). Assessing the effects of quality, value, and customer satisfaction on consumer behavioral intentions in service environments. Journal of Retailing, 76 (2), 193-218.
Danaher, P. J. & Mattsson, J. (1994). Customer satisfaction during the service delivery process. European Journal of Marketing, 28 (5), 5-16. Dwyer, L., Forsyth, P. & Rao, P. (2000). The price competitiveness of travel and tourism: A comparison of 19 destinations. Tourism
Management, 21, 9-22.
Ekinci, Y. (2003). Which comparison standard should be used for service) quality and customer satisfaction?. Journal of Quality Assurance in Hospitality and Tourism, 4 (3/4), 61-66.
Gartner, W.C. (1989). Tourism image: attribute measurement of state tourism products using multidimensional techniques. Journal of Travel Research, 28, 16-20.
Go, F. M. & Govers, R. (2000). Integrated quality management for tourist destinations: A European perspective on achieving competitiveness. Tourism Management, 21, 79- 88.
Goodrich, J. (1978). A new approach to image analysis through multidimensional scaling. Journal of Travel Research, 16, 10-13.
Grangsjo, Y. (2003). Destination networking: Co-opetition in peripheral surroundings. International Journal of Physical Distribution & Logistics Management, 33(5), 427-448.
Henchion, M. & McIntyre, B. (2000). Regional imagery and quality products: The Irish experience. British Food Journal, 102(8), 630-644. Nicolau, J. L., & Mas, F. J. (2006). The influence of distance and prices on the choice of tourist destinations: The moderating role of
motivations. Tourism Management, 27, 982-996.
Keane, M. J. (1997). Quality and pricing tourism in destinations. Annals of Tourism Research, 24(1), 117-130.
Kelloway, E. K. (1998). Using LISREL for Structural Equation Modeling: A Researcher’s Guide. Sage Publications, London. Kim, H. & Richardson, S. L. (2003). Motion picture impacts on destinations images. Annals of Tourism Research, 30(1), 216-237.
Kozak, M. & Rimmington, M. (2000). Tourist satisfaction with Mallorca, Spain, as an off-season holiday destination. Journal of Travel Research, 38, 260- 269.
Laws, E. (1995). Tourist Destination Management: Issues, Analysis, and Policies. New York: Routledge.
Lee, S. Y., Petrick, J. F. & Crompton, J. (2007). The roles of quality and intermediary constructs in determining festival attendees’ behavioral intention. Journal of Travel Research. 45(4), 402-412.
Leisen, B. (2001). Image segmentation: the case of a tourism destination. Journal of Services Marketing, 15(1), 49-66.
MacKay, K. & Fesenmaier, D. R. (1997). Pictorial element of destination in image formation. Annals of Tourism Research, 21(3), 537-565. Mykletun, R. J., Crotts, J. C. & Mykletun A. (2001). Positioning an island destination in the peripheral area of the Baltics: A flexible approach to
market segmentation. Tourism Management, 22 (5), 493-500.
Obenour, W., Lengfelder, J. & Groves, D. (2005). The development of a destination through the image assessment of six geographic markets. Journal of Vacation Marketing, 11(2), 107-119.
Oh, H. (1999). Service quality, customer satisfaction, and customer value: A holistic approach. Hospitality Management, 18, 67-82.
Oliver, R. L. (1980). A cognitive model of the antecedents and consequences of satisfaction decisions. Journal of Marketing Research, XVII November, 460-469.
Parasuraman, A. & D. Grewal (2000). The impact of technology on the quality-value-loyalty chain: a research agenda. Journal of the Academy of Marketing Science, 28(1), 168-174.
Parasuraman, A, Zeithaml, Valarie A. & Berry, L. L. (1994). Reassessment of expectations as a comparison standard in measuring service quality: Implications for future research. Journal of Marketing, January, 111-124.
Parasuraman, A, Zeithaml, Valarie A. & Berry, L. L. (1985). A conceptual model of service quality and its implications for future research. Journal of Marketing, 49, 41-50.
Ratcliffe, J. & Falnagan, S. (2004). Enhancing the vitality and viability of town and city centers the concept of the business improvement district the context of tourism enterprise. Property Management, 22(5), 377-395.
Severt, D., Wang, Y., Chen, P. & Breiter, D.(2007). Examining the motivation, perceived performance, and behavioral intentions of convention attendees: Evidence from a regional conference. Tourism Management, 28, 399-408.
Tasci, A. D. A., Gartner, W. C. & Cavusgil, S. T. (2007). Conceptualization and operationalization of destination image. Journal of Hospitality & Tourism Research, 31(2), 194-223.
Truong, T. & Foster, D. (2006). Using HOLSAT to evaluate tourist satisfaction at destinations: The case of Australian holidaymakers in Vietnam, Tourism Management, 27, 842-855.
Woodruff, R. B. (1997). Customer value: the next source for competitive advantage. Journal of the Academy of Marketing Science, 25(2), 139-153.
Yu, L. & Goulden, M. (2006). A comparative analysis of international tourists’ satisfaction in Mongolia. Tourism Management, 27(6), 1331-1342.
Zeithaml, V.A. (1988). Consumer perceptions of price, quality and value: A means-ends model and synthesis of evidence. Journal of Marketing, 52, 2-22.