www.ijcmr.com
Section: Anatomy
International Journal of Contemporary Medical Research
ISSN (Online): 2393-915X; (Print): 2454-7379 | ICV: 98.46 | Volume 6 | Issue 10 | October 2019 J1
Anthropometric Evaluation of Cranial Indexes
Rumeysa Gamze Taskin Senol1, Nazire Kilic Safak1, Ahmet Hilmi Yucel1
ORIGINAL RESEARCH
ABSTRACT
Introduction: Craniometric measurements are used in
anatomy, anthropometry and surgical fields, especially in maxillofacial and plastic surgery. The aim of this study was to investigate the cranial index values anthropometrically and to contribute to the literature data.
Material and methods: For this purpose, 30 cranium
bones with unknown age and gender belonging to Anatomy Department, Faculty of Medicine and University of Cukurova were used.
Results: In this study, maximum cranial width, maximum
cranial length, bizygomatic width, cranial height, upper face height and minimum frontal width were measured. The mean and standard deviation values of the measured values are; 139.15 ± 9.89, 172.20 ± 7.90, 125.24 ± 9.47, 126.07 ± 6.23, 65.07 ± 5.40, 95.33 ± 5.09 mm, respectively. By using these values, cranial index, transverse cranio - facial index, cranial height - width index, cranial height - length index, upper facial index and fronto - parietal index values were calculated. The mean and standard deviation of index values are 81.59 ± 5.60, 90.21 ± 6.69, 92.30 ± 6.16, 73.73 ± 3.79, 52.61 ± 5.52, 68.76 ± 4.86 mm, respectively.
Conclusions: The results of our study were classified and
compared with the studies performed in different populations. We believe that the obtained data will contribute to the research and literature data in clinical areas.
Keywords: Cranium, Skull, Cranial Index, Anthropometry,
Anatomy, Surgery INTRODUCTION
Cranium is the head of the skeleton that is formed by twenty-two bones jointing each other. When one hyoid bone and three pairs of ear ossicles are added, they become twenty-nine in totally. Cranium is examined under two sub-headings according to their surrounding structures. The part that surrounds the brain is called neurocranium, and the part that surrounds the oral and nasal cavities is called splanchnocranium (viscerocranium). There are eight bones in the neurocranium surrounding the brain and fourteen bones in the splanchnocranium surrounding the face. These bones belong to flat and irregular bone groups. All the bones except the mandible bone are connected to each other by immobilized joints. The joints are called sutures. Some of the bones that consists the skeleton are involved in the structure of both neurocranium and splanchnocranium. The hyoid bone is actually a neck bone. It only has the same origin as the cranial bones.1
Anthropometry identifies the dimensions of the human body and provides information about growth and development. Morphological differences are influenced by genetic and environmental factors. In general, adult men have larger and
stronger bones. As people get older, cranium bones become thinner. In these individuals; the bone marrow loses blood cells and adipose tissue and a gelatinous appearance occurs.2
Cranial anthropometry is an increasingly important area for anatomists, anthropologists and plastic surgeons.3-9 Besides
metric measurements on the cranium, another method that provides information about the cranial morphology is cranial indexes. Cranial index calculation; is a method used to categorize human populations. In this study, craniometric measurements were made with the previously defined parametric values; and various index values were calculated with these measurements. These indexes provide information about the morphology of the head and face of the societies as well as the effects of various factors on the development of head and face. In addition, it is important in planning surgical procedures. The aim of this study was to investigate the cranial index values anthropometrically and to contribute to the literature data.
MATERIAL AND METHODS
In our study, 30 cranium whose age and sex were not known belonging to Cukurova University, Faculty of Medicine, Department of Anatomy were used. This study which has a descriptive and cross-sectional design. For statistical analysis of the data obtained in this study, the "Statistical Package for Social Sciences for Windows 20.0" program was used. Descriptive statistical methods (mean, standard deviation, frequency%, minimum, maximum value) were used to evaluate the study data. Measurements were made with caliper (0.1 mm). The parameters measured in our study are given in Figure 1.
Measured parameters
Maximum cranial width: Also called “the maximum
transverse width”, it is the linear distance measured between the eurion points located on both parietal bones.
Maximum cranial length: In the sagittal plane, it is the
largest distance measured between the glabella and the opisthocranion, which is the most protruding point on the occipital bone.
1Department of Anatomy, Faculty of Medicine, University of
Cukurova, Adana, Turkey
Corresponding author: Rümeysa Gamze Taşkin Şenol,
Department of Anatomy, Faculty of Medicine, University of Cukurova, Adana, Turkey
How to cite this article: Rumeysa Gamze Taskin Senol, Nazire
Kilic Safak, Ahmet Hilmi Yucel. Anthropometric evaluation of cranial indexes. International Journal of Contemporary Medical Research 2019;6(10):J1-J4.
Senol, et al. Anthropometric Evaluation of Cranial Indexes
International Journal of Contemporary Medical Research Volume 6 | Issue 10 | October 2019 | ICV: 98.46 | ISSN (Online): 2393-915X; (Print): 2454-7379 J2
Section: Anatomy
Bizygomatic width: It is the linear distance measured
between zygion points, which are the most lateral points on arcus zygomaticus.
Cranial height: The linear distance measured between
basion and bregma points.
Upper face height: The distance between nasion and
prosthion points.
Minimum frontal width: It is the smallest distance between
the frontotemporale points on the temporal crest on the frontal bone.
Calculated index values
Cranial Index = Maximum Cranial Width ÷ Maximum
Cranial Length × 100
This index, also called “Horizontal Cranial Index”, is used to define the top view of the skull. Index classification and results are examined in seven categories2,6-11, which are
ultradolichocranial / very long (≤ 65), hyperdolichocranial / very long (65 - 69.9), dolichocranial / long (70 - 74.9), mesocranial / medium (75 - 79.9), brachycranial / round (80 - 84.9), hyperbrachycranial / very round-short (85 - 89.9), ultrabrachycranial / very round / short (≥ 90).
Transverse Cranio - Facial Index = Bizygomatic Width ÷
Maximum Cranial Width × 100
The index value is evaluated in two categories.5 These are
criptozygy (≤ 99.9), phenozygy (≥ 100).
Cranial Height - Width Index = Cranial Height ÷ Maximum
Cranial Width × 100
This index is used to define the relationship between the height and width of the skull. Index values are examined in three categories3,8,12,13, which are tapeinocrane / low (≤ 92),
metriocrane / medium (92 - 97.9), acrocrane / high (≥ 98).
Cranial Height - Length Index = Cranial Height ÷
Maximum Head Length × 100
This index is used to define the relationship between the height and length of the skull. Index values are examined in three categories4,14,15, which are chamaecrane / low (≤ 70),
orthocrane / medium (70 - 74.9), hypsicrane / high (≥ 75).
Upper Facial Index = Upper Face Height ÷ Bizygomatic
Width × 100
This index provides information on the relationship between the height of the upper face and the width of the face and the shape of the upper face. Calculated index values are examined in five categories2,13, which are hypereuryene /
very wide / low (≤ 45), euryene / wide / low (45 - 49.9), mesene / medium (50 - 54.9), leptene / narrow / high (55-59.9), hyperleptene / very narrow / high (≥ 60).
Transverse Fronto-Parietal Index = Minimum Frontal
Width ÷ Maximum Cranial Width × 100
This index is used to define the relationship between frontal and cranial width. Index values are examined in three categories14, which are sthenometopia / narrow forehead (≤
66), metriometopia / middle face (66 - 68.9), eurymetopia / wide forehead (≥ 69).
RESULTS
In our study, calculated index values were used to determine head types. Cranial index; brachycranial, transverse cranio - facial index; criptozygy, cranial height - width index; metriocrane, cranial height - length index; orthocrane, upper facial index; mesene and transverse fronto - parietal index determined that belongs to the metriometopia classification. The mean and standard deviation values of the measured
Parameters Mean ± Standard Deviation (mm)
Maximum Cranial Width 139.15 ± 9.89
Maximum Cranial Length 172.20 ± 7.90
Bizygomatic Width 125.24 ± 9.47
Cranial Height 126.07 ± 6.23
Upper Face Height 65.07 ± 5.40
Minimum Frontal Width 95.33 ± 5.09
Table-1: Mean and standard deviation values of parameters Index Values Mean Classification
Cranial Index 81.59 Brachycranial
Transverse Cranio - Facial Index 90.21 Criptozygy
Cranial Height - Width Index 92.30 Metriocrane
Cranial Height - Length Index 73.73 Orthocrane
Upper Facial Index 52.61 Mesene
Transverse Fronto - Parietal
Index 68.76 Metriometopia
Table-2: Mean results and classification of index values
Author Population Maximum Cranial Width Maximum Cranial Length
Salve et al.16 India 136.61 ± 3.43 177.705 ± 7.32
Kenneth et al.9 Nigeria 140.28 ± 3 172.9 ± 2.8
Khan et al.10 Arabia 151.72 ± 6.33 188.03 ± 9.71
Shankar et al.19 India - 214.3 ± 9.4
The present study Turkey 139.15 ± 9.89 172.20 ± 7.90
Table-3: Maximum cranial width and maximum cranial length mean ± standard deviation (mm) values
Figure-1: Measured parameters, a-b; minimum frontal width, c-d;
bizygomatic width, e-f; maximum cranial width, g-h; maximum cranial length, i-j; cranial height, k-l; upper face height
Senol, et al. Anthropometric Evaluation of Cranial Indexes
International Journal of Contemporary Medical Research
ISSN (Online): 2393-915X; (Print): 2454-7379 | ICV: 98.46 | Volume 6 | Issue 10 | October 2019 J3
Section: Anatomy
parameters are shown in Table 1. Calculated index values mean and standard deviation values are shown in Table 2.
DISCUSSION
A study conducted in 2013 showed that the mean and standard deviation values of the parameters were as follows: cranial height 130.68 ± 7.77 mm The maximum cranial width and the maximum cranial length results obtained in our study are similar to the literature data but Khan et al. and Shankar et al. showed that the values were found to be higher than our results.10-17 These results are shown that
Table 3. Upper face height values in the literature were found to be low compared to the results in our study. Some of these studies, Erden showed that the upper face height of males and females was 5.2 and 5.1 cm, respectively.18 A study
which was conducted in Turkish population reported the upper face height of males and females as 5.3 and 4.94 cm, respectively.19 Also, upper face height value was calculated
as 54.01 and 50.18 mm in the United States.20 In our study,
this value was found as 65.07 ± 5.40. The nearest values to our study belong to Önal's study in Turkish population; the upper face height for Turkish males and females as 7.52 cm and 7.85 cm, respectively. The mean value was 7.76 ± 0.635 cm.12 A study which conducted in Nigeria showed that the
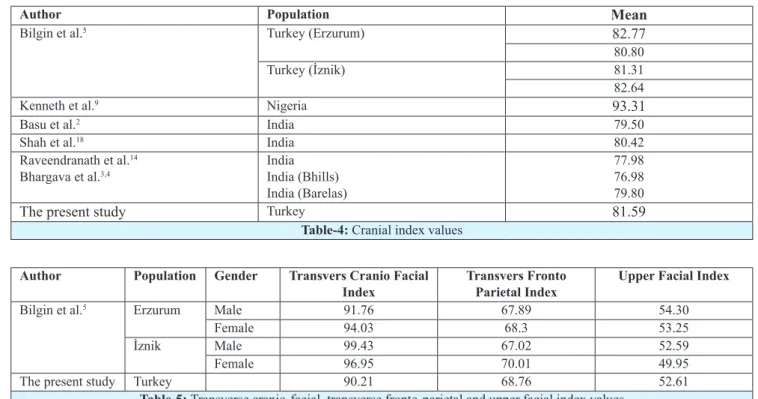
cranial index value was found to be higher than our results. Among the cranial index value studies in the literature, results showed that the similarities when compared to our values.2,6-11 These results are shown in Table 4. Bilgin et al.
compared the populations of Erzurum and Iznik. While the transverse cranio-facial index value in the Iznik population was found to be higher than our results, the other index results were in close proximity with our results.2 This results
are shown that Table 5. Compared to our study; Salve et al. and Saharma et al. showed that the cranial length index and height index values were found to be parallel and Rexhepi et al. and Dubey et al. showed that these results were found to be lower.4,14,15,21 These results are shown in Table 6. Sengupta S.
studied cranial height-width index and cranial height-length index in India. In the study, the mean cranial height-length index values were: 72.43 ± 1.36 for Koch; 64.45 ± 0.51 for Rabha; 64.31 ± 0.53 for Garo; 69.71 ± 0.56 for Kachari; 72.02 ± 0.79 for Lalung and 68.18 ± 0.56 for Mikir. In the study, mean cranial height - width index values were: 92.39 ± 1.77 for Koch; 85.53 ± 0.71 for Rabha; 85.33 ± 0.69 for Garo; 88.01 ± 0.73 for Kachari; 91.65 ± 1.11 for Lalung and 86.78 ± 0.69 for Mikir. In our study, cranial height - width index was found as 92.30, and cranial height-length index
Author Population Mean
Bilgin et al.5 Turkey (Erzurum) 82.77
80.80
Turkey (İznik) 81.31
82.64
Kenneth et al.9 Nigeria 93.31
Basu et al.2 India 79.50
Shah et al.18 India 80.42
Raveendranath et al.14
Bhargava et al.3,4 IndiaIndia (Bhills)
India (Barelas)
77.98 76.98 79.80
The present study Turkey 81.59
Table-4: Cranial index values Author Population Gender Transvers Cranio Facial
Index Transvers Fronto Parietal Index Upper Facial Index
Bilgin et al.5 Erzurum Male 91.76 67.89 54.30
Female 94.03 68.3 53.25
İznik Male 99.43 67.02 52.59
Female 96.95 70.01 49.95
The present study Turkey 90.21 68.76 52.61
Table-5: Transverse cranio-facial, transverse fronto-parietal and upper facial index values
Author Population Cranial Height Width Index Cranial Height Length Index
Salve et al.16 India 95.67 ± 5.26 73.56
Rexhepi et al.15 Kosovo 77.14 64.41
75.22 63.72
Dubey et al.6
Saharma et al.20 IndiaIndia 107.02 ± 1.2071.26
81.74 ± 1.06
76.80
-The present study Turkey 92.30 ± 6.16 73.73
Senol, et al. Anthropometric Evaluation of Cranial Indexes
International Journal of Contemporary Medical Research Volume 6 | Issue 10 | October 2019 | ICV: 98.46 | ISSN (Online): 2393-915X; (Print): 2454-7379 J4
Section: Anatomy
was found as 73.73.22 In the study performed by Yesmin et
al., the mean and standard deviation value of bizygomatic width was found as 127.3 ± 8.0 mm. It shows parallelism with our results.5 In a study conducted by Gabarre-Mir et
al., the relationship between morphological structure of arcus zygomaticus and some psychological features was investigated. Subjects were separated into two groups according to pre-determined scales and self-sufficiency level measurement and skill research results. As a result, in terms of the bizygomatic width, the mean and standard deviation values were 137.05 ± 7 and 124.38 ± 6.52 mm, respectively.23
CONCLUSION
The organs responsible for eye and vision, nose and odor, chewing and tasting, swallowing, vocalization and speech, hearing and balance are established in the head area with their very complex structures. Many of these clinical problems are directly related to their anatomical structures. Diagnosis and treatment are impossible without anatomical knowledge. This research can be useful for clinical and research purposes for anatomists, anthropologists, forensic medicine experts, neurosurgeons, plastic surgeons.
REFERENCES
1. Yücel A.H. Dere anatomi atlası ve ders kitabı. 7. baskı. Akademisyen kitabevi. Adana. 2018.
2. Bilgin T, Sülün T, Özbek, M, Beyli M. Yakınçağ Anadolu insanlarında yüz iskeletlerinin biyometrik incelemesi. Journal of Istanbul University Faculty of Dentistry. 1995;29:57-64.
3. Praveen KDR, Janaki CS, Vijayaraghavan V, Delhi RU. A study on measurement and correlation of cephalic and facial indices in male of South Indian population. International Journal of Medical Research & Health Sciences. 2013;2:439–446.
4. Salve V, Chandrashekhar C. The study of vertical cephalic index (length - height index) and transverse cephalic index (breadth - height index) of Andhra Region (India). Asian Journal of Medical Science. 2013;3:6-11.
5. Yesmin T, Thwin SS, Urmi SA, Wai MM, Zaini PF et al. A study of facial index among Malay population. Journal of Anthropology. 2014;726974:1-5.
6. Basu A. Anthropometry of the Kayasthas of Bengal. J Anat Soc India. 1963;3:20-25.
7. Bhargava I, Kher GA. A anthropometric study of Central India Bhils of Dhar district of Madhya Pradesh. J Anat Soc India. 1960; 9:14-9.
8. Bhargava I, Kher GA. A comparative anthropometric study of Bills and Barelas of Central India. J Anat Soc India. 1961;10:26-33.
9. Kenneth YL, Tombari GJ. Head length, head breadth and cephalic index: A craniometric study amongst the Urhobo ethnic group in Delta State of Nigeria. European Journal of Biomedical and Pharmaceutical Sciences. 2017;4:157-160.
10. Raveendranath V, Manjunath KY. An anthropometric study of correlation between cephalic index, cranial volume and cranial measurements in Indian cadavers. Indian Science Abstract0. 2010;15:1-6.
11. Shah GV, Jadhav HR. The study of cephalic index in students of Gujarat. J Anat Soc India. 2004;53:25-26. 12. Önal T. Üniversite öğrencilerinin yüz antropometrik
ölçümlerinin artistik anatomi açısından fotografik analiz yöntemleriyle değerlendirilmesi. PhD, Trakya University, Edirne, 2014.
13. Vallois HV. Anthropometric techniques. Current Anthropology. 1965;6:127-143.
14. Dubey S, Sharma T. A face recognition system through somatology. International Journal on Computer Sciences and Engineering. 2011;3:155-159.
15. Rexhepi A, Meka V. Cephalofacial morphological characteristics of Albanian Kosova population. Int J Morphol. 2008; 26:935-940.
16. Khan MA, Chaudhry MN, Altaf FMN. Cranial measurements; estimation of stature from cranial measurements. Professional Medical Journal. 2015;22:1034-1038.
17. Shankar GS. Correlatıon of human height with head length in Indian individuals. International Journal of Anatomy and Research. 2017;5:4723-4726.
18. Erden N. Yetişkin Türk kadın ve erkeklerinde baş ve yüze ait antropometrik ölçümler ve indeksler. PhD, Trakya University, Edirne, Turkey. 2005.
19. Müftüoğlu A. Yetişkin Türk kadınlarında bazı vücut ölçümleri ve aralarındaki oranlar. Master Thesis, Cerrahpasa Medical Faculty, Istanbul, Turkey. 1981. 20. Young WJ. Head and face anthropometry of adult US
civilians. Office of Aviation Medicine: Washington. 1993;44: 1-12.
21. Sharma AA. Contemporary studies in anthropometry. 1st
ed. Sarup & Sons, New Delhi. 2007;19-29.
22. Sengupta S. Anthropological studies among the Koch population of golapara district of Assam. Bulletins et Mémoires de la Société d'Anthropologie de Paris. 1990;2:203-212.
23. Gabarre-Mir J, Navarro-Pastor JB, Gabarre-Armengol C, Estaún-Ferrer S. Bizygomatic width and its association with social and personality traits in males. Int J Morphol. 2017;35:1037-1042.
Source of Support: Nil; Conflict of Interest: None