Plasmon-enhanced
fluorescence in gold
nanorod-quantum dot coupled systems
Liudmila Trotsiuk
1, Alina Muravitskaya
1, Olga Kulakovich
1,
Dmitry Guzatov
2, Andrey Ramanenka
1, Yusuf Kelestemur
3,
Hilmi V Demir
3,4,5and Sergey Gaponenko
11
B.I. Stepanov Institute of Physics, National Academy of Sciences of Belarus, Minsk 220072, Belarus 2Yanka Kupala State University of Grodno, Grodno 230023, Belarus
3UNAM–Institute of Materials Science and Nanotechnology, Bilkent University, Ankara 06800, Turkey 4
Department of Electrical and Electronics Engineering, Department of Physics, Bilkent University, Ankara 06800, Turkey
5
LUMINOUS! Center of Excellence for Semiconductor Lighting and Displays, School of Electrical and Electronic Engineering, School of Physical and Mathematical Sciences, Nanyang Technological University, Singapore 639798, Singapore
E-mail:[email protected]
Received 3 September 2019, revised 17 October 2019 Accepted for publication 21 November 2019
Published 16 December 2019 Abstract
Plasmon–exciton coupling is of great importance to many optical devices and applications. One of the coupling manifestations is plasmon-enhancedfluorescence. Although this effect is demonstrated in numerous experimental and theoretical works, there are different particle shapes for which this effect is not fully investigated. In this work electrostatic complexes of gold nanorods and CdSe/CdZnS quantum dots were studied. Double-resonant gold nanorods have an advantage of the simultaneous enhancement of the absorption and emission when the plasmon bands match the excitation andfluorescence wavelengths of an emitter. A relationship between the concentration of quantum dots in the complexes and the enhancement factor was established. It was demonstrated that the enhancement factor is inversely proportional to the concentration of quantum dots. The maximalfluorescence enhancement by 10.8 times was observed in the complex with the smallest relative concentration of 2.5 quantum dots per rod and approximately 5 nm distance between them. Moreover, the influence of quantum dot location on the gold nanorod surface plays an important role. Theoretical study and experimental data indicate that only the position near the nanorod ends provides the enhancement. At the same time, the localization of quantum dots on the sides of the nanorods leads to thefluorescence quenching. Keywords: plasmon–exciton coupling, gold nanorods, gold nanorod-quantum dot complexes, plasmon-enhancedfluorescence
(Some figures may appear in colour only in the online journal) 1. Introduction
Quantum dots(QDs), due to the quantum confinement effect, are fascinating materials with unique optical properties[1,2].
Strong size-dependent emission of QDs determines their wide application in different areas[3,4] particularly in LEDs and
TV displays[5–8], solar cells [9], lasers [10,11] as well as
biomedical diagnostics[12,13]. Nowadays, much attention is
devoted to the study of the plasmon–exciton coupling, which
occurs in hybrid plasmonic-quantum emitter (dye molecules or QDs) systems. In such systems, the interactions can exist in two different regimes: strong and weak coupling regimes. Strong coupling is achieved in the case when the frequency of the plasmon oscillations coincides with the emitter frequency and they are in close proximity to each other. Under these conditions, when the nanoparticle approaches the emitter, their states hybridize and form two new levels of upper and lower energy than the initial ones, which is called the strong
multiplies all effects[26–28].
Plasmon-enhanced fluorescence of QDs is a subject of great interest for its potential to increase the sensitivity of diagnostic methods and to improve the fluorescent char-acteristics of different optical devices[29–31]. The
plasmon-enhancedfluorescence appears due to the localization of the electromagnetic field and an increase in the radiative decay rate near the plasmonic nanoparticle [32]. However, in the
close vicinity of the plasmonic nanoparticles the non-radiative decay rate also extremely grows. For the short distances non-radiative relaxation dominates the enhancement process, which leads to the quenching [33]. Therefore, the
enhance-ment factor highly depends on the distance between plas-monic nanoparticles and emitter[32,33]. Many experimental
works show, that the maximal fluorescent enhancement can be obtained when the emitter is located at the distance of 10–20 nm from the plasmon nanoparticle [34–38].
Because of the anisotropic shape, gold nanorods(GNRs) are prospective plasmonic structures, which feature two localized surface plasmon resonances: transversal and long-itudinal[39]. The longitudinal plasmon resonance depends on
the aspect ratio of nanorods and can be tuned in a wide spectral region[40]. Therefore, GNRs can be a promising tool
for enhancing any fluorescent system in visible and infrared regions [41, 42]. The majority of studies of the GNR
enhancedfluorescence uses molecular fluorophores with low quantum efficiency as emitters [34,35,43,44]. There are few
investigations on the fluorescence enhancement of quantum dots by GNRs with small enhancement factors(about 5 times) [45], quenching [46] or even without interaction between
them [47]. Moreover, only few groups varied the relative
concentration of the QD and nanorods to study the fluor-ophore distribution around the gold nanorods[45] or to
pre-vent Fӧrster resonance energy transfer between them [34].
However, the influence of the concentration and position of quantum dots coupled with gold nanorods on thefluorescence enhancement behavior was not investigated.
In this work, we studied electrostatic complexes of gold nanorods and CdSe/CdZnS quantum dots and considered the influence of QD amount at different distances in such com-plexes on the fluorescence enhancement. We show that the relative concentration as well as position of QDs on the GNR surface play a decisive role in thefluorescence enhancement.
All glassware was previously cleaned in aqua regia.
2.2. Synthesis of gold nanorods
The GNRs with average length of 45 nm and diameter of 19 nm were synthesized via seed-mediated growth method [40]. According to the procedure, seed solution was prepared
by mixing 1.25 ml of 0.5 mM HAuCl4solution with 1.25 ml
of 0.1 M CTAB solution under constant stirring. After adding 15μl of 0.2 M ice-cold solution of fresh-prepared NaBH4, the
mixture became brownish-yellow. Seed solution was stirred for 1 min and allowed to stand for 2 h to the particle aging. In the next stage, the growth solution was prepared mixing 45 ml of 0.1 M CTAB, 1.35 ml of 4 mM AgNO3and 45 ml of 1 mM
HAuCl4. The subsequent addition of ascorbic acid (0.5 ml,
0.1 M) resulted in discoloration of bright orange mixture. Then, 150μl of seeds was added to the growth solution. The colloidal solution was left overnight.
2.3. Polyelectrolyte deposition on gold nanorods
Before use, GNRs were purified from the excess of CTAB by centrifugation at 10 000 rpm for 12 min repeated three times. After the last centrifugation, GNRs were redispersed in the half of the original volume with deionized water. GNRs were coated with 2, 4 and 6 polyelectrolyte (PE) layers via layer-by-layer technique [48]. For polyelectrolyte deposition,
10 mg/ml solutions of PSS and PDADMAC were prepared in 10 mM aqueous NaCl solution. Because GNRs had a positive charge on the surface, 1 ml of their solution was addedfirst to 300μl of negative charged PSS solution. After 30 min, the mixture was twice centrifuged at 10 000 rpm for 15 min and redispersed in deionized water. The same manipulations were repeated for deposition of next polyelectrolyte layers. After coating of GNRs with required number of polyelectrolyte layers(2, 4 and 6), GNRs had positive charge because of the last PDADMAC layer.
2.4. Synthesis of CdSe/CdZnS quantum dots
The red-emitting CdSe/CdZnS core/shell quantum dots in hexane were synthesized similar to that paper[49]. After the
synthesis quantum dots were solubilized in water and stabi-lized by thioglycolic acid. The quantum efficiency after the solubilization was 0.2.
2.5. Formation of gold nanorod-quantum dot electrostatic complexes
4 solutions containing GNRs coated with 0, 2,4 and 6 poly-electrolyte layers were diluted to the same concentration (1 × 10⁻¹⁰M). GNR concentration was calculated using the
molar extinction coefficient ε615=4.3 × 10⁹L mol−1cm−1
[50]. Next, aqueous solution of CdSe/CdZnS quantum dots
stabilized with thioglycolic acid was added to GNRs solutions in certain amounts to achieve QD/GNR ratio of 2.5, 5, 7, 10, 12, 27 and 51 at pH 8. CdSe/CdZnS concentration was cal-culated with a use of a molar extinction coefficient according to work [51]. Solutions of the pure quantum dots in water
with the same amounts were used as reference solutions. Because the thickness of CTAB bilayer was about 3.2 nm [52], the distance between GNRs and QDs in complexes with
2, 4 and 6 PE layers was not less than 5, 7 and 9 nm respectively (the thickness of a PE layer is considered as about 1 nm) [53].
2.6. Characterization
Transmission electron microscopy (TEM) images were acquired with a Hitachi S-806TEM/SEM electron micro-scope. Vis-NIR spectra were measured on a Cary 500 Scan UV–vis/near-IR spectrophotometer. Zeta-potential were measured on a Malvern Zetasizer Nano ZS90.
2.7. Fluorescence measurements
Fluorescence was studied under excitation by 532 nm cw Nd-laser. Spectra were recorded at room temperature with a LN-cooled charge-coupled-device (CCD) coupled to a grating spectrometer. Absolute fluorescence quantum yield was measured on the Spectrofluorometer Fluorolog-3 (Horiba Scientific) using Quanta-Phi integrating sphere.
For the calculations of the fluorescence enhancement factor and changes in radiative and non-radiative decay rates we used the well-established approach to modelfluorescence of a probe dipole (a quantum dot) located near an Au
nanospheroid. The calculation scheme has been described elsewhere[38].
3. Results and discussion
3.1. Formation of electrostatic complexes
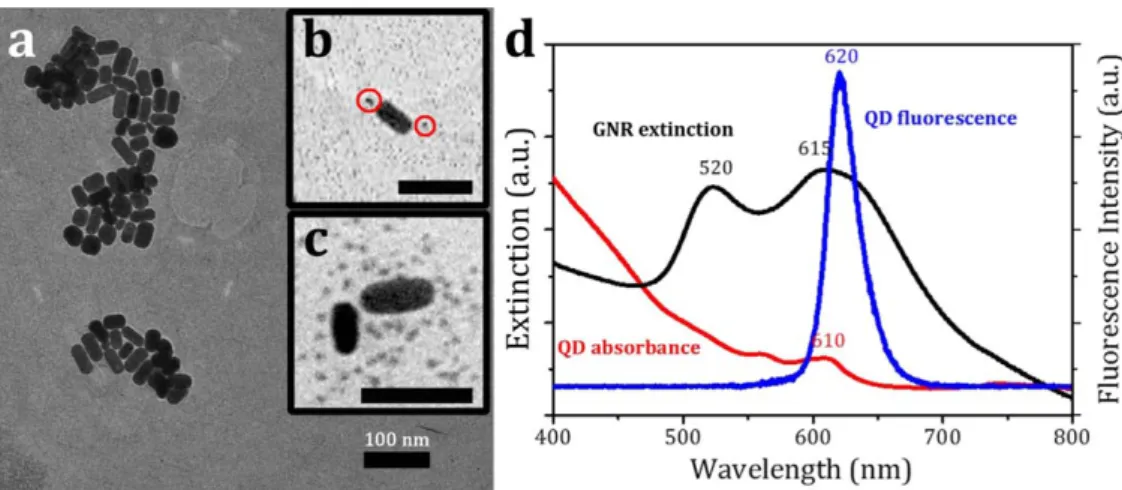
TEM image of gold nanorods is presented infigure1(a). Their
average size was estimated to be 40×17 nm. The extinction spectra of GNRs(figure1(d)) featured two localized surface
plasmon resonances: transversal at 520 nm and longitudinal at 615 nm. These maxima well coincided with absorbance and emission bands of the CdSe/CdZnS QDs that is the necessary conditions to obtain the fluorescence enhancement [7, 38].
Thefluorescence maximum of QDs was at 620 nm and their quantum efficiency was measured to be 0.2. Due to the fact that the longitudinal plasmon resonance depends on the aspect ratio of GNRs and is tunable in a wide spectral region, complexes with GNRs can be applied to enhance a perfor-mance of a great variety offluorescent systems.
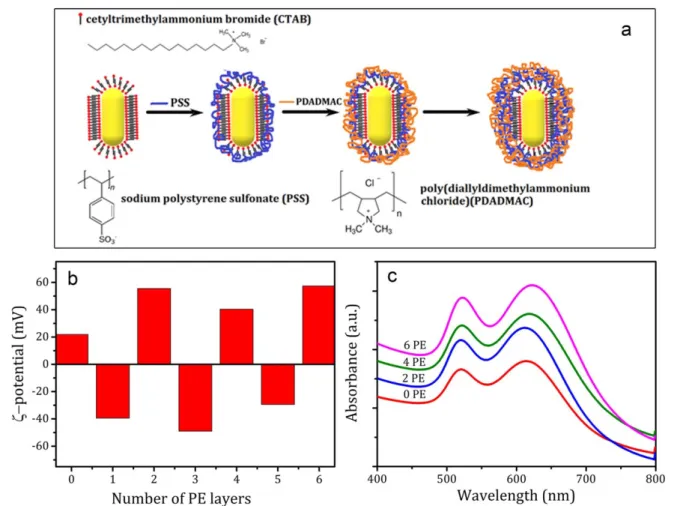
To control the distance between GNR and QDs in complexes, GNRs were coated with 2, 4 and 6 polyelectrolyte layers (figure 2(a)). The first layer of the negative
polyelec-trolyte poly(sodium 4-styrenesulfonate) (PSS) was deposited on the GNR surface, which was positively charged, due to the cetrimonium bromide (CTAB) bilayer. Then the layer of positive polyelectrolyte poly(diallyldimethylammonium chloride) (PDADMAC) was deposited. The procedure was repeated for thicker spacer. The last layer was always posi-tive. The polyelectrolyte deposition on the GNR surface was controlled by zeta-potential measurements. Zeta-potential of original uncovered GNRs was about +20 mV (figure 2(b)).
After deposition of each PE layer, we observed the surface recharge, which indicated the successful deposition of PEs. Moreover, a small red shift (up to 8 nm) of longitudinal plasmon resonances in absorbance spectra of GNRs were observed after polyelectrolyte deposition (figure 2(c)).
Because the longitudinal plasmon resonance of gold nanorods is extremely sensitive to the environment [41,54], this small Figure 1.(a) TEM image of the original GNRs. The average size is 40×17 nm. (b) TEM image of complexes with 2 polyelectrolyte layers
as a spacer and 2.5 QDs per nanorod.(c) TEM image of complexes with 2 polyelectrolyte layers as a spacer and 27 QDs per nanorod. The scale bar is 100 nm.(d) Absorbance and fluorescence spectra of CdSe/CdZnS quantum dots and extinction spectrum of GNRs.
shift indicates the absence of the aggregation in systems and is a result of changing of the local refractive index near nanoparticles (from 1.33 for water to about 1.5 for poly-electrolytes) [55–57]. All solutions were diluted to the
con-centration of 1× 10⁻¹⁰M to minimize particle aggregation. Figure1(b) and c show TEM images of complexes formed
with 2 PE layers as a spacer and with the smallest and large amounts of QD per nanorod 2.5 and 27, respectively. The solutions of all complexes except the complexes without polyelectrolyte spacer were stable for a few weeks. The complexes without spacer precipitated the next day, probably, because of a quit low origin charge of gold nanorods (figure 2(b)) that was reduced after the electrostatic QD
deposition and could not provide an efficient stabilization of the colloidal solution.
3.2. Fluorescence experiment
There are extensive theoretical calculations and experiments that describe conditions for obtaining plasmon-enhanced fluorescence. [34,35,58–63] First, it is necessary to overlap
the absorption and/or emission spectra of the emitter with a localized surface plasmon resonance(LSPR) of noble metal nanoparticles. Secondly, many works state the optimal dis-tance between an emitter and a spherical plasmonic
nanoparticle is 10–20 nm. According to the theoretical cal-culations [64, 65], the ratio of radiative decay rate to total
decay rate is extremely high in a close proximity to gold nanorod surface in the case of an emitter placed on the nanorod tip[64]. While the emitter location at short distances
from the nanorod side features a high probability of non-radiative transitions, which results in quenching of the fluorescence. Thereby, in the case of gold nanorods, the obtaining of the enhanced signal, besides the control of the distance, requires to‘set’ an emitter on the end of a nanorod. The modification of gold nanorod ends for their further che-mical bonding with afluorophore is the current challenge on which many studies are focused[43,66–68]. Additionally, in
GNRs the excitation of the longitudinal plasmon resonance leads to the localization of the strong electromagnetic field around nanorod ends resulting in an additional fluorescence enhancement. At the same time, the excitation of the trans-versal plasmon resonance results in a weakerfield localization near GNRs sides[64,65,69].
In this work, we used 532 nm excitation wavelength, which matched both the transversal plasmon resonance of GNRs and the absorbance band of QDs. At the same time, QD emission band was well overlapped with the longitudinal plasmon resonance of GNRs. We investigated the influence of
Figure 2.(a) The scheme of the electrostatic deposition of polyelectrolytes on the gold nanorod surface. Results of PE covering of the GNRs:
(b) the zeta-potential measurements of gold nanorods before and after polyelectrolyte coating; (c) absorption spectra of GNRs as a function of number of polyelectrolyte layers: red curve: original GNRs, blue curve: GNRs coated with 2 PE layers, green curve: GNRs coated with 4 PE layers, magenta curve: GNRs coated with 6 PE layers.
the QD concentration and their position in complexes with GNRs on thefluorescence enhancement.
Figure3shows the results of the fluorescence measure-ments of aqueous complexes with different amounts of CdSe/ CdZnS quantum dots and various number(0, 2, 4 and 6) of polyelectrolyte layers on the GNR surface. Thefluorescence intensity grows linearly with the increasing of the quantum dot concentration in a bare quantum dot solution(figure3(a)),
due to an increase in the number of emitters. However we found that at certain QD amount the curve slope of fluores-cence intensity versus concentrations changes, indicating that probably higher concentration of dots results in their partial aggregation and some quenching offluorescence. Moreover, for each GNR-QDs complex(figure 3(b)–(e)) there is some
quasilinear segment in the region of 2.5–12 QDs per rod, in which thefluorescence intensity rises rapidly with increasing in QD amount. This behavior is related to the augmentation of emitter numbers as in the case of the bare QD solution. Then, the saturation occurs and the intensity falls. When QDs are bound electrostatically with GNRs and localized around them, the increasing of QD amount leads to close contact between them resulting influorescence self-quenching [70].
The map of thefluorescence intensity distribution (figure3(f))
shows the maximal intensity can be obtained in complexes without spacer and containing at average 12 QDs per rod.
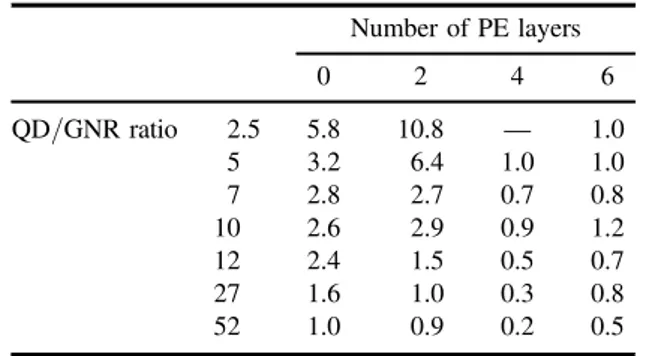
The fluorescence enhancement factor (EF) strongly depends on the QD/GNR ratio as well (figure 4). It is
important to notice, the fluorescence enhancement was observed only in complexes with 0 and 2 PE layers(figure4),
which corresponds to approximately 3 and 5 nm respectively. Moreover, for all QD-GNR distances, the maximal
Figure 3.Results offluorescence measurements of bare QD solution (a) and GNR-QD coupled systems with different number of polyelectrolyte layers on the GNR surface(b)–(e); (f) the map of the fluorescence signal distribution depending on QD/GNR ratio and number of PE layers.
Figure 4.Experimental results of thefluorescence enhancement factor distribution depending on number of polyelectrolyte layers on GNR surface and QD/GNR ratio.
enhancement factor was obtained for the smallest(about 2.5) number of QDs per rod. In the complex with 2 PE layer shell and 2.5 QDs per rod, the maximal enhancement factor of 10.8 was obtained, which was almost 2-times higher than in the same complex without PE shell(table 1). The similar
beha-vior was observed at GNR-QD ratio 1:5. The strongest fluorescence signal was registered in complex with 2 PE layers and the enhancement factor was again 2-times higher than in the complex without PE-shell. It is interesting, that in complexes with 4 PE layers(QD/GNR ratio=5) and 6 PE layers (QD/GNR ratio=2.5–5) we observe neither enhancement or quenching, as if they are not affected by
Q0= 0.2. Moreover, the changes in radiative and nonradiative
decay rates depend on the QD-GNR configuration. Therefore, we considered two cases of the emitter placement: near the tip and near the side of a gold nanorod. The details can be retrieved in[38,71]. The gold nanorod is oriented along the
z-axis. The dipole moment orientation of the emitter d pointed at figures. The average enhancement factor 〈FPL〉 was
cal-culated as the averaging all the dipole moment orientations. According to the calculations(figure 5), the localization
of a QD on the side of a nanorod and the excitation of the transversal plasmon resonance lead to the fluorescence quenching for all dipole moment orientations and at all
Figure 5.Calculated enhancement factor(Fpl) dependence on the distance between a gold nanorod and an emitter (Δr) (532 nm excitation) for different dipole orientations and averaged over dipole orientations. d||x, d||y, d||z were its orientations along x, y and z-axes respectively. The emitter with the emission maximum(λem) at 620 nm and the quantum efficiency (Q0) of 0.2 was located on the nanorod side.
distances considered in our experiment. Because the relatively weakfield enhancement at this excitation cannot compensate the negative effect of non-radiative decay rates. Although the quenching disappears with an increase in the distance, the enhancement factor is still lower than 1 even at the distance of 10 nm.
Further, we considered the QD deposition on the GNR tip and two excitation wavelengths that match transversal and longitudinal plasmon resonances (figure 6). It is intriguing,
the 532 nm excitation used in the experiment does not provide thefluorescence enhancement as well (figure6(a)). The small
enhancement of 1.75 times is possible only for the normal dipole orientation(when the dipole moment of the emitter is
oriented along the z-axis) and at distance of 1 nm, because of the high radiative decay rates in this position. However, QD does not have any preferable dipole moment orientation; therefore, we should take into account only averaging of all orientations. The maximum of the average enhancement factor was 0.6 (that means quenching occurred) and appears at the distance of about 1 nm, while our experiment demon-strated thefluorescence enhancement in almost 11 times at the distance of about 5 nm(table1). Thus, the 532 nm excitation
leads to thefluorescence quenching of the emitter located in any position relative to the nanorod and at all distances in the region of 0–10 nm. Therefore, we prepared the calculation of the case of the longitudinal plasmon resonance excitation.
Figure 6.Calculated dependences of the enhancement factor(Fpl) on the distance between the gold nanorod and an emitter placed on the nanorod tip at 532 nm(a) and at 615 nm (b) excitations.
Figure 7.Experimental data onfluorescence enhancement factor versus QDs per gold nanorod number (circles) and fitting with the y=a+b/x function (a) for complexes without spacer, (b) for complexes with 2 PE layers as a spacer.
strongly enhanced the near-field. Moreover, since we used in our experiment the electrostatic bounding between gold nanorod and emitters, QDs are deposited on gold nanorod surface randomly. Consequently, the enhancement factor of this system should be the averaging of the fluorescence enhancement on ends and quenching on sides. In the case of the smallest QD amounts(2.5–5), probably, one quantum dot was placed on the end and gives the enhancement, while the others are localized near the sides and experience quenching. However, since the QD amount placed on the sides was small, we observed the maximal enhancement factors(table1). With
further increase in QD amount, much more QDs occupied places around GNR sides than on ends and the enhancement factor falls. As one can see from the calculations, at distances of 7–10 nm and the QD location on the nanorod end, theo-retically possible enhancement is minimal that explains the lack of the enhancement in complexes with 4 and 6 PE layers. Moreover, we found that the tendency of experimental fluorescence intensity enhancement factor was to fall down with QD concentration obeys a a+b/x dependence as is shown infigure7. It can be interpreted as follows. Fluores-cence enhancement factor appears to be inversely propor-tional to the dot concentration. Since only dots attached to the edges of every rod feature enhancement whereas, all extra dotsfind themselves near the side rod surface and experience fluorescence quenching. Additionally, a portion of dots always appear pretty far from any rod to give constant background expressed by the a term.
Thus, the enhancement factor can be controlled not only by changing the distance between gold nanorods and the emitter, but also by the amount of QDs adsorbed on the gold nanorod surface.
4. Conclusion
We have performed a systematic experimental study of the quantum dots fluorescence enhancement in the vicinity of gold nanorods. The dependence offluorescence enhancement on quantum dot concentration was investigated in electro-static complexes with different separation of a gold nanorod and quantum dots. We established that the enhancement factor is inversely proportional to the concentration of quantum dots in complexes with gold nanorods. The maximal enhancement factor (up to 11 times) was observed in the
the 532 nm excitation. These results have the practical importance, since the coupling of semiconductor nanocrystals with gold nanorods is useful for many optoelectronic devices e.g. LED, solar cells, luminescent solar concentrators etc. Acknowledgments
The work has been supported by the Belorussian State Pro-gram ‘Photonics, opto-and microelectronics 1.2.02’ and TUBITAK 115E679 project.
ORCID iDs
Liudmila Trotsiuk https://orcid.org/0000-0003-2072-3970
Alina Muravitskaya https: //orcid.org/0000-0003-1977-8499
Olga Kulakovich https://orcid.org/0000-0001-8618-6771
Dmitry Guzatov https://orcid.org/0000-0001-7413-8799
Andrey Ramanenka https: //orcid.org/0000-0002-6336-0578
Hilmi V Demir https://orcid.org/0000-0003-1793-112X
Sergey Gaponenko https: //orcid.org/0000-0003-3774-5471
References
[1] Brus L E 1984 Electron-electron and electron-hole interactions in small semiconductor crystallites: the size dependence of the lowest excited electronic state J. Chem. Phys.80 4403–9 [2] Ekimov A I, Efros A L and Onushchenko A A 1993 Quantum
size effect in semiconductor microcrystals Solid State Commun.88 947–50
[3] Kovalenko M V et al 2015 Prospects of nanoscience with ACS Nano9 1012–57
[4] Dhanabalan S C, Dhanabalan B, Ponraj J S, Bao Q and Zhang H 2017 2D-materials-based quantum dots: gateway towards next-generation optical devices Adv. Opt. Mater.5
1700257
[5] Shirasaki Y, Supran G J, Bawendi M G and Bulović V 2013 Emergence of colloidal quantum-dot light-emitting technologies Nat. Photon.7 933–933
[6] Gigli G, Manna L, Della Sala F, Cingolani R, Rizzo A, Zanella M, Li Y, Kudera S and Parak W J 2007 Blue light
emitting diodes based onfluorescent CdSe/ZnS nanocrystals Appl. Phys. Lett.90 051106
[7] Gaponenko S V and Demir H V 2018 Applied Nanophotonics (Cambridge: Cambridge University Press)
[8] Kim T H et al 2011 Full-colour quantum dot displays fabricated by transfer printing Nat. Photon.5 176–82 [9] Kamat P V 2008 Quantum dot solar cells. Semiconductor
nanocrystals as light harvesters J. Phys. Chem. C112
18737–53
[10] Hakimi F, Bawendi M G, Tumminelli R and Haavisto J R 1993 Quantum Dot Laser United States Patents, 5 260 957 [11] Ustinov V M, Zhokov A E, Zhukov A E, Egorov A Y and
Maleev N A 2003 Quantum Dot Lasers(Oxford: Oxford University Press)
[12] Alivisatos P 2004 The use of nanocrystals in biological detection Nat. Biotechnol.22 47–52
[13] Kairdolf B A, Smith A M, Stokes T H, Wang M D, Young A N and Nie S 2013 Semiconductor quantum dots for bioimaging and biodiagnostic applications Annu. Rev. Anal. Chem.6 143–62
[14] Achermann M 2010 Exciton-plasmon interactions in metal-semiconductor nanostructures J. Phys. Chem. Lett.1
2837–43
[15] Törmö P and Barnes W L 2015 Strong coupling between surface plasmon polaritons and emitters: a review Rep. Prog. Phys.78 13901
[16] Fofang N T, Park T-H, Neumann O, Mirin N A and Peter Nordlander N J H 2008 Plexcitonic nanoparticles: plasmon-exciton coupling in nanoshell-j-aggregate complexes Nano Lett.8 3481–7
[17] Melnikau D, Esteban R, Savateeva D, Sánchez-Iglesias A, Grzelczak M, Schmidt M K, Liz-Marzán L M, Aizpurua J and Rakovich Y P 2016 Rabi splitting in photoluminescence spectra of hybrid systems of gold nanorods and J-aggregates J. Phys. Chem. Lett.7 354–62 [18] Cohen-Hoshen E, Bryant G W, Pinkas I, Sperling J and
Bar-Joseph I 2012 Exciton–plasmon interactions in quantum dot–gold nanoparticle structures Nano Lett.12 4260–4 [19] Santhosh K, Bitton O, Chuntonov L and Haran G 2016
Vacuum Rabi splitting in a plasmonic cavity at the single quantum emitter limit Nat. Commun.7 1–5
[20] Lieberman I, Shemer G, Fried T, Kosower E M and
Markovich G 2008 Plasmon-resonance-enhanced absorption and circular dichroism Angew. Chem.—Int. Ed.47 4855–7 [21] Ben-Moshe A, Maoz B M, Govorov A O and Markovich G
2013 Chirality and chiroptical effects in inorganic nanocrystal systems with plasmon and exciton resonances Chem. Soc. Rev.42 7028–41
[22] Fan Z and Govorov A O 2010 Plasmonic circular dichroism of chiral metal nanoparticle assemblies Nano Lett.10 2580–7 [23] Kneipp K, Wang Y, Kneipp H, Perelman L T, Itzkan I,
Dasari R R and Feld M S 1997 Single molecule detection using surface-enhanced raman scattering(SERS) Phys. Rev. Lett.78 1667–70
[24] Haynes C L, McFarland A D and Van Duyne R P 2005 Surface-enhanced raman spectroscopy Anal. Chem.77
338A–46A
[25] Lakowicz J R et al 2004 Advances in surface-enhanced fluorescence J. Fluoresc.14 425–41
[26] Willets K A and Van Duyne R P 2007 Localized surface plasmon resonance spectroscopy and sensing Annu. Rev. Phys. Chem.58 267–97
[27] Gaponenko S V 2010 Introduction to Nanophotonics (Cambridge: Cambridge University Press)
[28] Itoh T, Yamamoto Y S and Ozaki Y 2017 Plasmon-enhanced spectroscopy of absorption and spontaneous emissions explained using cavity quantum optics Chem. Soc. Rev.46
3904–21
[29] Li M, Cushing S K and Wu N 2015 Plasmon-enhanced optical sensors: a review Analyst140 386–406
[30] Vaschenko S, Ramanenka A, Kulakovich O, Muravitskaya A, Guzatov D, Lunevich A, Glukhov Y and Gaponenko S 2016 Enhancement of labeled alpha-fetoprotein antibodies and antigen-antibody complexesfluorescence with silver nanocolloids Proc. Eng.140 57–66
[31] Fothergill S M, Joyce C and Xie F 2018 Metal enhanced fluorescence biosensing: from ultra-violet towards second near-infrared window Nanoscale20914–29
[32] Lakowicz J R 2005 Radiative decay engineering 5: Metal-enhancedfluorescence and plasmon emission Anal. Biochem.337 171–94
[33] Darvill D, Centeno A and Xie F 2013 Plasmonic fluorescence enhancement by metal nanostructures: shaping the future of bionanotechnology Phys. Chem. Chem. Phys.15 15709–26 [34] Abadeer N S, Brennan M R, Wilson W L and Murphy C J
2014 Distance and plasmon wavelength dependent fluorescence of molecules bound to silica-coated gold nanorods: a study of plasmon-induced luminescence enhancement ACS Nano652–3
[35] Tam F, Goodrich G P, Johnson B R and Halas N J 2007 Plasmonic enhancement of molecularfluorescence Nano Lett.7 496–501
[36] Kulakovich O, Strekal N, Yaroshevich A, Maskevich S, Gaponenko S, Nabiev I, Woggon U and Artemyev M 2002 Enhanced luminescence of cdse quantum dots on gold colloids Nano Lett.2 1449–52
[37] Kulakovich O, Strekal N, Artemyev M, Stupak A,
Maskevich S and Gaponenko S 2006 Improved method for fluorophore deposition atop a polyelectrolyte spacer for quantitative study of distance-dependent plasmon-assisted luminescence Nanotechnology17 5201–6
[38] Guzatov D V, Vaschenko S V, Stankevich V V, Lunevich A Y, Glukhov Y F and Gaponenko S V 2012 Plasmonic enhancement of molecularfluorescence near silver nanoparticles: theory, modeling, and experiment J. Phys. Chem. C116 10723–33
[39] Orendorff C J and Murphy C J 2006 Quantitation of metal content in the silver-assisted growth of gold nanorods J. Phys. Chem. B110 3990–4
[40] Nik B and Sayed A E 2003 Preparation and growth mechanism of gold nanorods(NRs) using seed-mediated growth method Chem. Mater.15 1957–62
[41] Chen H, Shao L, Li Q and Wang J 2013 Gold nanorods and their plasmonic properties Chem. Soc. Rev.42 2679–724 [42] Peng B, Li Z, Mutlugun E, Hernández Martínez P L, Li D,
Zhang Q, Gao Y, Demir H V and Xiong Q 2014 Quantum dots on vertically aligned gold nanorod monolayer: plasmon enhancedfluorescence Nanoscale6 5592–8
[43] Fu Y, Zhang J and Lakowicz J R 2010 Plasmon-enhanced fluorescence from single fluorophores end-linked to gold nanorods J. Am. Chem. Soc.132 5540–1
[44] Fu B, Flynn J D, Isaacoff B P, Rowland D J and Biteen J S 2015 Super-resolving the distance-dependent plasmon-enhancedfluorescence of single dye and fluorescent protein molecules J. Phys. Chem. C119 19350–8
[45] Nepal D, Drummy L F, Biswas S, Park K and Vaia R A 2013 Large scale solution assembly of quantum dot-gold nanorod architectures with plasmon enhancedfluorescence ACS Nano7 9064–74
[46] Li X, Qian J, Jiang L and He S 2009 Fluorescence quenching of quantum dots by gold nanorods and its application to DNA detection Appl. Phys. Lett.94 6–8
[47] Wu Q, Chen L, Huang L, Wang J, Liu J, Hu C and Han H 2015 Quantum dots decorated gold nanorod as fluorescent-plasmonic dual-modal contrasts agent for cancer imaging Biosens. Bioelectron.74 16–23
[53] Caruso F, Lichtenfeld H, Donath E and Möhwald H 1999 Investigation of electrostatic interactions in polyelectrolyte multilayerfilms: binding of anionic fluorescent probes to layers assembled onto colloids Macromolecules32 2317–28 [54] Pérez-Juste J, Pastoriza-Santos I, Liz-Marzán L M and
Mulvaney P 2005 Gold nanorods: Synthesis,
characterization and applications Coord. Chem. Rev.249
1870–901
[55] Mulvaney P 1996 Surface plasmon spectroscopy of nanosized metal particles Langmuir12 788–800
[56] Guzatov D V, Gaponenko S V and Demir H V 2018 Colloidal photoluminescent refractive index nanosensor using plasmonic effects Z. Phys. Chem.232 1431–41 [57] Muravitskaya A O, Trotsiuk L L, Kulakovich O S,
Gurinovich L I, Gaponenko S V and Antanovich A V 2019 Refractive index influence on the quantum dots fluorescence near the gold nanorods Int. J. Nanosci.18 1940003 [58] Mertens H, Koenderink A F and Polman A 2007
Plasmon-enhanced luminescence near noble-metal nanospheres: comparison of exact theory and an improved gersten and nitzan model Phys. Rev. B76 1–12
[59] Shahbazyan T V 2013 Theory of plasmon-enhanced metal photoluminescence Nano Lett.13 194–8
[60] Ming T, Chen H, Jiang R, Li Q and Wang J 2012 Plasmon-controlledfluorescence: beyond the intensity enhancement J. Phys. Chem. Lett.3 191–202
Orrit M 2014 Resonant plasmonic enhancement of single-moleculefluorescence by individual gold nanorods ACS Nano8 4440–9
[66] Caswell K K, Wilson J N, Bunz U H F and Murphy C J 2003 Preferential end-to-end assembly of gold nanorods by biotin-streptavidin connectors J. Am. Chem. Soc.125 13914–5 [67] Paulo P M R, Zijlstra P, Orrit M, Garcia-Fernandez E,
Pace T C S, Viana A S and Costa S M B 2017 Tip-specific functionalization of gold nanorods for plasmonic biosensing: effect of linker chain length Langmuir33 6503–10 [68] Yu C and Irudayaraj J 2006 Multiplex biosensor using gold
nanorods Anal. Chem.79 572–9
[69] Hinman J G, Stork A J, Varnell J A, Gewirth A A and Murphy C J 2016 Seed mediated growth of gold nanorods: towards nanorod matryoshkas Faraday Discuss.191 9–33 [70] Conroy E M, Li J J, Kim H and Algar W R 2016
Self-quenching, dimerization, and homo-FRET in hetero-FRET assemblies with quantum dot donors and multiple dye acceptors J. Phys. Chem. C120 17817–28
[71] Guzatov D V, Gaponenko S V and Demir H V 2018 Plasmonic enhancement of electroluminescence AIP Adv.8 015324 [72] Viste P, Martin J, Jaffiol R, Vial A, Adam P-M and Royer P
2010 Enhancement and quenching regimes in metal-semiconductor hybrid optical nanosources ACS Nano4