NEW PRODUCT DEVELOPMENT IMPROVEMENT MOTIVES AND PRACTICES 85
The New Product Development
Improvement Motives and Practices
of Miles and Snow’s Prospectors,
Analysers and Defenders
Bjørge Timenes Laugen, Harry Boer and Nuran Acur
Marketing, strategic management and contingency theory suggest that different strategies require different practices. The new product development (NPD) literature, however, hardly addresses the product development practices needed to support different strategies. An anal-ysis of eight prospectors, twenty-seven analysers and seven defenders (Miles and Snow, 1978) suggests that the NPD improvement motives and practices of these three types of strategies are less different than we expected. Our explanation for this finding is that the three strategic types are growing towards each other, forced by changes in competition and enabled by new technologies and management concepts.Introduction
trategy implementation is the process by which (new) objectives and practices (i.e. processes, technologies, organisational arrangements and/or managerial systems and approaches) are put into action. One of the key principles associated with successful strategy implementation is that at any time, strategy and practices need to be consistent with, and supportive of, each other (Chandler, 1962; Owen, 1982). Many generic corporate (e.g. Miles and Snow, 1978; Porter, 1980; Kotler et al., 2001) and manufacturing (e.g. Hayes and Wheelwright, 1984; Sweeney, 1991, 1993; Richardson et al., 1985) strategies have been proposed. Indeed, most of these typologies suggest that different strategies require differ-ent organisational and managerial practices or, in other words, a structural consistency between strategy and organisational design parameters. Other authors (e.g. Hayes and Wheelwright, 1984) suggest that a consistency is required between corporate strategy and functional strategies such as new product development (NPD), manufacturing and mar-keting strategy or, in other words, a strategic
consistency.
While structural and strategic consistency are widely accepted as prerequisites for suc-cess, also in adjacent areas such as
organisa-S
tion design theory (e.g. Mintzberg, 1979), there have not been many attempts to examine new product development (NPD) strategies and practices from this perspective. For example, one well-known typology of market strategy
distinguishes between leaders, fast and late followers. However, the differences in NPD strategies and practices between the three cat-egories are not well described.
Another underexplored area concerns the link between corporate strategy and NPD strategy and practices. This article seeks to address this area, and examines the following question:
What are the relationships between corporate strategy and new product development strategy and practices?
The next section will provide the background we used to operationalise this question in the form of five hypotheses.
Background
Various studies have argued that strategies are best interpreted and dealt with in terms of
con-figurations of, for example, competitive
priori-ties and innovation characteristics, rather than by looking at single elements or constructs. We will follow this recommendation and discuss
86 CREATIVITY AND INNOVATION MANAGEMENT
how strategic configurations can be used to understand relationships between corporate strategy and NPD practices. In so doing we will take Miles and Snow’s (1978) typology as our point of departure.
The Miles & Snow Typology
Miles and Snow’s (1978) strategy typology distinguishes four types of companies – pros-pectors, defenders, analysers and reactors.
Prospectors are the most innovative type and
emphasise the development of new products and technologies and the exploration of new markets. They try to be first in the market with new products, and continuously experiment with responses to emerging trends and changes in the market place. They are characterised by a low degree of formalisation, decentralised decision making and high flexibility. Defenders
primarily stay in their existing domains and stable market niches. Product development for these companies is limited to the improvement of existing products. Efficiency and control are important factors for these companies, and they have a higher degree of formalisation and centralisation than prospectors. Analysers try to combine the exploration capability and inno-vativeness of the prospectors with the defend-ers’ ability to serve existing markets effectively. These companies pursue efficiency in the stable markets they serve, and try to be adaptive to and prepared for change in the turbulent mar-kets in which they are also active at the same time. However, analysers are not ‘first movers’. Rather their focus is on quick adoption of new concepts launched by successful prospector companies. Finally, reactors are companies without a consistent strategy-structure rela-tionship. These companies do perceive changes in the markets in which they operate, but are not able to respond to these changes effectively.
The two extremes (prospector and defender) are consistent with findings put for-ward by the other authors, e.g. Burns and Stalker (1961) and Porter (1980). Burns and Stalker (1961) found two ‘management systems . . . which represent the . . . polar extremities of the forms which such systems can take when they are adapted to a specific rate of technical and
commer-cial change’ (ibid., p. 119). They labelled these
extremes the mechanistic and organic man-agement system, respectively. Mechanistic sys-tems are appropriate in stable conditions and have a functional organisation structure, a high degree of formalisation, and many rules and procedures. Organic systems are most appropriate in changing conditions and are characterised by loose structures and few rules.
Porter’s (1980) cost leaders try to win market share by offering products with a lower price than their competitors. They pursue their strategy by focussing on efficiency and cost reduction, and, consequently, tight cost-con-trol. Companies that adopt a differentiation
strategy compete by distinguishing their prod-ucts from their competitors’ prodprod-ucts. This requires a strong focus on innovation, creativ-ity and marketing.
Miles and Snow’s (1978) prospector corre-sponds with Burns and Stalker’s organic sys-tem and Porter’s differentiation strategy, while
the defender strategy corresponds with Burns
and Stalker’s mechanistic system and Porter’s
cost leadership strategy. Analysers combine
cost-leadership and a mechanistic system orthogonally with differentiation and an organic system. That is, they either spatially or
temporally separate innovation and operation,
but do not do both in the same part of the com-pany or at the same time (Volberda, 1998, pp. 270–274).
Hypotheses
Miles and Snow examined relationships between various organisational and contex-tual factors, including the rate of change in the organisation’s products and markets and the organisation’s technology, structure, manage-rial processes and power distribution within each strategy type. Our interest is in the rela-tionships between corporate strategy and NPD strategy and practices. We will focus on the relationships between strategy and NPD
improvement motives (strategy) and action
pro-grammes (new practices), rather than current
practices. This is an appropriate approach because company improvement motives indi-cate future strengths pursued while action programmes indicate how companies intend to achieve these strengths. Our hypotheses do not include reactors; we are only interested in motives and programmes of the three strategic types – that is, prospectors, defenders and analysers, which Miles and Snow (1978) describe as sustainable strategies. This is in line with many previous studies that used Miles and Snow’s classification (e.g. Slater and Narver, 1993; Shoham et al., 2001).
Market and NPD Practices
Many authors on strategic management (e.g. Andrews, 1971; Porter, 1980) suggest that strategy should be about aligning the business with its environment. This means that strategy is an adaptive mechanism. Miles and Snow (1978) see strategy as a constraint for the
NEW PRODUCT DEVELOPMENT IMPROVEMENT MOTIVES AND PRACTICES 87
organisation to respond to its environment. Consequently, they do not try to answer the question ‘which strategy is best for this envi-ronment?’, but rather focus on ‘how do we implement the chosen strategy?’.
Prospectors systematically add new prod-ucts and new markets to their portfolio and put a lot of effort into monitoring ‘a wide range of environmental conditions, trends and events’ (Miles and Snow, 1978, p. 56). Defend-ers tend to ‘ignore developments outside of [their] domain’ (ibid., p. 37). Analysers imitate ‘the best of the products and market devel-oped by Prospectors’ (ibid., p. 72) and accom-plish this ‘through extensive marketing surveillance mechanisms’ (ibid., p. 72). We hypothesise:
H1a: For analysers, market motives are more important drivers of NPD performance im-provement than for prospectors and defenders. H1b: Analysers make more use of mechanisms to ensure customer intimacy than prospectors and defenders.
However, prospectors aim to locate and exploit new product and market opportuni-ties, and do that by monitoring a wide range of environmental conditions and events. Hence, we hypothesise:
H1c: Prospectors make more use of mechanisms to scan their environment for general informa-tion than analysers and defenders.
Time and Cost Motives and NPD Practices
As prospectors focus on innovation, analysers on quick imitation, and defenders on their existing products, we argue that the motives they have for improving the NPD function will be different for the three types as well. Defenders search profitability by maintaining existing products in established markets through ‘technological efficiency’ (Miles and Snow, 1978, p. 48). Analysers combine effi-ciency in their operations with effectiveness pursued by adding new products and markets
(ibid., p. 77). Prospectors are continuously
developing new products and markets and, consequently, tend to have difficulties achiev-ing operational efficiency (ibid., p. 66). In order to achieve their efficiency objectives, the defenders and analysers have well-developed control systems.
It makes logical sense to expect the follow-ing implications. As the defenders compete on cost, their NPD activities should be aimed at low cost and cost reduction as well. Analysers try to combine low cost and fast imitation (of the prospectors’ products) and should there-fore be expected to put considerable effort into
achieving ever-lower cost and higher speed in their NPD activities. Finally, prospectors will tend to focus on design, rather than cost and speed. We hypothesise:
H2a: For defenders, cost and price motives are more important drivers of NPD performance im-provement than for prospectors and analysers. H2b: Defenders make more use of mechanisms to control and improve cost than prospectors and analysers.
H3a: For analysers, time motives are more important drivers of NPD performance improve-ment than for prospectors and defenders. H3b: Analysers overlap phases in the develop-ment process to a higher extent than prospectors and defenders to control and improve time-related performance.
H3c: Analysers make more use of formal mech-anisms to control and improve time-related per-formance than prospectors and defenders.
Technology Motives and NPD Practices
While defenders tend to ‘establish only a single
core technology’ (Miles and Snow, 1978, p. 40),
‘[t]he Prospector develops multiple
technolo-gies’ (ibid., p. 58). If it comes to new product
development, the analyser ‘. . . resembles the Prospector’s technological orientation’ (ibid., p. 73). We hypothesise:
H4a: For prospectors, technology motives are more important drivers of NPD performance improvement than for analysers and defenders.
As prospectors develop multiple technologies they need mechanisms to integrate and coor-dinate these in the various functions involved when developing new products (Miles and Snow 2003, p. 66). We hypothesise:
H4b: Prospectors make more use of integrating design tools in order to improve their NPD function, than defenders. The use of the analy-sers’ NPD tools is comparable to that of the prospectors.
NPD Organisation
Prospectors, innovative companies, have to be flexible and prepared for quick adaptation to changes and movements in the market place. Many studies have indicated that such compa-nies are best managed with a low level of formalisation, i.e. not based on rules and pro-cedures (Burns and Stalker, 1961, Hage and Aiken, 1970, Miles and Snow, 1978). Defend-ers, in contrast, have to be managed more for-mally in order to achieve efficiency, while analysers are likely to sit in between.
88 CREATIVITY AND INNOVATION MANAGEMENT
Although we are aware that there are other important organisational contingencies, notably centralisation and professionalism, we focus on formalisation. Burns and Stalker (1961) explicitly mention that mechanistic firms have a functional organisation structure with precisely defined rights and obligations – i.e. they are highly formalised. In organic firms, on the other hand, tasks are continu-ously redefined – i.e. they are much less form-alised. Considering centralisation, Burns and Stalker (1961) write that mechanistic firms have ‘a hierarchical structure’ (ibid. p. 120), and ‘a tendency for the interaction between [its] members . . . to be vertical, that is, between superior and subordinate’ (ibid. p. 120). However, hierarchical structure and vertical communication lines are not necessarily an indication of a high degree of centralisation. Regarding professionalism, the differences between mechanistic and organic firms are not clear.
Hage and Aiken (1970) argue that centrali-sation might have a negative influence on innovation, while professionalism is con-sidered as being positive. However, research by Huber et al. (1993) indicates that centra-lisation and speciacentra-lisation (an element of pro-fessionalism (Hage and Aiken, 1970) have no significant relation to innovation, while formalisation is considered to be significant negatively related.
So, although centralisation and profession-alism might have influence on innovation and, hence, the different strategic positions that
Miles and Snow (1978) suggest, interpreting the authors above, formalisation seems to be most salient of the dimensions to investigate. We hypothesise:
H5a: Relative to analysers, defenders have a higher and prospectors a lower degree of formal-isation in their NPD function.
It makes logical sense to assume that the same pattern also holds for the formalisation of NPD projects. Hence, we hypothesise that:
H5b: Relative to analysers, defenders have a higher and prospectors a lower degree of formal-isation of their NPD projects.
Methodology
Data
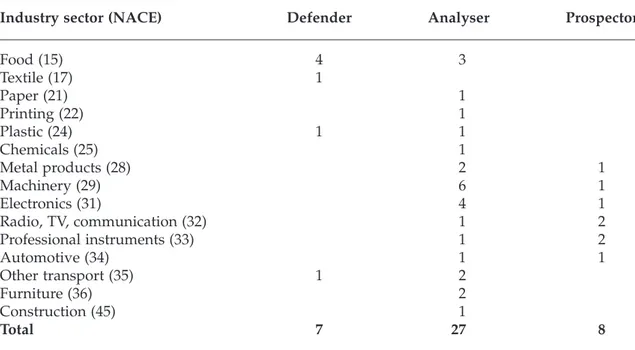
To test the hypotheses, data from a quantita-tive benchmarking survey are used. The data-base comprises 55 manufacturing companies from Australia, Denmark and Norway. Most respondents are medium sized and large companies representing a wide range of industrial sectors (see Table 1). The survey was developed by an international consor-tium, and carried out late 2002/early 2003. Most companies were sampled randomly; some companies that had collaborated with consortium partners in previous projects were handpicked. The questionnaires were filled in by NPD managers of independent firms, and
Table 1. Number of companies representing industry sectors (numbers in brackets represent the NACE code for each industry)
Industry sector (NACE) Defender Analyser Prospector
Food (15) 4 3 Textile (17) 1 Paper (21) 1 Printing (22) 1 Plastic (24) 1 1 Chemicals (25) 1 Metal products (28) 2 1 Machinery (29) 6 1 Electronics (31) 4 1 Radio, TV, communication (32) 1 2 Professional instruments (33) 1 2 Automotive (34) 1 1 Other transport (35) 1 2 Furniture (36) 2 Construction (45) 1 Total 7 27 8
NEW PRODUCT DEVELOPMENT IMPROVEMENT MOTIVES AND PRACTICES 89
by managers responsible for the development of new products in business units of larger concerns.
Operationalisation
We classified the respondents as prospector, analyser or defender, using two criteria: • The newness of the company’s product
portfolio; see Appendix for the definition of newness.
• The respondents’ assessment of whether they regarded themselves as primarily product innovative, primarily production innovative, or both product and production innovative.
We defined prospectors (N = 8) as respondents whose sales portfolio consists for more than 60% of true innovations (products new to the world) and new product lines, and who assessed themselves as primarily product innovative. We labelled companies with more than 60% of sales coming from improved or existing products and who assessed them-selves as primarily production innovative
defenders (N = 7). Finally, with more than 25%
of sales coming from existing products, prod-uct improvement/line extensions and new lines/true innovations, analysers (N = 27) have struck a balance between innovating, improv-ing and maintainimprov-ing their product portfolio, and focus on both product and production innovation.
If inconsistency between the two classifica-tion criteria occurred, we used the develop-ment in NPD and manufacturing performance within the last three years as an additional criterion, labelling companies with high improvement in NPD performance prospec-tors, companies with high improvement in manufacturing performance defenders, and finally companies with performance impro-vement in both NPD and manufacturing analysers. As a final step, we checked the clas-sification of each respondent manually, based on our knowledge of the companies.
We could not classify one of the respondents in any of these categories, and another 12 com-panies due to missing data. Consequently, the analysis presented in the next section is based on a sample of 42 companies.
Data Analysis
Using SPSS 11.5 for all analyses, we estimated the differences in motives and action pro-grammes between the three types of strategies by calculating mean values for the three stra-tegic types. We controlled the level of signifi-cant variation between the groups using
ANOVA. See Appendix for the definition of the variables we used to test the hypotheses.
Results and Discussion
The results from the analyses are shown in Table 2, and explained and discussed next.
Hypothesis H1: Market as a Driver of NPD Improvement
Analysers are more driven by market motives than prospectors, but significantly less so than defenders. H1a is therefore rejected.
Discussion: A possible explanation for this
finding is that the defenders know (and listen to) their (existing) markets much better than the prospectors (can) know the new markets they are developing all the time. Our data do not allow us to check this explanation.
Although, as expected, analysers make the highest use of customer relation management (CRM), the differences with prospectors and defenders are not significant. We cannot there-fore confirm H1b. An interesting observation concerns the relatively high use of CRM among the prospectors, which is close to that of the analysers.
Discussion: A possible explanation of this
finding is that different types of company actually use CRM, but in different ways – as an operational tool by defenders, to maintain their relationship with existing customers, as a more tactical tool by analysers, and as a stra-tegic tool by prospectors who, aware of their lack of market knowledge, are seeking ways to improve their market intelligence function.
H1c is rejected: the differences between the three types are small and insignificant and, against our expectation, defenders make more use of benchmarking than the other two types of organisation.
Discussion: All three types of company seem
to put more or less the same focus on monitor-ing the market for general information. This could indicate that defenders are moving away from doing ‘. . . little or no scanning of the
environment for new areas of opportunity’ (Miles
& Snow, 1978, p. 551) to actively seeking mar-ket information as an important input to NPD improvement efforts.
Hypothesis H2: Cost/Price as Drivers of NPD Improvement
We find that prospectors are least driven by cost/price motives, which supports our expec-tations. Contrary to hypothesis H2a, however, we find that cost/price motives are more important improvement drivers for analysers
90 CREATIVITY AND INNOVATION MANAGEMENT
Table
2.
Differ
ences in mean values and standard deviation (SD) between the thr
ee gr oups (ANOV A) Hypotheses Prospectors Analysers Defenders Significantly dif ferent pairs Mean SD Mean SD Mean SD
H1: Market as a driver of NPD impr
ovement
H1a: Market motives to impr
ove NPD 3,14 0,69 3,16 0,75 3,80 0,45 PD*, DA* H1b: Use of customer r elation management 2,50 1,23 2,84 1,14 2,29 1,25 NS H1c: Benchmarking 1,67 1,03 2,22 1,13 2,20 1,30 NS
H2: Cost/price as drivers of NPD impr
ovement
H2a: Cost and price motives to impr
ove NPD 2,43 0,54 3,35 0,75 3,25 0,96 PD*, P A ***
H2b: Use of activity based costing
2,33 1,21 2,67 1,40 1,83 1,33 NS H3: T
ime as a driver of NPD impr
ovement
H3a: T
ime motives to impr
ove NPD 3,00 0,82 2,96 0,66 2,60 1,14 NS H3b: Use of concurr ent engineering 2,57 0,98 2,35 1,27 3,00 1,73 NS
H3c: Use of stage-gate management
3,14 1,07 3,56 1,50 5,00 0.00 PD**, DA* H4: T
echnology as a driver of NPD impr
ovement
H4a: T
echnology motives to impr
ove NPD 2,57 0,54 2,65 0,94 2,50 0,58 NS H4b: Use of CAD/CAM in NPD 3,57 0,79 3,54 1,24 2,33 2,31 DA* H5: Or ganisation H5a: NPD or ganisation str uctur e 2,43 0,79 2,37 0,84 2,43 0,79 NS H5b: NPD pr oject formalisation 3,14 0,69 2,74 1,06 2,67 0,42 P A * *** < 0,01, ** p < 0,05, * p < 0,15 PA Pr
ospectors and analysers ar
e significantly dif fer ent fr om each other . PD Pr
ospectors and defenders ar
e significantly dif fer ent fr om each other . DA
Defenders and analysers ar
e significantly dif fer ent fr om each other . NS No significant dif fer
ences between any of the strategies
NEW PRODUCT DEVELOPMENT IMPROVEMENT MOTIVES AND PRACTICES 91
than they are for defenders. Therefore, we reject H2a for the difference between analysers and defenders, but accept the hypothesised role of cost/price as drivers for NPD improve-ment by prospectors and defenders.
Discussion: Even if the difference between
analysers and defenders is not significant, the findings indicate that analysers are even more concerned about cost/price than defenders. Could it be that defenders have their cost under control, while analysers find it difficult to combine operational effectiveness and inno-vativeness in an efficient way, and therefore put relatively more effort into improving their performance in this area?
This would be in line with our findings with regard to H2b, namely that analysers make more use of activity based costing (ABC) than prospectors and defenders, with the latter actually scoring lowest, rather than highest, as we had expected.
Discussion: One explanation for this finding
may be that defenders already have tools and procedures for cost control and improvement in place, and do not therefore put much effort into further improving this aspect. Analysers, in contrast, might have become aware of the difficulties to combine cost-effective opera-tions with innovation, and are using ABC as a tool to confine this problem. Another explana-tion could be that analysers are more aware of financial risks than defenders, and therefore experience a higher need for tools like ABC.
Hypothesis H3: Time as a Driver of NPD Improvement
As to the role of time as a driver for improving their NPD function (H3a), the analysers score higher than the prospectors and the defenders. However, the differences are not significant. We cannot therefore confirm the hypothesis.
Discussion: Miles & Snow published their
work in 1978. Time has become a much more important competitive factor since, perhaps also for defenders, in addition to cost/price.
Our analysis of the use of concurrent engi-neering (CE) and stage-gate management as mechanisms to control and improve time (H3b and H3c) produces an unexpected picture. Defenders make most use of CE, analysers less, and prospectors least. As to the use of stage-gate management, the same picture emerges. We therefore reject H3b, and H3c for the difference between analysers and defend-ers, and cannot confirm the hypothesised dif-ference between prospectors and analysers.
Discussion: The relatively low use of CE by
prospectors is not surprising, nor is the high use of CE among the defenders, if this concept is implemented to improve design for
manu-facturing instead of NPD project lead-time. In addition, could the unexpectedly high use the defenders make of stage-gate management indicate, as suggested above, that time has become a key factor, also for defenders? Alter-natively, would the fact that time has always been a key factor for analysers (quick imitation of the prospectors’ products) mean that they already use stage-gate management? Further research is needed to unravel this finding.
Hypothesis H4: Technology as a Driver of NPD Improvement
Hypothesis H4a is rejected for the difference between prospectors and analysers, and not confirmed for the difference between prospec-tors and defenders. Contrary to the hypothe-sis, the analysers, not the prospectors, score highest. The difference between prospectors and defenders is in the hypothesised direction, but small and not significant.
Discussion: The role of technology motives
produces a surprising picture. Technology seems to be a more important driver of the improvement activities among the analysers than among the prospectors. This could indi-cate that analysers have become aware of the high margins from products launched first to the market, and are now aiming at being first-movers with new products, and not fast followers, as Miles and Snow (1978) suggest. However, as the differences between the three groups are currently small and insignificant, future research is needed to find out whether this explanation is going to hold.
Analysers make significantly more use of advanced tools in NPD than defenders. Pros-pectors, too, make considerably more use of advanced integrating tools than defenders, but the difference is not significant. Thus, H4b is only partly confirmed.
Discussion: The analysers’ use of advanced
tools in NPD is consistent with their ‘second and better’-strategy, which implies that they need to be able quickly to adopt and further develop promising products launched by prospectors (Miles et al., 1978). The use of advanced NPD tools among the analysers does not differ significantly from that of the prospectors, which confirms Miles and Snow (1978). The difference between prospectors and defenders is large, as expected, but not significant. Other than sample size effects, we have no adequate explanation for this finding.
Hypothesis H5: Organisation
H5a is rejected: the differences in formalisa-tion degree of the three types of company are small and insignificant.
92 CREATIVITY AND INNOVATION MANAGEMENT
Discussion: The scale we used ranged from
functional, via matrix/hybrid, to project-based. It could well be that the difference between prospectors and analysers is small and insignificant as, today, most new pro-duct development processes are organised as projects. Therefore, it is reasonable to expect that prospectors, for whom new product development is core business, and analysers, with their binary organisation (Sutcliffe et al., 2000) of exploration and exploitation (March, 1991) tend to organise their NPD activities in similar ways. It is interesting, however, that defenders have the same low level of formali-sation as the two other types. Could this indicate that the defenders try to be more innovative, adaptive to change and facilitate generating new ideas through loose structures and a project-based organisation? More in-depth research is needed to answer this question.
H5b is rejected for the relationship between prospectors and analysers. We find that pros-pector have a significantly higher degree of formalisation of their NPD projects than anal-ysers. The difference between defenders and analysers is small and insignificant.
Discussion: This finding creates a surprising
pattern. The high level of formalisation goes against Miles and Snow’s (1978) suggestion, and is also inconsistent with the seminal the-ory on the relationship between formalisation and innovation (Burns and Stalker, 1960; Hage and Aiken, 1970). The only explanation we have for this finding is that prospectors have a
high volume of development activities. Hence, they need to have a separate function for development activities, and they need to, and can (due to scale effects), organise this func-tion relatively formally. Defenders, in contrast, might, due to the low volume of development projects, not have a standing, but an ad-hoc organisation for such activities and, conse-quently, a relatively low level of formalisation.
Conclusion
We took our point of departure in Miles and Snow’s (1978) strategic types – prospectors, defenders and analysers, and studied new product development related differences between the three types through statistical analyses of data from 42 manufacturing com-panies in Australia, Denmark and Norway.
Perhaps the most interesting feature of the study is not in the hypotheses accepted, but in the hypotheses rejected, not confirmed, or only partially accepted – see Table 3. We see two essentially different explanations.
Operationalisation – The four strategies
(prospectors, analysers, defenders and reac-tors) are ideal types. We classified the
compa-nies in our sample according to the newness of their product portfolio and their assessment of their innovation orientation. This resulted in eight prospectors, twenty-seven analysers, and seven defenders. We think this is an appropriate operationalisation, but may actu-ally have included some firms in the wrong
Table 3. Summary of the results
Hypotheses Result
H1: Market as a driver of NPD improvement
H1a: Market motives to improve NPD Rejected H1b: Use of customer relation management Not confirmed H1c: Benchmarking Rejected
H2: Cost/price as drivers of NPD improvement
H2a: Cost and price motives to improve NPD Accepted for PD, rejected for DA H2b: Use of activity based costing Rejected
H3: Time as a driver of NPD improvement
H3a: Time motives to improve NPD Not confirmed H3b: Use of concurrent engineering Rejected
H3c: Use of stage-gate management Rejected AD, not confirmed PA
H4: Design/ technology as drivers of NPD improvement
H4a: Technology motives to improve NPD Rejected PA, not confirmed PD
H4b: Use of CAD/CAM in NPD Not confirmed for PD, accepted for AD
H5: Organisation
H5a: NPD organisation structure Rejected PA, not confirmed DA H5b: NPD project formalisation Rejected PA, not confirmed DA
NEW PRODUCT DEVELOPMENT IMPROVEMENT MOTIVES AND PRACTICES 93
category and, for example categorised analy-sers with an excellent NPD function as pros-pectors, or included some ‘defenders’ that are perhaps better regarded as reactors. Our data do not provide any way to check this. Further-more, we strictly linked our operationalisation of improvement programmes to single perfor-mance improvement motives (e.g. ABC – cost/ price, CRM – market intelligence, CE and stage-gate management – time). However, the (intended) impact of most if not all of these concepts goes beyond one single indicator; CE, for example, may be used to achieve cost/ price reductions, in addition to time benefits.
Developments since 1978 – Miles and Snow
published their work in 1978. According to March (1991), ‘[e]xploration and exploitation are
linked in an enduring symbiosis . . . Each inter-feres with the other . . . [and] organizations per-sistently fail to maintain an effective balance between the two’. Indeed, Burns and Stalker
(1961) and Porter (1980) proposed two either/or categories, not three (like Miles and Snow, 1978). However, there is ample evidence that companies are continuously looking for possibilities to combine the two capabilities, i.e. to excel in production opera-tions and innovation. Examples include matrix and hybrid structures, flexible produc-tion systems, concurrent engineering, contin-uous improvement and, the latest ‘fashion’, the learning organisation. Furthermore, until the mid-1970s, competition was mostly price based. Companies today are increasingly required to combine operational excellence in terms of price, quality, variety and speed with innovation excellence (Boer and Gertsen, 2003). In effect, differences between compa-nies, in terms of their competitive priorities and the systems they use to support their functioning, may be disappearing. If that is the case indeed, many of our findings are self-explanatory.
The findings in this article suggest a couple of areas for further research. One is to investi-gate whether the role of the prospectors and defenders has developed or changed over the years. Our findings suggest that market and design have become important improvement drivers for defenders, and that prospectors are implementing programmes to improve the efficiency of their activities. We see two differ-ent explanations for this. Formulated as two hypotheses for further research:
• In order to cope with the necessity to com-bine operational and innovation excellence, prospectors today are concerned about efficiency in addition to innovation, while defenders are putting more effort into inno-vation, in addition to efficiency.
• The prospectors and defenders do not change strategy; they adopt the same prac-tices but use them differently.
Finally, whatever the case, we need to increase the sample size in order to improve the valid-ity of the findings and control for contextual factors (i.e. industry type, company size).
Acknowledgement
The authors thank the two anonymous reviewers for their valuable comments and recommendations.
References
Andrews, D.R. (1971) The concept of corporate strat-egy, Dow Jones Irwin, Homewood.
Boer, H. and Gertsen, F. (2003) From continuous improvement to continuous innovation: a (retro)(per)spective, International Journal of Tech-nology Management, Vol. 26, No. 8, pp. 805–827. Burns, T. and Stalker, G.M. (1961) The management
of innovation, Tavistock, London.
Chandler, A.D. (1962) Strategy and structure, MIT Press, Boston.
Hage, J. and Aiken, M. (1970) Social change in com-plex organizations, Random House, New York. Hayes, R.H. and Wheelwright, S.C. (1984) Restoring
our competitive edge: competing through manufactur-ing, John Wiley & Sons, New York.
Huber, G.P., Sutcliffe, K.M., Miller, C.C. and Glick, W.H. (1993) Understanding and predicting organizational change, in Huber, G.P. and Glick, W.H., Organizational change and redesign, Oxford University Press, New York.
Kotler, P., Armstrong, G., Saunders, J. and Wong, V. (2001) Principles of marketing, Prentice Hall, London.
March, J.G. (1991) Exploration and exploitation in organizational learning. Organization Science, Vol. 2, No. 1, pp. 71–87.
Miles, R.E. and Snow, C.C. (1978) Organizational strategy, structure, and process, McGraw Hill, New York.
Miles, R.E., Snow, C.C., Meyer, A.D. and Coleman, H.J. (1978) Organizational strategy, structure, and process, Academy of Management Review July, pp. 546–562.
Miles, R.E. and Snow, C.C. (2003) Organizational strategy, structure, and process, Stanford University Press, Stanford, California.
Mintzberg, H. (1979) The structuring of organizations, Prentice-Hall, Englewood Cliffs.
Owen, A.A. (1982) How to implement strategy, Management Today, pp. 50–53.
Porter, M.E. (1980) Competitive strategy. Techniques for analyzing industries and competitors, The Free Press, New York.
Richardson, P.R., Taylor, A.J. and Gordon, J.R. (1985) A strategic approach to evaluating manu-facturing performance, Interfaces, Vol. 15, No. 6, pp. 15–27.
94 CREATIVITY AND INNOVATION MANAGEMENT
Shoham, A., Evangelista, F. and Albaum, G. (2001) Strategic firm type and export performance, Inter-national Marketing Review, Vol. 19, No. 3, pp. 236– 258.
Slater, S.F. and Narver, J.C. (1993) Product-market strategy and performance: an analysis of the Miles and Snow types, European Journal of Market-ing, Vol. 27, No. 10, pp. 33–51.
Sutcliffe, K.M., Sitkin, S.B. and Browning, L.D. (2000) Tailoring process management to situa-tional requirements, in: Cole, R.E. and Scott, W.R. (eds.), The quality movement & organization theory, Sage Publications, Thousand Oaks.
Sweeney, M.T. (1991) Towards a unified theory of strategic manufacturing management, Interna-tional Journal of Operations & Production Manage-ment, Vol. 11, No. 8, pp. 6–22.
Sweeney, M.T. (1993) Strategic management: re-structuring wasteful production to world-class, Journal of General Management, Vol. 18, No. 5, pp. 57–76.
Volberda, H.W. (1998) Building the flexible firm. How to remain competitive, Oxford University Press, Oxford.
Appendix – Definition of Variables
– Newness of the product portfolio:
True innovations – Products, launched within the last three years that are new to your business unit and the world.
New product lines – Products, launched within the last three years that are new to your business unit and allow you to main-tain or improve your position in existing markets, or to access new markets.
Product line extensions – Products, launched within the 2ast three years that are new to your business unit but added to an existing family.
Improved products – Existing products modified within the last three years to offer improved performance to customers.
Existing products – Products last launched, improved or modified three or more years ago.
H1: Market as a driver of improvement – Market motives to improve NPD: ‘What are
the main motives for the action pro-grammes aimed at improving your busi-ness unit’s NPD performance for the next three years?’ 1 = Not important, 4 = Of critical importance.
– Use of customer relationship management (CRM): ‘Business unit action programmes: Indicate the extent to which the programme (CRM) has been undertaken the last three years.’ 1 = None, 5 = High.
– Use of benchmarking: ‘Business unit action programmes: Indicate the extent to which
the programme (benchmarking other companies’ practices and performance) has been undertaken the last three years.’ 1 = None, 5 = High.
H2: Cost/price as drivers of improvement – Cost motives to improve production: ‘What
are the main motives for the action pro-grammes aimed at improving your busi-ness unit’s operations performance for the next three years?’ 1 = Not important, 4 = Of critical importance.
– Use of activity based costing (ABC): ‘Busi-ness unit action programmes: Indicate the extent to which the programme (ABC) has been undertaken the last three years.’ 1 = None, 5 = High.
H3: Time as a driver of improvement
– Time motives to improve NPD: ‘What are the main motives for the action pro-grammes aimed at improving your busi-ness unit’s NPD performance for the next three years?’ 1 = Not important, 4 = Of critical importance.
– Use of concurrent engineering (CE): ‘NPD function action programmes: Indicate the extent to which the programme (stage-gate management) has been undertaken the last three years.’ 1 = None, 5 = High.
– Use of stage-gate management: ‘NPD func-tion acfunc-tion programmes: Indicate the extent to which the programme (stage-gate management) has been undertaken the last three years.’ 1 = None, 5 = High.
H4: Technology as a driver of improvement – Technology motives to improve NPD:
‘What are the main motives for the action programmes aimed at improving your business unit’s NPD performance for the next three years?’ 1 = Not important, 4 = Of critical importance.
– Use of CAD/CAM to improve NPD: ‘NPD action programmes: Indicate the extent to which the programme (CAD/CAM) has been undertaken the last three years.’ 1 = None, 5 = High.
H5: Organisation
– NPD organisation structure: ‘Which of the following best describes your business unit’s product development organisation?’ 1 = Functional, 2 = Hybrid/matrix, 3 = Project.
– NPD project formalisation: ‘How would you describe the way NPD projects are managed in your business unit?’ 1 = No formal procedures None, 5 = Systematically and planned.
NEW PRODUCT DEVELOPMENT IMPROVEMENT MOTIVES AND PRACTICES 95
Bjørge Timenes Laugen is Assistant Professor at the Department of Busi-ness Administration at University of Stavanger, Norway. He received his MSc in engineering from Aalborg University in 2000. His main research interest is the link between new pro-duct development, propro-duction, organi-sational development and continuous innovation.
Harry Boer is Professor of Organisa-tional Design and Change at the Center for Industrial Production, Aalborg Uni-versity, Denmark. He holds a BSc in Applied Mathematics and an MSc and PhD both in Management Engineering. He has (co-)authored numerous articles and several books on subjects such as Organisation Theory, Flexible Auto-mation, Manufacturing Strategy, and Continuous Improvement. His current research interest is continuous innova-tion, that is, the integration of day-to-day operations, incremental change and radical innovation.
Nuran Acur is an Assistant Professor at the faculty of Business Administra-tion, Bilkent University, Turkey. Nuran holds a BSc and an MSc degree in Statistics. In 1997, she came to the University of Strathclyde (UK), where she gained a PhD in Strategic Manage-ment. She was also actively involved in a number of project management and consultancy assignments, directly related to facilitating strategy develop-ment with a number of companies. After graduation, she joined World-mark as an Engineering Consultant. In 2002, she joined Aalborg Univer-sity. In 2005 she returned to Turkey to join Bilkent University. Her current research focuses on operations man-agement, benchmarking and opera-tions strategy.