i
ÇANKAYA UNIVERSITY
GRADUATE SCHOOL OF SOCIAL SCIENCES DEPARTMENT OF ECONOMICS
MASTER’S THESIS
TRADE OPENNESS AND INDUSTRIAL PERFORMANCE IN NIGERIA:
EVIDENCE FROM AUTOREGRESSIVE DISTRIBUTED LAG (ARDL) MODELS
FAHAD MUHAMMAD ADAMU
iii ABSTRACT
TRADE OPENNESS AND INDUSTRIAL PERFORMANCE IN NIGERIA: EVIDENCE FROM AUTOREGRESSIVE DISTRIBUTED LAG (ARDL)
MODELS Fahad Muhammad Adamu M.Sc. Financial Economics Supervisor: Prof. Dr. Ergun DOĞAN
May 2014, 64 pages
This study seeks to examine the long-run and short-run relationship between industrial production, trade openness, nominal effective exchange rate and inflation gin Nigeria from 1986 to 2008. To accomplish this, the study employed the ARDL bounds test to co-integration proposed by (Pesaran, et-al 2001). In order to determine the time series characteristics of variables used in the regression, the study adopted the approach of Augmented Dickey-Fuller (ADF) and Philips Perron (PP) unit root tests. The results of the both long-run analysis and short-run of error correction model (ECM) indicated that trade openness and inflation rate have a significant positive and negative impact respectively on industrial production. Nominal effective exchange rate has no effect on industrial production. Stability tests were also conducted using CUSUM and CUSUMQ, the parameters of the model lied within its critical bounds of 5 percent significance levels, therefore the results strongly suggested that the residuals are within the boundaries. The study concludes that for Nigeria to achieve persistence industrial performance the country should stabilize the monetary policies relative to inflation and exchange rate.
Key words: Trade openness, Nigeria, ARDL
iv ÖZET
DIŞA AÇIKLIK VE NİJERYA SANAYİSİNİN PERFORMANSI: AUTOREGRESSIVE DISTRIBUTED LAG (ARDL) MODELLERİNDEN
KANITLAR Fahad Muhammad Adamu
Finansal Ekonomi Yüksek Lisans Programı Danışman: Prof. Dr. Ergun DOĞAN
Mayıs 2014, 64 sayfa
Bu çalışmada 1986- 2008 döneminde Nijerya sanayi üretimi, dışa açıklık, nominal efektif döviz kuru, ve enflasyon oranı arasındaki uzun dönem ve kısa dönem ilişkileri incelenmiştir. Çalışmada Pesaran, et-al (2001) tarfından geliştirilen ARDL bounds testi ve co-integration yöntemi kullanılmıştır. Zaman serilerinin durağanlığını kontrol etmek için de Augmented Dickey-Fuller (ADF) ve Philips Perron (PP) birim kök testleri kullanılmıştır. Hem uzun dönem analiz hem de kısa dönem hata düzeltme model (ECM) sonuçları dışa açıklığın sanayi üretimi üzerinde pozitif ve anlamlı; enflasyon oranının ise negatif ve anlamlı bir etkiye sahip olduğunu göstermektedir. Nominal efektif döviz kuru sanayi üretimini etkilememektedir. CUSUM ve CUSUMQ testleri, model parametrelerinin yüzde 5’lik bant içinde yer aldğını göstermiştir. Sonuçlar Nijerya’nın sanayide kalıcı bir başarı trendini yakalayabilmesi için istikrarlı para ve döviz kuru politikaları izlemesi gerektiğini işaret etmektedir.
v
ACKNOWLEGEMENT
My special thanks to Kano State Government under the outstanding leadership of Eng. Dr. Rabiu Musa Kwankwaso for giving me unprecedented scholarship to study abroad.
I wish to express my extraordinary enormous gratitude and appreciation to my Supervisor Prof. Dr. Ergun DOĞAN who uses their precious time for excellent supervision and provision of spectaculars atmosphere throughout completion of my academic thesis. My special gratitude also goes to the members of thesis committee Prof. Dr. Mehmet YAZICI and Assist. Prof. Dr. Aytaç GÖKMEN, toward their astonishingly insightful contributions.
I would like to express my sincere gratitude to my parents, Muhammad Adamu and Late Ummukhulsum Muhammad for their prayers and sacrifice to me.
Finally, my appreciation goes to my Turkish friends and my entire friends of Kwankwasiyya 501 students.
vi
TABLE OF CONTENTS
STATEMENT OF NON PLAGIARISM ……….iii
ABSTRACT………...iii ÖZ………...iv ACKNOWLEDGENT………....v TABLE OF CONTENTS………..…..………...vi LIST OF TABLES………..………...viii LIST OF FIGURES………ix CHAPTERS 1 Introduction ………1
1.1 Statement of the Problem and the Significance of the Study………..1
1.2 Objectives of the Thesis ………..4
1.3 Scope of the Thesis ……….4
1.4 Structure of the Thesis ………4
2 ECONOMIC POLICIES IN NIGERIA ……….5
3 LITERATURE REVIEW ...10
3.1 Trade openness and Economic Growth………10
3.2 Trade openness and Manufacturing sector………...17
4 DATA AND METHODOLOGY ………... 22
5 EMPIRICAL RESULTS………....27
5.1 Unit root tests………...27
5.2 Bounds Testing………....29
5.3 Autoregressive Distributive Lag (ARDL) Model………....31
5.4 Error Correction Model (ECM)……….…………..33
5.5 Stability Condition………..35
5.6 Diagnostic Checks………...37
vii
CONCLUSIONS……….……...42
BIBLIOGRAPHY………44
APPENDIX A………..52
viii
LIST OF TABLES
Table 1 Economic Indicators in the Pre and Post Liberalization Periods in Nigeria..6
Table 2 Data Sources……….23
Table 3 Descriptive Statistics………25
Table 4 Unit Root Tests ………...28
Table 5 Optimal Lag Length Selection……….30
Table 6 ARDL Bounds Test of Co-integration……….30
Table 7 Autoregressive Distributed Lag Estimates ………..32
Table 8 Estimated Long Run Coefficients………...33
Table 9 Error Correction Representation for the Selected ARDL Model………...34
Table 10 Estimated Long Run Coefficients………..37
Table 11 Autoregressive Distributed Lag Estimates……….39
Table 12 Estimated Long Run Coefficients………..40
Table 13 Error Correction Representation for the Selected ARDL Model………..40
ix
LIST OF FIGURES
Figure 1 Plots of Data……….26 Figure 2 Plots of the CUSUM and CUSUMSQ Stability tests……….…….36
1
CHAPTER 1
INTRODUCTION
1.1 Statement of the Problem and the Significance of the Study
There are two major policies for industrialization which, most developing countries adopted for economic growth and development: import substitution and export promotion. Import substitution policy is also known as inward oriented policy or inward orientation. Import substitution policy is implemented by simply substituting the imported goods with the locally produced goods in order to meet the internal demand (Bruton, 1998). ‘‘Import substitution industrialization (ISI) is simply the industrial development program based on the protection of local infant industries through protective tariffs, import quotas, exchange rate controls, special preferential licensing for capital goods imports, subsidized loans to local infant industries, etc.’’ (Ogujiuba et-al, 2011). Bruton, (1998) argued that, ‘‘the general rationale of import substitution created three broad policy issues: how to provide the protection that was deemed necessary, how to increase saving and investment, and how to go about the planning process’’. Classical economists, believed in government involvement in foreign trade, hold the strong view that import-substituting industrialisation can be an important strategy for raising earnings and savings of foreign exchange, generating externalities and learning effects (Jayanthakumaran, 2000). According to him the logic behind the ISI is attached on forward and backward linkages in industrialization processes and economies of scale and ISI was designed to promote native/local industries to replace the imported manufactured products that were consumed locally. Hence, the import substitution industrialization policy was predominantly employed by developing and emerging markets nations, that advocates for replacement of imported goods with domestic goods purposely to increase self-sufficiency and decrease dependency on other developed nations and to pursue economic independence.
2
Export promotion policy (EP) is also known as outward oriented policy or outward orientation. Goal of an export promotion policy is to produce a goods and exporting it to the international market. Nigerian government adopted Structural Adjustment Programme (SAP) in 1986 in order to liberalize trade to promote economic growth. Developing nations reached their development via substituting the imported goods with locally produced goods and creating an environment for the private individuals to engage actively in the economy. Meanwhile, the less-developed industries in developing countries reached their potential to a level that it can compete with foreign industries therefore; they should shift from import substitution to export promotion strategy. The evidence of this is that most of the less-developed countries have shifted their policies to serve for an export promotion policy after an import substitution policy (Eowanns, 1993). ISI provide a dynamic ‘entry route’ into export-base industrialization if it serves as a basis for technological learning. If the knowledge and skills of the workforce obtained under an ISI policy are not useful for producing goods for the international market, ISI would not be a viable route for achieving the export promotion. Import substitution policy creates biases in the incentive structure and lowers the growth of potential exports in the long term (Ogujiuba et-al, 2011). This necessitates the need of export-oriented policy over time (Jayanthakumaran, 2000). Industries in sub-Saharan Africa failed to use ISI as a learning process to obtain the necessary technological capability for export production. Obviously, ISI had encouraged accumulation of production capacities but paid little attention to accumulation of technological capability. After independence Nigeria, for instance, in 1960, textiles rapidly became the leading ISI sector, with protectionist policies encouraging a spate of fresh investments by Oriental investors, mainly Indians and Japanese. However, unfortunately, ISI in Nigeria, as in most of post-colonial African countries, created protected markets; separated from world technology and international competition, which led to the demise of the ability of the Nigerian manufacturing industries to export. Although protection did, indeed, stimulate investment and growth in production capacity, as Nigeria‘s experience cited above shows, it did little to accelerate innovative activity or technological learning leading to productivity growth and so failed to lead to the type of growth of industrial catch-up or current industrial revolution. Moreover, Jayanthakumaran (2000) opined that import substituting industries focuses limited
3
small domestic market and this is major constraint of achieving economies of scale in the process of industrialisation.
Olaifa, et-al (2013) paraphrased Elana, (2005) which states that, ‘‘Economic theory traditionally considers trade liberalization to be the reduction or complete removal of existing trade restrictions and economists typically endorse it as allowing for efficiency.’’ Most of the existing literatures find a direct correlation with openness and economic growth of a given country, especially when governments eradicate trade barriers. Trade openness perhaps improve resources allocation in the short run or raise economic growth rates, which should benefit ordinary citizens in a given nation permanently, mean while there are still other arguments opined different view.
Removing of trade barriers is the most direct way forward to free trade, but many countries have made more gradual and flexible alternative in choosing their approaches (Olaifa, et-al 2013). The neo-liberals argued that liberalizing trade has the potentials to improve competition in local and global markets. This argument is floated on the fact that in an attempt to pursue the foreign market or compete with foreign firms, exporting domestic firms have to overcome inefficiency and embark upon producing high quality products at low costs. They can only do this by acquiring adequate new and modern technology that will make them competitive at the international market (Thirlwall 2000).
Alfaro and Chanda (2002) also opined that openness measured by foreign direct investment FDI displayed an anonymous role through the contribution of economic growth. Countries with a well-developed financial market, benefit from openness while countries like Nigeria with a less-developed financial market, have a low growth. The higher liberalization of Nigerian external trade could have brought about recession as experienced in recent time, due to weaknesses of industrial sector of the economy to trade sector and inability of the sector to shield every shock that may affect it from external trade disturbances.
4 1.2 Objectives of the Thesis
There is a large empirical literature on the relationship between trade openness and industrial growth in both developed and developing countries. Establishing a causal relationship between industrial performance and openness to trade has proved quite challenging because of numerous complicating factors. This is an unsettled issue, some researchers believing that openness causes industrial growth, while others think the opposite. In this study we intend to shed some light on this issue by using Autoregressive Distributed Lag (ARDL) Model.
1.3 Scope of the Thesis
For the scope of this study we will not be concerned with the period of import substitution industrialization, which is the period prior to the trade openness in Nigerian economy. Hence, we would concentrate more on the empirical study on trade openness and industrial performance from 1986 to 2008, which covers the period since the inception of Structural Adjustment Program (SAP) in 1986.
1.4 Structure of the Thesis
The rest of the study proceeds as follows: chapter two is concerned with economic policies in Nigeria, chapter three presents a review of literature on the connection between openness and manufacturing and economic growth, chapter four describes data and methodology, chapter five reveals empirical results, and chapter six concludes.
5
CHAPTER 2
ECONOMIC POLICIES IN NIGERIA
Nigeria since independence formulated different policies, institutions and incentives purposely to stimulate industrial development in the economy. Like many other developing countries, Nigeria’s early years of independence had seen an industrial strategy that relied heavily on import substitution. The import substitution industrialization (ISI) policy was the first industrial strategy embarked upon by the Nigerian government immediately after the attainment of independence in 1960. Second one was the trade liberalization policy that was adopted in 1986. The main aims and objectives of ISI policy include promotion of industrialization, reduction of overdependence on foreign imports, and to save foreign exchange by producing those products in domestic industries that were formerly imported from abroad. From the 1960’s up to 1970’s agricultural sector was the dominant sector of the economy, contributing about 70% of the Gross Domestic Product (GDP), employing about the same percentage of the working population, and accounting for about 90% of foreign exchange earnings and federal government revenue (Oladipo, et-al 2006). In 1972, the Nigerian indigenization policy was adopted because of the discerned failure of the import substitution industrialization strategy. The major objective of this policy was to transfer the ownership and control to Nigerians especially, those enterprises owned and controlled by foreigners, creation of job opportunities for Nigerian citizens, encouragement of foreign investors to move from unsophisticated area of the economy to the area where investment are more needed. Hence, in 1972, the Act that resulted in the promulgation of indigenization policy was amended and subsequently replaced with the Nigerian Enterprise Promotion Act in 1977. The 1977 Act contained 111 schedules while the 1972 Act contained 11 schedules.
The Adoption of SAP in 1986 led to the emergence of trade liberalization in Nigeria which was accompanied by the removal of foreign exchange controls to reflect economic realities, price control removal, and non- operation of commodity
6
boards. Olaifa, et-al (2013), argues the thrust of creating SAP in Nigeria was to provide an environment conducive to enhance inflows of capital, technology transfer and way forward of increase in the share of trade revenue to government which serves as another means of reducing heavy reliance of the economy on crude oil revenues.
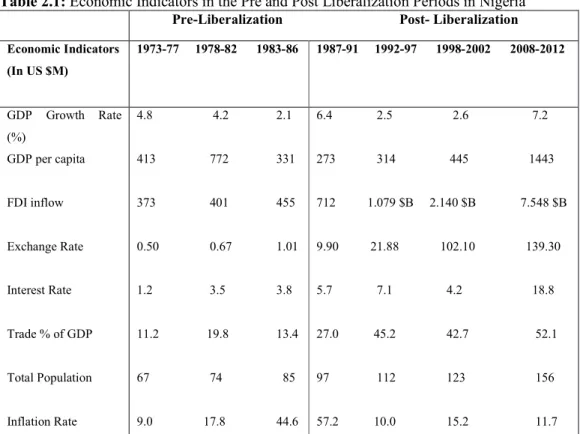
Table 2.1: Economic Indicators in the Pre and Post Liberalization Periods in Nigeria
Pre-Liberalization Post- Liberalization
Economic Indicators (In US $M) 1973-77 1978-82 1983-86 1987-91 1992-97 1998-2002 2008-2012 GDP Growth Rate (%) GDP per capita FDI inflow Exchange Rate Interest Rate Trade % of GDP Total Population Inflation Rate 4.8 4.2 2.1 413 772 331 373 401 455 0.50 0.67 1.01 1.2 3.5 3.8 11.2 19.8 13.4 67 74 85 9.0 17.8 44.6 6.4 2.5 2.6 7.2 273 314 445 1443 712 1.079 $B 2.140 $B 7.548 $B 9.90 21.88 102.10 139.30 5.7 7.1 4.2 18.8 27.0 45.2 42.7 52.1 97 112 123 156 57.2 10.0 15.2 11.7
Source: Table is from Olaifa, et-al (2013) page 46, data come from World Development Indicators
2013.
In Table 2.1 economic indicator had showed that trade as a percentage of GDP per capita and foreign direct investment (FDI) inflow rose from the pre-liberalization period but experienced the highly significant rise in the post-liberalization period, which both of them revealed a similar trend in the economy .Apparently, the entire indicators had showed an upward trend from the pre-liberalization to post-pre-liberalization period. However, Nigerian economy experienced persistence significant rise of interest rate even in the post liberalization period (Olaifa, et-al 2013).
The time period of economic programmes in Nigeria of post-independence period are categorized in to the Pre Structural Adjustment Programme (Pre-SAP),
7
Structural Adjustment Programme (SAP) and Post-Structural Adjustment Programme (Post-SAP). The period prior to the trade openness is the period of pre-SAP and period after trade was open up is the period of post-pre-SAP. Pre-pre-SAP is a period where 4 different National Development Plans (NDP) were carried out to enhance Nigerian economic growth and import substitution is incorporated as at then. First National Development Plan was from 1962 to 1968, the second National Development Plan was from 1970 to1974, the third National Development Plan was from 1975 to1980 and the fourth National Development Plan was from 1981 to 1985 and Structural Adjustment Programme (SAP) from 1986 to 1993. Meanwhile Post-SAP period is from 1994 to 1998, Democratic Transition from 1999 to 2002, National Economic Empowerment and Development Strategy (NEEDS) from 2003 to 2007, and Global Economic and Debt Crises from 2008 to 2011 in Nigeria (Oluwaseyi, 2013; Marcellus, 2009).
Nigerian government adopted the Structural Adjustment Programme (SAP) in June, 1986 to liberalize the economy. However, SAP was considered as the policy that would bring the appropriate transformation of the economy from agrarian to industrialize economy. Obviously, this policy was adopted in order to address the weaknesses of earlier policies. Its aims and objectives include privatization and commercialization of the economy to promote industrial efficiency, promoting investment, stimulating non-oil exports and providing a base for private sector led development, to develop local technology and use of local raw materials and intermediate inputs rather than depending on imported ones. The industrial policies that influenced by SAP were interest rate deregulation, new export policy incentive, debt conversion (equity), privatization and commercialization.
Trade and Financial Liberalization Policy in 1989 were enacted to foster competition and efficiency in the financial sector. The main aims and objectives of policy include stimulating and accelerating competition among the local industries and between the domestic imports competing industries and foreign industries with a view to promote efficiency. Meanwhile, the objective was to promote efficiency among the industries, reduction of levels both tariff and non–tariffs barriers, scrapping the commodity marketing boards and market determination of exchange rate as well as deregulation of interest rates meant to foster efficiency and productivity. In same year federal government set the National Economic
8
Reconstruction Fund (NERFUND) is the fund government set to serve as the auxiliary institution to the industrial policy. NERFUND was designed to identify and address the issues of the medium and long term financial impediments that small and medium scale entrepreneurs experienced, and to render the required financial resources to participating merchant and commercial banks in order to lend to small medium scale industries and provide foreign denominated loans to existing and participating industries for a period of five to ten years with a grace period up to one to three years (Udoh, et-al 2011).
Consequently, Bank of industry (BOI) was established in 2000 as an introduction of development institution to accelerate and stimulate industrial growth and development in country through the provision of long-term loans, equity finances and technical assistance to industrial enterprises. The bank is made up of the combination of the following institutions: Industrial and Insurance Brokers (IDIB), Nigerian Bank for Commerce and Industry (NBCI), Leasing Company of Nigeria Limited (LECON), Nigerian Industrial Development Bank (NIDB). Other aims and objectives of this bank include industrial dispersal and promotion of indigenous entrepreneurship, providing the long term loans, assist in employment generation, to mention but a few. In line with the Bank of Industry, Small and Medium Industries Equity investment Scheme (SMIEIS) was also set up in 2000. The objective of this scheme include but not limited to assist in the co-ordination of the scheme with a guideline that 60 per cent of the SMIEIS fund should go to core real sector, 30 per cent to services and 10 per cent to micro enterprises through NGOs. Among objectives of SMIEIS include promotion of effective resource utilization, easy adaptability of local technology, moderating rural/urban migration, enhancement of regional economic balance through industrial dispersal etcetera (Udoh, et-al 2011).
The National Integrated Industrial Development (NIID) was a blueprint adopted as part of the effort to boost industrialization in the economy by the Federal Government in 2007. The NIID is a country service framework developed by the United Nations Industrial Development Organization (UNIDO) in collaboration with Federal Ministry of Industry and other stakeholders. This framework consisted four integrated programmers which include, strengthening industry’s institutional support base, industrial governance and public/private sector partnership, the challenge of low electricity generation and utilization to be addressed through rural renewable energy and rural private sector agro-industrial development. The federal government
9
of Nigeria set Presidential Committee on Revitalizing of the Textile Industry in Nigeria with the approval of a 50 billion naira loan to the textile subsector. Efforts to boost the development of SMEs through the construction of one industrial estate in each of the six geo-political zones of the country by the Small and Medium Enterprise Development Agency of Nigeria (SMEDAN). The estates were conceived against the background of providing industrial plots with regular power supply, provision of portable water and sewage system in a designated region. (Coker, et-al 2012), (Udoh, et-al, 2011).
National Economic Empowerment Development Strategy (NEEDS), established form 2003 to 2007. Basically, the NEEDS’s objectives is almost similar to the previous policies’ objectives, where the government’s hope is that NEEDS will create 7 million new jobs to Nigerian citizens, economic diversification, boosting non-energy exports, increase industrial capacity and utilization, and improve agricultural productivity. However, relatively in a state called State Economic Empowerment Development Strategy (SEEDS) (Udoh, et-al 2011).
For the purpose of achieving these policy objectives, the government formulated number of incentives aimed at positively influencing the performance and productivity of the industrial sector. Some of these incentives include tax holidays, tariff protection, total ban on certain foreign goods to encourage domestic production, reduction of excise duty, building of Export Processing Zones and Industrial Raw Material Research and Development Council (IRMRDC), provision of loan, export incentives etc. (Udah, 2010).
Despite all the aforementioned policies Nigerian government embarked upon since independence in 1960. In contemporary situation, because of the emergence of crude oil in commercial quantity in 1956, meanwhile the production started in 1958, Nigerian economy was absolutely shifted to the oil sector. The share of oil sector currently is about 80 per cent of GDP and 90 per cent of total exports.
10
CHAPTER 3
LITERATURE REVIEW
3.1 Trade openness and Economic Growth
Olufemi (2004) found that economic growth and openness are co-integrated by using time series data on Nigerian economy from 1970 to 2000, which indicates that there is a long-run equilibrium relationship between economic growth and openness in Nigeria. Ironically the results also revealed that there is no longer granger causality between trade openness and economic growth in Nigerian economy and result however, showed increasing trade openness would lower the economic growth in Nigeria. Nduka (2013) used data from 1970 to 2008, where he empirically tested whether openness leads to economic growth in Nigeria. The regression result showed that by holding other variables constant, 1% increase in investment brings about 18% increase in the economic growth, and one unit increase in the degree of openness leads to an increase in the level of economic growth by about 5% by holding other variables constant. Results also showed that 1 percent increase in government expenditures brings about 9.7 percent increase in the level of economic growth, and 1 percent increase in lagged GDP leads to about 100% increase in current GDP. His co-integration tests results showed that there is long run equilibrium relationship between economic growth, investment, openness, government expenditure, and lagged GDP in Nigeria.
Daniel, et-al (2006) investigated the relationship between trade liberalization and economic growth by using a panel data set of 18 Latin American economies that covered the period of 1952 to 2003. Their analysis involved 3 variables, annual growth rate of GDP per capita, the openness index (sum of total exports plus sum of total imports divided by GDP), and the investment share of the GDP. The results showed that, in the seven countries (Brazil, Chile, Ecuador, Guatemala, Panama, Paraguay, Uruguay) covered by the study there is unidirectional Granger causality
11
running from trade to growth, however, in three countries (Argentina, Dominican Republic and EI Salvador) the causality goes from growth to trade, in two countries (Costa Rica and Mexico), bidirectional Granger causality exist between these variables, in six countries (Bolivia, Colombia, Honduras, Nicaragua, Peru and Venezuela) there is no longer prevailing evidence of Granger causality in either direction. Oluwaseyi et-al, (2013) conducted an empirical study by employing the time series data from 1960 to 2011, and the results of their investigation revealed that trade openness, lagged growth rate; inflation, foreign investment, financial sector development, and the lending rate have significant positive effect on current economic growth.
Abdullahi et-al, (2013) used a data for the period of 1970 to 2010 from World Development Indicators and adopted ordinary least square (OLS) method, where they investigated relationship between trade liberalisation and economic growth in Sub-Saharan African (SSA) countries including Nigeria. The study revealed that foreign direct investment and trade liberalisation have significant positive relationship on economic growth. Finding also indicated that trade liberalisation and foreign direct investment makes economic growth of SSA significantly robust. Moreover, the study also posited that, financial sector developments, inflation, and population growth have significant negative relationship on economic growth in SSA. Olaifa, et-al, (2013), in their study postulated that openness, foreign direct investment (FDI), and imports have positive and statistically significant effect on economic growth in Nigeria. This implies that trade liberalization enhances economic growth. Conversely, exports have a significant and negative effect on the GDP.
Muhammad et-al (2010) carried out a research in Pakistan to investigate the causality relationship between Foreign Direct Investment (FDI), international trade and economic growth, by using time series quarterly data from 1998 to 2009. They used the basic principle of Granger causality analysis and Vector auto regression (VAR) models. The results showed that there is a long run relationship among GDP, FDI, exports, and imports; there is bidirectional causality between GDP and exports and unidirectional relationship between GDP and imports. Moreover, there is only unidirectional causality running from imports to FDI and GDP. The results also are consistent with growth theories saying that export promotion and attracting FDI can
12
have permanent effects on the GDP growth. Manni et-al (2012) in their study investigated the impact of trade openness on Bangladesh economy from the period of 1980 to 2010. They used the Ordinary Least Square (OLS) method and found out that GDP growth increases trade openness. Trade liberalization similarly, does not have significant effect on inflation in the economy. Greater openness brings about favourable impact on real exports which subsequently leads to higher economic growth. Menyah, et-al, (2014) investigated the causal relationships between trade openness, financial development, and economic growth for twenty one sub-Sahara African (SSA) countries from the period of 1965 to 2008. Their results showed that there is limited causal relationship between financial development and trade openness among the 21 SSA countries covered by the study. However, they found a limited positive effect of trade openness and financial development on economic growth during the period of 1965 to 2008 amongst these 21 SSA countries.
Yanikkaya (2003) empirically tested the trade openness and economic growth relationship by using panel data of spanning the period from 1970 to 1997 on over 100 developed and developing countries. His result showed that trade liberalization does not have straightforward direct relationship with economic growth. But, lowering trade barriers in developing countries had some positive significant effect on economic growth.
Chaudhry et-al (2010) conducted causality tests between trade liberalization, human capital and economic growth in Pakistan by using co-integration and Granger causality methods, their data in estimate is from the period of 1972 to 2007. The variables used include Gross Domestic Product (GDP), employed labour force, gross fixed capital formation as percent of GDP, proxy for capital, real exports as percent of GDP, and human capital index. The results showed that there is short run and long run co-integration and causality relationships among variables in the growth model. This indicated that education and trade openness policies perhaps have the feasibility of sustaining economic growth. Furthermore, there is unidirectional causality relationship running from labour and trade openness to GDP growth meanwhile, there is unidirectional causality between human capital and labour force participation to GDP growth. Obviously, the results indicated that 1% increase in trade openness brings about 3.06% rises in the real gross domestic product. Meanwhile, Alimi et-al, (2011) made an inquiry on the effect of globalization on Nigerian economic growth
13
from 1970 to 2010. Their results revealed that globalization has significant positive impact on economic growth in Nigeria, while the positive of business cycle was insignificant on real GDP growth. Furthermore, external reserves tend to protect the economy from external shocks from abroad and the international prices relatively tend to stabilize the real GDP growth rate in Nigeria. Finally, the author posits that globalization and foreign investment cyclical movement enhanced economic growth in Nigeria significantly.
Kanayo et-al, (2004) carried out an investigation of the long-run relationship between openness and growth in Nigeria using the co-integration approach. Results revealed that there is no significant relationship between openness and economic growth and if openness did not control properly could diminish the growth of local industries, government revenues, and the real economy (goods and services sector). Georgios (2003) conducted inquiry on effect of trade openness and economic growth by using two sets of panel data: data on a sample of 56 countries ranging from the period of 1951 to 1998, and data on a sample of 105 countries over 1960 to 1997. His results showed that there is positive and statistically significant effect of trade openness on economic growth. Furthermore, he also revealed that developing nations gain more from openness than developed nations because technologies transfer from developed to developing countries becomes easier. Sarkar (2005) carried out a study on whether or not trade openness accelerates and stimulates economic growth in India and Korea. The sample for India covered the period from 1956 to 1999 and the sample for Korea from 1956 to 2001. Results of the Auto Regressive Distributed Lag (ARDL) model used in the study showed no positive long-term relationship between trade liberalization and economic growth in India and Korea during the particular period under inquiry. Dollar et-al (2004) found out that one third of the world's developing countries had a rapid rate of globalization and this increased income growth and reduced poverty in the last two decades. These developing countries include Bangladesh, India and Sri Lanka in south Asia, where trade had grown rapidly, and both tariff and non-tariff trade barriers had come down significantly. On the other hand, remaining two third of the world developing countries, mostly in Africa, did not undergo trade expansion because of insufficient implementation of export orientation strategy, and consequently did not experience poverty reduction and acceleration in GDP growth.
14
Barboza (2007) conducted a study on the contribution of trade openness on output growth in Latin America by using panel data covering the period of 1950 to 2000. The results showed a significant positive and robust relationship between trade openness and economic growth. Olusegun, et-al (2009) conducted an empirical study of both causal and long-run interrelationships among FDI, trade openness and economic growth in Nigerian economy. Nigerian time series data covering the period from 1970 to 2006 had been used in the study. The study used the Toda-Yamamoto non-causality test and the Auto Regressive Distributed Lag (ARDL) technique to co-integration. The result of Toda-Yamamoto non-causality test indicates unidirectional causality from trade openness to output growth, and ARDL also showed there is the existence of co-integration relationship among variables. The ARDL co-integration procedure further indicated that both FDI and trade openness have significant positive relationship with output growth in Nigeria. Li et-al, (2010) studied an empirical analysis based on panel causality on the relationship between foreign trade and GDP growth in West China. They used unit root tests, Granger causality tests, and the error correction model (ECM) to investigate the causality between foreign trade and GDP growth by using panel data on 12 provinces of western China from 1981 to 2008. The results indicated the existence of long-run and short-run causality between GDP and total exports. Total exports has positive relationship with GDP growth and the causality is bidirectional, foreign trade has the long-run and short-run relationship with GDP growth, but no evidence showing the existence of long-run causality relationship between imports and GDP growth. Osabuohien (2007) carried out an investigation on trade openness and economic performance of members of Economic Community of West African States (ECOWAS), reflection from Ghana and Nigeria, by employing Augmented Dickey Fuller (ADF) and Phillips-Peron (PP) co-integration test. Results indicated that there is long-run relationship of Ghanaian and Nigerian economy between trade openness, government expenditure, economic performance, real capital stock and labour force.
Sarkar, (2008) studied the link between openness and growth by using cross-country panel data analysis by taking a sample of 51 countries for the period from 1981 to 2002 and time series of individual countries for the period from 1961 to 2002. Panel data analysis regressions was conducted for the groups of 16 ‘rich’ countries and 35 ‘poor’ countries and result indicated significant positive relationship between trade openness and GDP growth for the ‘rich’ group between 1981 to
15
2002.The results on individual countries indicated that most of the developing countries, including the East Asian ones, did not exhibit positive long-term relationship between openness and growth during the period of 1961 to 2002. Results from the extended analysis indicated that only the middle income group showed a positive long-term relationship between openness and growth. Frankel and Romer (1999) estimated cross-country regression of income per capita on external trade and nation size by using the method of instrumental variables and compared the results to those derived obtained with Ordinary Least Square (OLS). They concluded that raising the degree of openness by 1 percent increased income per capita by 1.5 to 2 percent.
Dudley and Karski (2001) investigated whether the degrees of openness affect economic growth in ten developing countries in the period from 1969 to 1989 by using panel regressions. Results showed that in three out of the ten countries the degree of openness has a significant positive effect on economic growth, in three countries openness has significant negative effect on economic growth, and in the remaining four countries openness to trade neither has a neither significant positive effect nor significant negative effect on growth.
Parikh, (2006) investigated the effect of trade openness on economic growth on the economies of 42 developing nations of Africa, Asia, and Latin America for the period from 1990 to 1999. Fixed effect and random effect models and OLS regression had been used in the study. Results indicated that openness promotes growth but the growth has a significant negative effect on trade balance for most of countries under study. The country by country regressions showed that the openness has positive contribution to African economies growth. Ajayi et-al (2012) studied the effects of trade and capital flow channels of globalization on macroeconomic stability as proxied by real GDP growth rate in Nigeria in the period from 1970 to 2009. They used an autoregressive model, which indicated that the first lag of real GDP growth rate has positive and significant impact on real current GDP growth rate, but the second autoregressive term is found insignificant.
Onafowora et-al (1998) investigated the changes occurred in economic growth that are likely to result from changes in trade policies, exports and investment in twelve sub Saharan African (SSA) countries (Burundi, Cameroon, Cote d’voire, Ethiopia, Ghana, Kenya, Madagascar, Nigeria, Senegal, Sudan, Tanzania, Zambia) by employing a Vector Error Correction Model (VECM). The results showed that
16
trade policies, exports and investment rate shocks have a significant impact on economic growth in ten out of the 12 SSA nations, except for Cameroon and Sudan. This suggests that it is feasible to stimulate and accelerate economic growth in some African countries through export orientation strategy. Sinha and Sinha (1996) investigated the relationship between openness and economic growth in 124 countries. The results indicated that growth in openness indeed have significant positive effects on the growth of real GDP in 94 nations out of the 124 nations. Djeri-wake (2009) investigated the impact of China's investment and trade on economic growth in Nigeria from the period of 1990 to 2007 by using the OLS and Granger causality test. The OLS results showed that relationship between Nigeria and China bilateral trade doesn’t contribute growth to Nigerian economy in the short-run, but long-run bilateral trade relationship improves Nigeria economic growth. Granger causality result indicates that dynamism of Nigerian labour force is the main engine for bilateral trade growth between Nigeria and China. Chimobi (2010) made an investigation in Nigeria on the causal relationship among financial development, trade openness and economic growth and found out that trade openness and financial developments (Direct Credit, Private Credit and Money supply), have causal impact on economic growth in Nigerian economy. Conversely, there are no co-integrating relations between GDP growth, trade openness and financial development. Sultan, (2008) examined the relationship between external trade and economic growth in Bangladesh by using annual data from 1965 to 2004. Results showed that long-run relationship exists between GDP and industry value added. Granger causality tests that were conducted within the Vector Autoregressive (VAR) framework showed that the GDP is Granger caused by import, export, and investment. These results implied that export orientation and industrialization (industrial value added) of Bangladesh economy would accelerate and stimulate the demand for imports of capital goods and technology transfer, which subsequently will increase Bangladesh economic growth.
3.2 Trade Openness and Manufacturing Sector
Umoh et-al, (2013) found that there is a long-run relationship among variables of index of manufacturing output, trade openness, nominal exchange rate, interest rate spread i.e. (difference between interest lending rate and discount rate) and SAP dummy variable in Nigeria during the period of 1970 to 2008 by employing
17
bound testing approach. ARDL co-integration tests revealed that in the long-run interest rate spread has a negative significant implication on manufacturing output in Nigeria, openness to trade and nominal exchange rate have a positive and significant effect on Nigeria’s manufacturing production. Onakoya et-al, (2012) used data for the period from 1975 to 2010 and found that manufacturing output growth, trade openness; growth of investment, employment growth, inflation rate, and real exchange rate in Nigeria are co-integrated, indicating a long-run relationship among these variables. Similarly, in their test of Error Correction Model (ECM) authors found that real exchange rate and inflation rate do not significantly affect the manufacturing output growth, but investment growth, trade openness, employment growth and foreign exchange have the significant positive impact on Nigeria’s manufacturing output growth. Chandran (2009) explored the long-run relationship between trade openness and manufacturing growth in Malaysian economy by employing time series data from 1970 to 2003. Bounds tests used in the study revealed that the effect of trade openness on manufacturing value added was significant and positive, especially in the long-run.
Kareem (2010) conducted study on the relationship between international trade and employment in Nigerian economy from 1981 to 2006 and result revealed that no positive significant link in both the short-run and long-run between trade flows and employment in Nigeria, some factors (such as SAP, FDI, labour regulation etc.) have more relative to employment in Nigeria than international trade. In contrast, Ozyurt et-al (2013) have different results where they investigated Brazilian states by employing dynamic regression with Generalized Method of Moments (GMM) estimator system by studying the impact of international trade flows on economic growth; they also provided evidence that openness benefited Brazilian states with a high level of initial income per capita and contributed significantly to the widening of disparities among different regions in Brazil.
Tamuno et-al, (2011) conducted an inquiry from 1970 to 2008 by employing Johansen’s co-integration and ordinary least square (OLS) tests. In their study Johansen’s co-integration test revealed the long-run relationship between degree of openness, FDI, external debt, nominal exchange rate and gross capital formation. Meanwhile, OLS result indicates degree of openness and gross capital formation has negative significant impact on the Nigerian industrial sector. According to them the
18
Nigerian industrial sector is vulnerable and cannot compete strongly with her foreign counterparts. Nigeria should encourage the production of non-primary export commodities and formulate policies that would attract foreign direct investment since domestic investment is weak and unreliable. External debt should be sourced for productive capital projects only and also as means of exchange rate stability. Ubi et-al (2012) in his study reveet-aled that, a reduction in nominet-al exchange rate, bet-alance of trade, money supply, total reserve, would significantly stimulate and accelerate the industrialization in Nigeria.
Chete et-al, (2002) carried out a firm level study to investigate the impact of trade liberalisation on manufacturing sector productivity growth from 1988 to 1990. Their empirical result showed that trade liberalisation enhances productivity growth in Nigerian economy. Ironically, in their analysis described that, the manufacturing sector was recorded a negative growth in total factor productivity growth from 1962 to 1985. This is the exact time before liberalizing the trade in 1986. It is deduced from the research that it should be easy for Nigeria to accomplish the preliminary stage of import substitution industrialisation; it was however, difficult to proceed to the more difficult stage of producing capital goods. This was clear from the inappropriate implementation of industrial policies of that period. That is the reason why Nigeria did not produce certain necessary product that should substitute the imported goods especially, intermediate and capital goods not even shifting to the exporting such goods.
Udoh, (2011) employed ordinary least square (OLS) and his result revealed that democracy has no positive significant implication on the share of GDP growth of manufacturing sector, depreciation of foreign exchange rate could have significant positive implication on the share of manufacturing GDP growth, meanwhile, public expenditure, monetary policy, and trade openness, were not statistically significant determinants of manufacturing share in total output growth during democratic dispensation in Nigeria i.e. from 1999 to 2008, where the highest share of manufacturing in GDP was reported in 1983 since then manufacturing has been diminishing.
In his study Adeoye (2004) asserts that the Nigerian economy yet is heavily dependent on the foreign industries for the supply of intermediate input. The study concludes that Nigerian productive base of the economy yet is heavily dependent on
19
the exportation of crude oil for revenue generation. Due to the heavy reliance of Nigerian economy on the crude oil as a major government source of generating revenue, manufacturing sector were neglected and continuously decline. The manufacturing sector declined persistently to 6.8, 6.5, 6.3 and 6.2 per cent in 1995, 1996, 1997 and 1998 respectively.
Ogujiuba et-al (2011) citing World Bank (1994), postulated that exportation of Africa‘s manufacturing products had been diminished between 1970 to 1986 while raising five-times for Latin America and thirteen-times for Southeast Asia. Also said, empirical studies on transitions of industrialization in developing countries indicated that, with an exception of Mauritius, there is no longer Sub-Saharan African country has experienced an industrial revolution in the approach of the East Asian Newly Industrializing Countries (NICs). In contrast to Sub-Saharan Africa, East Asian nations have started in the 1950s and 1960s. Singapore, South Korea (Republic of Korea), Taiwan and Hong Kong started their industrial revolution in the 1950s to 1970s; followed by Indonesia, Malaysia and Thailand in the 1970s to 1980s; and contemporarily, Vietnam, China and India (in South Asia) are at high stage, in the catching-up game of industrialization.
The foreign direct investment (FDI) has vital role to play during import substitution industrialisation era for economic growth and development in developing nations. Coker et-al (2012) in their analysis came up with demise of Nigerian import substitution industrialisation policy to attract foreign direct investment because of lack of political will that would engage into joint investment projects with the technologically advanced countries or companies, political and economic instability which resulted into thirty-month civil war in 1960’s, turning Nigeria into dumping ground of obsolete goods, inadequate necessary infrastructure for foreign investment to thrive, reluctance of multinational corporation to transfer technology to Nigeria.
In the study of Akinlo, (2004) Error Correction Model (ECM) empirical results exhibited that extractive foreign direct investment (FDI) particularly oil might not improve growth in analogy to FDI of manufacturing. However, his results also showed that the growth should be attained and sustained if FDI inflows are channelled into other productive sectors of the Nigerian economy rather than the oil
20
sector. Therefore, government needs to provide suitable atmosphere to intrigue FDI of manufacturing, similarly, his results also revealed that private capital and lagged foreign capital have little, and have not significant effect statistically on the economic growth; financial development ratio has negative effect significantly on growth as well. Export, labour force and human capital have a positive significant effect statistically on economic growth.
Udah, (2010) revealed the trends, of the industrial sector contribution to GDP that continue to decline since 1990, from 4.7%, 4.06%, 4.2% in 2003, 2004, 2005 respectively, all these values record the lowest industrial sector contribution to economic growth since Nigerian independence in 1960. The researcher employed Granger causality test, Auto Regressive Distributed Lag (ARDL) bounds test approach to co-integration and Error Correction Model (ECM) and his results indicated causality relationship that runs between GDP per capita and electricity supply that unidirectional relationship exists between capital employed and GDP per capita, electricity supply and capital, labour and electricity supply, but no causal effect between GDP per capita and industrial output. Similarly, electricity supply, industrial development, technology and capital employed are imperative determinants of economic development in Nigeria. But, industrial sector contribution to economic development was less than expectation despite promulgation of industrial policies since independence in Nigeria and such unsuccessful event was resulted to inadequate infrastructural facilities especially electricity supply.
Oladipo, et-al (2006) employed Ordinary Least Square (OLS) test and the result indicates that there is a negative relationship between GDP growth and oil produced (export domestic and consumption) and there was drop in the Nigerian oil sector due to the global economic meltdown despite government measures taken to mitigate it effects. Also they postulated that, in the early period of Nigeria post-independence up until mid-1970s experienced a rapid of industrial growth capacity and output, as the contribution of the manufacturing sector to GDP growth increased from 4.8% to 8.2%. However, the study has been conducted, where percentage of value-added manufacturing sector to GDP growth in 43 countries in in Sub-Saharan Africa (SSA), Nigeria obtained 5% of its GDP growth through manufacturing sector, which is below amongst the African countries compared the 20% levels for
21
Mauritania and South Africa (Malik et-al, 2006). Apparently, Nigeria experienced a great backwardness in the industrialization of economy since independence.
22 CHAPTER 4
DATA AND METHODOLOGY
The literature of growth and trade openness has been replete with number of econometric estimation methods, especially, simple regression (simple equation models) or system of equation for one country, or a multiple set-up of single equation models for estimating growth and trade openness. Likewise, some recent empirical studies have employed the co-integration and vector autoregressive (VAR) methodology; as well as vector error correction model (VECM) to analyse and estimate trade openness (Olufemi, 2004). In this study, we employ Autoregressive Distributive Lag (ARDL) methodology, which is used by Umoh et-al, (2013) among others.
We use the following variables in our estimations: industrial production index (IND) as our dependent variable, which is hypothesised to be determined by openness (OPNS), nominal effective exchange rate index (NEER), and the inflation rate (INF), which is calculated by using the consumer price index. (See Table 4.1 for definitions and sources of data.) The ratio of sum of the value of imports (M) and exports (X) of goods to GDP is our measure of openness, which is expressed as: =
While our main variable of interest is openness, we include two other variables, inflation rate and NEER, to control for macroeconomic policy and the exchange rate policy, respectively. Note that the exchange rate effect might be negative or positive depending on whether the export intensity channel or the input cost channel dominates. When the share of the cost of the imported inputs in total input cost is very high an appreciation of the domestic currency could stimulate growth by outweighing the negative effect arising from the decrease in exports.
23 Table 4.1: Data Sources
Variable Data
Source Unit
Value of Exports (goods) IFS US Dollars Value of Imports (goods) IFS US Dollars
Nominal GDP CBN Naira
Nominal Exchange Rate (end of period) IFS National Currency per US Dollar Nominal Effective Exchange Rate IFS Index, 2005=100
Consumer Prices, All items IFS Index, 2005=100 Industrial Production IFS Index, 2005=100
Notes: CBN: Central Bank of Nigeria, IFS: International Financial Statistics, Nominal Effective Exchange Rate is calculated by using the Consumer Price Index.
ARDL modelling approach can be illustrated by a simple two variable model, ARDL (1,1)
= + + + +
Where vt is the random error term. Error correction model can be derived as follows:
set = + ∆ and = + ∆ . Replacing these in the above equation
yields:
∆ = − (1 − ) + ∆ +( + ) +
We can obtain the error correction model by rearranging:
∆ = ∆ − (1 − )[ −
1 − −
( + )
1 − ] +
where the term in brackets is the error correction term. Coefficients and
( )
are the long-term coefficients.
The ARDL procedure is conducted in two stages. The first stage is the co-integration analysis by means of the bounds testing developed by Pesaran and Shin (1999) and Pesaran, et-al (2001). In the second stage long-run relationship implied by the model and indicated by the co-integration analysis is estimated. At this stage error correction model illustrating the short-run dynamics is estimated as well.
24
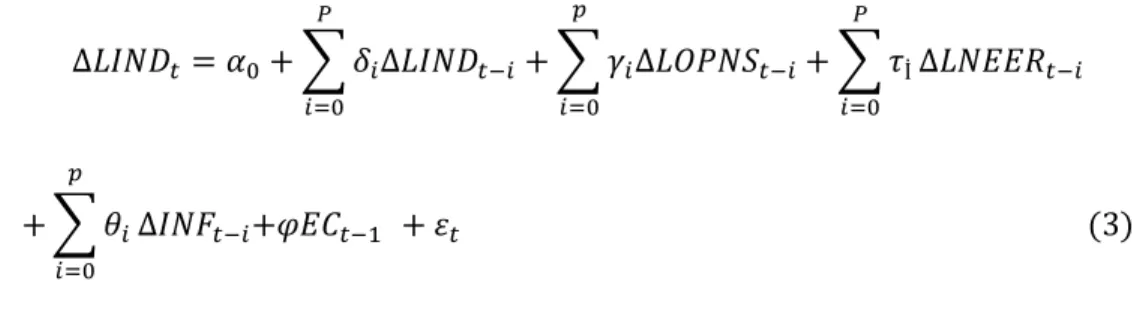
To do the bounds testing the following estimating equation is used1:
∆ = + ∆ + ∆ + İ∆
+ ∆ + + + + + (1)
where and is intercept and random error term respectively, while ∆ is the first difference operator. All variables are expressed in natural logarithms except inflation rate. The short-run relationships are measured by δ, γ, and θ, while long-run relationships are by µs.
The test has the null hypothesis of
: = = = = 0
against the alternative hypothesis
: ≠0, ≠0, ≠0, ≠0.
Null hypothesis indicates the absence of a long-run relationship. To perform the test, which is a familiar coefficient restriction test (F- test), critical values provided by (Pesaran et-al, 2001) are used.
In the second step long-run relationship is estimated by using the following equation:
= + + + + + (2)
Estimating equation for the error correction model (ECM) can be express as follows:
1 Our results are robust to including current values of OPNS, NEER, and INF (with zero lags) in equation 1.
25
∆ = + ∆ + ∆ + İ∆
+ ∆ + + (3)
The error correction term, captures the short-run dynamics.
Before we do the co-integration tests and ARDL estimation we used the Augmented Dickey-Fuller (ADF) and Philips-Perron (PP) unit root tests to make sure we do not have any variables that are I(2). The entire estimated parameters are subjected to assessment by using the t-statistic test and F-statistic test. Similarly, the overall stability of the empirical model is checked by using Brown et-al (1975) cumulative sum (CUSUM) and cumulative sum of squares (CUSUMSQ) method. We also check for serial correlation, normality, and heteroscedasticity.
The study employs quarterly time series data. All data except for nominal GDP, which was obtained from the Central Bank of Nigeria (CBN), come from the International Financial Statistics (IFS) data base compiled by International Monetary Fund (IMF). Descriptive statistics are given in Table 4.1
Table 4.2: Descriptive Statistics
Variable(s) LIND LOPNS LNEER INF Maximum 4.6449 -0.34000 8.9700 0.22296 Minimum 3.9689 -2.3700 4.5700 -0.046818 Mean 4.4587 -1.1968 5.7415 0.051980 Std. Deviation 0.13356 0.55259 1.0754 0.059555
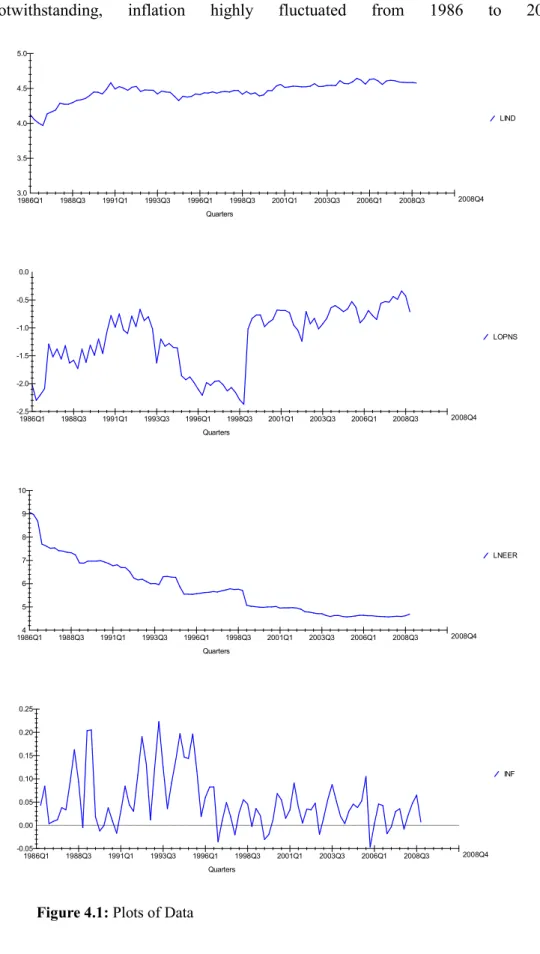
The plots of data are shown in Figure 1. Industrial production has the little increasing steady fluctuations from 1986 to 2008. Openness to trade rose in fluctuation from 1986 to 1993, but, steadily drop from 1993 to 1998 because of the significant drop in import of goods and GDP, meanwhile, the openness proceeds to rise from 1998 steadily in decreasing rate at the end of 2008. Nominal effective exchange rate was steadily dropping with very little fluctuation, from 1986 to 2008.
26
Notwithstanding, inflation highly fluctuated from 1986 to 2008.
Figure 4.1: Plots of Data
LIND Quarters 3.0 3.5 4.0 4.5 5.0 1986Q1 1988Q3 1991Q1 1993Q3 1996Q1 1998Q3 2001Q1 2003Q3 2006Q1 2008Q3 2008Q4 LOPNS Quarters -0.5 -1.0 -1.5 -2.0 -2.5 0.0 1986Q1 1988Q3 1991Q1 1993Q3 1996Q1 1998Q3 2001Q1 2003Q3 2006Q1 2008Q3 2008Q4 LNEER Quarters 4 5 6 7 8 9 10 1986Q1 1988Q3 1991Q1 1993Q3 1996Q1 1998Q3 2001Q1 2003Q3 2006Q1 2008Q3 2008Q4 INF Quarters -0.05 0.00 0.05 0.10 0.15 0.20 0.25 1986Q1 1988Q3 1991Q1 1993Q3 1996Q1 1998Q3 2001Q1 2003Q3 2006Q1 2008Q3 2008Q4
27 CHAPTER 5
EMPIRICAL RESULTS
Our sample period is from 1986Q1 to 2008Q4; this means that the period is equivalent to the inception of trade openness, up to the most current quarter. Unit root testing of the variables is the first task to be embarked upon before other tests to be followed.
5.1 Unit Root Tests
A stochastic process is said to be stationary if its mean and variance are constant over time period and the value of the covariance between the two time periods depends only on the distance or gap or lag between the two time periods and not the actual time at which the covariance is computed (Gujarati, 2004). Stationary series exhibit the mean reversion property, which means that they fluctuate around a constant long-run mean and have a finite variance that is time invariant. On the other hand, non-stationary series have no long-term mean to which series returns and the variance is time dependent and goes infinity as time approaches infinity (Enders, 2004).
There are two conventional ways of testing for unit roots, Augmented Dickey-Fuller (ADF) and Philips-Perron (PP). In this study we employ both the ADF and PP methods in testing for unit roots. In ADF and PP methods, the null hypothesis is that the time series have a unit root, that is, they are non-stationary. If the calculated test-statistics for our variables in their level forms are more negative than the critical values, the null hypothesis is rejected, suggesting that variables are stationary in their level forms, i.e. they are I(0). In case where the variable is not stationary in levels, we should investigate the stationarity in first differences. If the calculated test-statistics for our variables in their first differenced forms are more negative than the critical values, the null hypothesis can be rejected, suggesting that our variables are stationary after differencing, which is denoted as I(1). The result of Augmented Dickey-Fuller and Philips Perron (unit root) test are presented in the
28
bottom and upper panels of Tables 5.1 respectively (note that all variables, except for INF, are in natural logarithms).
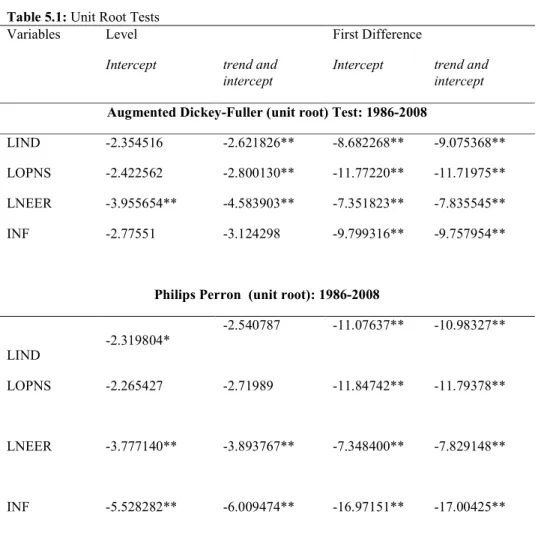
Table 5.1: Unit Root Tests
Note: The table entries are t-statistics.* and ** indicate 1% significance and 5% significance levels respectively.
The results indicated that in ADF method entire variables of industrial production, openness and inflation becomes stationary after first differencing, i.e. LIND~I(1), LOPNS~I(1), INF~I(1), except nominal effective exchange rate is stationary in level i.e. LNEER~I(0),. And In PP method also industrial production and openness becomes stationary after first differencing i.e. LIND~I(1), LOPNS~I(1). But, nominal effective exchange rate and inflation are stationary in levels i.e. LNEER~I(0), INF~I(0), respectively. The results from both tests with a trend included showed that the order of integration could change when a trend variable is included. But for us the most important thing is that all variables are stationary after first differencing in both cases (with or without a trend variable
Variables Level First Difference
Intercept trend and
intercept
Intercept trend and
intercept
Augmented Dickey-Fuller (unit root) Test: 1986-2008
LIND -2.354516 -2.621826** -8.682268** -9.075368**
LOPNS -2.422562 -2.800130** -11.77220** -11.71975**
LNEER -3.955654** -4.583903** -7.351823** -7.835545**
INF -2.77551 -3.124298 -9.799316** -9.757954**
Philips Perron (unit root): 1986-2008
LIND -2.319804* -2.540787 -11.07637** -10.98327** LOPNS -2.265427 -2.71989 -11.84742** -11.79378** LNEER -3.777140** -3.893767** -7.348400** -7.829148** INF -5.528282** -6.009474** -16.97151** -17.00425**
29
included), so none of the variables are I(2). This means that we can proceed with the bounds testing for co-integration.
5.2 Bounds Testing
When time series data are not in the same order of integration, i.e. some variables are I(0) and the others I(1) conventional co-integration tests can not be used. Therefore, we use the bounds testing approach to investigate the co-integration relationship of the variables. Initially, bounds testing was employed through the ordinary least squares (OLS) method and computed the F-statistics for the joint significance of the lagged levels of variables to compare with the critical values provided in Table of (Pesaran et-al, 2001). Bounds testing approach has some advantages over the conventional approach of co-integration models. First, the bounds testing approach can be employed irrespective of whether the regressors are purely I(0) or I(1) or fractionally integrated. Second, the bounds testing co-integration approach has superior properties in small sample sizes than other multivariate co-integration approaches. Third, the error correction model can be obtained from the ARDL through a simple linear combination that amalgamates both short-run adjustments with long-run information without losing previous information.
We follow the procedures outlined in Peseran et-al (2001) as they are implemented by the microfit software program. We start by determining the optimal number of lag length (p in equation 1). We run equation (1) several times, selecting one lag at first, and then successively increase the number of lags to four, which is where we stop since observations are quarterly. Among these we pick the one with the smallest AIC and SBC as the optimal lag length which has the absence of serial correlation as well. As the results reported in Table 5.2, revealed the optimal lag length is four. We have also reported Lagrange Multiplier (LM) test statistics for the lack of serial correlation, which show that null hypothesis of no serial correlation for the lag length of four, is not rejected.
30
Table 5.2: Optimal Lag Length Selection p AIC SBC CHSQ
1 166.3102 155.1113 12.7376 [0.013] 2 178.0326 161.9300 4.6014 [0.331] 3 174.6447 153.6845 3.0995 [0.541] 4 170.4942 144.7236 4.8671 [0.301]
Note: CHSQ is the Breusch-Godfrey serial correlation test statistic. p is the lag length. p values are in brackets.
We run equation 1 with p = 4 to do the bounds testing, then again without the once lagged level variables. This process yields the F-statistic for comparison with the critical values shown in Table 5.3. The calculated F-statistics are compared with the critical values computed by Pesaran, et-al (2001) and given in Table 5.3 in the paper. If the estimated F-statistic is higher than the upper bound of the critical values, then the null hypothesis of no co-integration is rejected. If the estimated F-statistic is lower than the bottom bound of critical values, that is, no co-integration relationship between the series null hypothesis cannot be rejected, if the calculated F-statistic is between the bottom and upper critical values, no exact opinion can be made.
Table 5.3: ARDL Bounds Test of Co-integration Asymptotic critical value bounds for the F-statistic
0.100 0.050 0.025 0.010 k I(0) I(1) I(0) I(1) I(0) I(1) I(0) I(1) 3 2.72 3.77 3.23 4.35 3.69 4.89 4.29 5.61 Computed F-statistics: 4.9448
Notes: Critical values are from Pesaran et-al (2001) Table CI(iii) Case III.
The critical values are for the case of unrestricted intercept and no trend, came from Pesaran, et-al (2001) Table CI(iii) Case III. k is the number of independent variables, which are three in our case. As shown in Table 5.3, the calculated F-statistics is 4.9448 which go beyond the upper critical value at 5% level
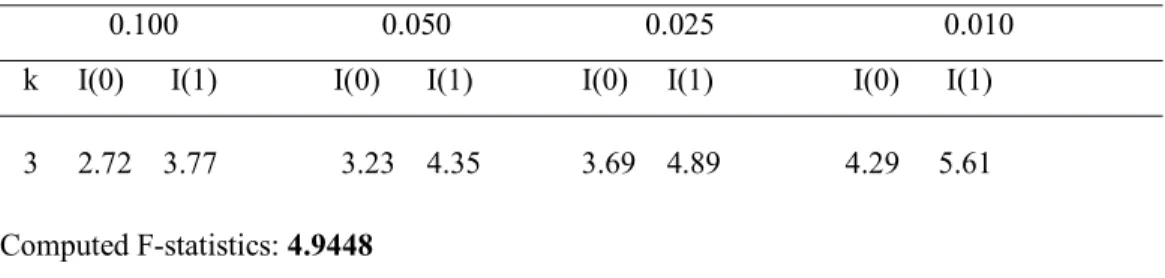
![Table 5.5: Estimated Long Run Coefficients Regressor Coefficient T-Ratio[Prob] LOPNS 0.10601](https://thumb-eu.123doks.com/thumbv2/9libnet/3772842.29362/42.918.198.780.769.901/table-estimated-long-coefficients-regressor-coefficient-ratio-lopns.webp)
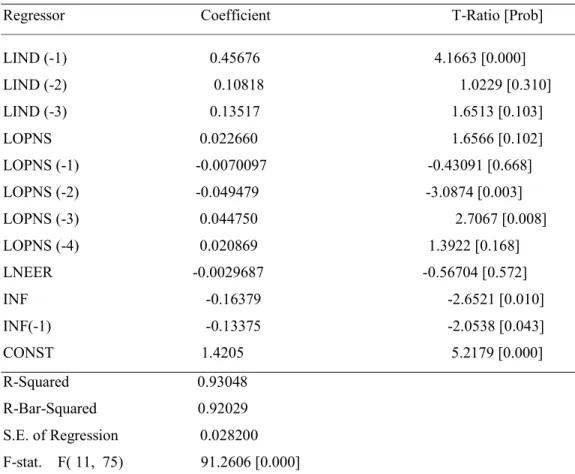
![Table 5.6: Error Correction Representation for the Selected ARDL Model Regressor Coefficient T-Ratio [Prob]](https://thumb-eu.123doks.com/thumbv2/9libnet/3772842.29362/44.918.197.788.135.947/table-error-correction-representation-selected-model-regressor-coefficient.webp)
![Table 5.7: Estimated Long Run Coefficients Regressor Coefficient T-Ratio[Prob] LOPNS 0.105](https://thumb-eu.123doks.com/thumbv2/9libnet/3772842.29362/47.918.196.785.639.776/table-estimated-long-coefficients-regressor-coefficient-ratio-lopns.webp)
![Table 5.10: Error Correction Representation for the Selected ARDL Model Regressor Coefficient T-Ratio [Prob]](https://thumb-eu.123doks.com/thumbv2/9libnet/3772842.29362/50.918.195.785.427.685/table-error-correction-representation-selected-model-regressor-coefficient.webp)
