ÇANKAYA UNIVERSITY
GRADUATE SCHOOL OF SOCIAL SCIENCES
BUSINESS ADMINISTRATION
MASTER'S THESIS
GLASS CEILING PERCEPTIONS OF PUBLIC EMPLOYEES
IRMAK YARATIM
iv ABSTRACT
GLASS CEILING PERCEPTIONS OF PUBLIC EMPLOYEES
YARATIM, Irmak
Master of Business Administration (MBA) Supervisor: Assoc. Prof. Dr. İrge ŞENER
September 2019, 147 page
The fact that a woman enters the working life is important in terms of providing her a place in social life and development of the society. However, as the results of the previous research indicate, although women are involved in work life, they do not take part in the senior management positions satisfactorily, and they perceive a glass ceiling that they cannot overcome. There are many factors which cause glass ceiling syndrome and form barriers in front of women’s advancement in organizations; and it is important for organizations to understand and solve the problems associated with it. In accordance, the aim of this study is to determine the relationship between glass ceiling barriers and glass ceiling perceptions. In this respect, a research was conducted in a public institution in Ankara with 250 participants. According to the findings of the research, endurance perceptions, which indicate the belief that women can overcome the glass ceiling when they are given the opportunity, were higher than the other dimensions which are denial, abandonment and acceptance. Significant differences between females and males, between married women and married men, between single women and single men, and according to educational level were obtained in terms of both glass ceiling perceptions and glass ceiling barriers. Furthermore, significant relations were found out between glass ceiling barriers and glass ceiling perceptions. The effect of organizational culture and policies on denial dimension represents the most significant effect according to research findings. In addition, it was found out that denial is positively affected by more barriers when compared to other dimensions. Moreover, the findings represent that individual barriers, which are multiple role asseting and personal choice and preferences; organizational barriers, which are organizational culture and policies and mentoring; and social barriers, which are professional discrimination and stereotypes, have an effect on at least one of the
v dimensions of glass ceiling perceptions. However, only informal communication and networks, which is one of the organizational barriers, does not effect any of the dimensions of glass ceiling perceptions.
Key words: glass ceiling syndrome, glass ceiling barriers, public employees, women labor force
vi ÖZET
KAMU ÇALIŞANLARININ CAM TAVAN ALGISI
YARATIM, Irmak
Yüksek Lisans, İşletme Yönetimi Danışman: Doç. Dr. İrge ŞENER
Eylül 2019, 147 sayfa
Kadının çalışma hayatına girmesi, kendileri için sosyal yaşamda bir yer oluşturma ve toplumun gelişimi bakımından önemlidir. Ancak, önceki araştırmalarda da belirtildiği üzere, kadınlar çalışma hayatına dahil olsalar bile üst düzey yönetici pozisyonlarında tatmin edici derecede yer alamamaktadırlar ve aşamayacakları bir cam tavan olduğu algısına sahiptirler. Cam tavan sendromuna neden olan ve kadınların bir örgütte ilerlemesinin önünde engeller oluşturan birçok faktör vardır. Bu durumun idrak edilmesi ve durum dolayısıyla doğabilecek problemlerin çözümlenmesi kurum açısından önemlidir. Bu çalışmanın amacı, cam tavan engelleri ile cam tavan algısı arasındaki ilişkiyi göstermektir. Bu sebeple, Ankaradaki bir kamu kuruluşunda çalışan 250 katılımcı ile bir araştırma yürülmüştür. Araştırmanın sonuçlarına göre kadınlara fırsat verildiğinde kendilerinin cam tavanı aşacağına inandığını belirten dayanıklılık boyutu, diğer boyutlar olan inkar, vazgeçme ve kabullenme boyutlarından daha yüksektir. Cam tavan algısı ve cam tavan engelleri bakımından, farklı eğitim seviyesindeki kadın ile erkek, evli kadın ile evli erkek, bekar kadın ile bekar erkeklerin bakış açıları arasında önemli farklar elde edilmiştir. Buna ek olarak, cam tavan engelleri ve cam tavan algısı arasında önemli ilişkiler tespit edilmiştir. Araştırma bulgularına göre, cam tavan engellerinden biri olan örgüt kültürünün ve kurallarının en önemli etkisi inkar boyutu üzerinde olmuştur. Buna ek olarak, diğer boyutlar ile karşılaştırıldığı zaman inkar boyutunun cam tavan engellerinden daha fazla etkilendiği tespit edilmiştir. Ayrıca bulgular, kişisel tercih ve algılardan oluşan kişisel engellerin, örgüt kültürü, kurallar ve mentorluktan oluşan örgütsel engellerin ve mesleki ayrımcılık ile toplumsal önyargılardan kaynaklanan toplumsal engellerin en az bir cam tavan algısı boyutuna etkisi olduğunu göstermektedir. Yalnızca, örgütsel engellerden biri olan biçimsel olmayan iletişim ağlarına katılım boyutunun cam tavan algısı boyutlarından herhangi birine etkisi bulunmamaktadır.
vii Anahtar Sözcükler: cam tavan sendromu, cam tavan engelleri, kamu personeli, kadın işgücü
viii ACKNOWLEDGEMENTS
I would like to express my gratitude to Associate Professor Dr. İrge ŞENER, my esteemed thesis advisor, who has encouraged me throughout my thesis work, who has guided, supported me at all stages of my thesis.
I would like to thank my dear friends Tutku Buse ÇINAR and Seda KARABOĞAZ for my motivation throughout my work, as well as my beloved mother Deniz UYANIK who has always been with me at all stages of my thesis and has always been on my side.
I would also like to thank my esteemed professors at Çankaya University for their knowledge and experience throughout my education and for providing me with new values.
ix TABLE OF CONTENTS
COVER PAGE AND TITLE PAGE. ...i
APPROVAL PAGE...ii PLAGARISM PAGE...iii ÖZET...iv ABSTRACT...v ACKNOWLEDGEMENTS...vi CONTENTS... ..vii
LIST OF TABLES ... xii
LIST OF FIGURES ... xv
CHAPTER I ... 1
INTRODUCTION ... 1
CHAPTER II ... 4
WOMEN LABOR FORCE PARTICIPATION ... 4
2.1. Development of Female Labor Force in the World ... 6
2.1.1. Female Labor Force before Industrial Revolution ... 6
2.1.2. Female Labor Force after Industrial Revolution ... 8
2.1.3. Women Labor Force during the Globalization Period ... 9
2.2. Female Labour Force in Turkey ... 11
2.2.1. Female Labor Force during Ottoman Period ... 11
2.2.2. Female Labor Force in the Republican Period ... 14
2.2.3. Female Labor Force in Turkey during the Globalization Period ... 18
2.3. Concept of Employment ... 20
2.4. The Distribution of Employment of Women in Selected Occupational Groups in Turkey ... 22
CHAPTER III ... 32
GLASS CEILING SYNDROME ... 32
3.1. Historical Development of Glass Ceiling Concept ... 32
x
3.3. Concepts Related to the Term: Glass Ceiling ... 37
3.4. The Reasons for the Glass Ceiling Impeding Working Women ... 39
3.4.1. Causes Stemming from Individual Factors ... 40
3.4.2. Causes Stemming from Organizational Factors ... 42
3.4.3. Causes Stemming from Social Factors ... 50
3.5. Strategies to Overcome Glass Ceiling ... 52
3.5.1. Individual Strategies ... 52
3.5.2. Organizational Strategies ... 57
3.6. Results of Glass Ceiling Obstacles ... 63
3.6.1. Individual Results of Glass Ceiling Obstacles ... 63
3.6.2. Organizational Results of Glass Ceiling Obstacles ... 67
3.7. Some of the Studies Conducted in Turkey about Glass Ceiling ... 70
CHAPTER III ... 75
AN APPLIED RESEARCH ON GLASS CEILING SYNDROME ... 75
4.1. Purpose and Importance of Research ... 75
4.2. Research Model and Hypotheses ... 76
4.3. Research Sample ... 79
4.4. Research Method ... 80
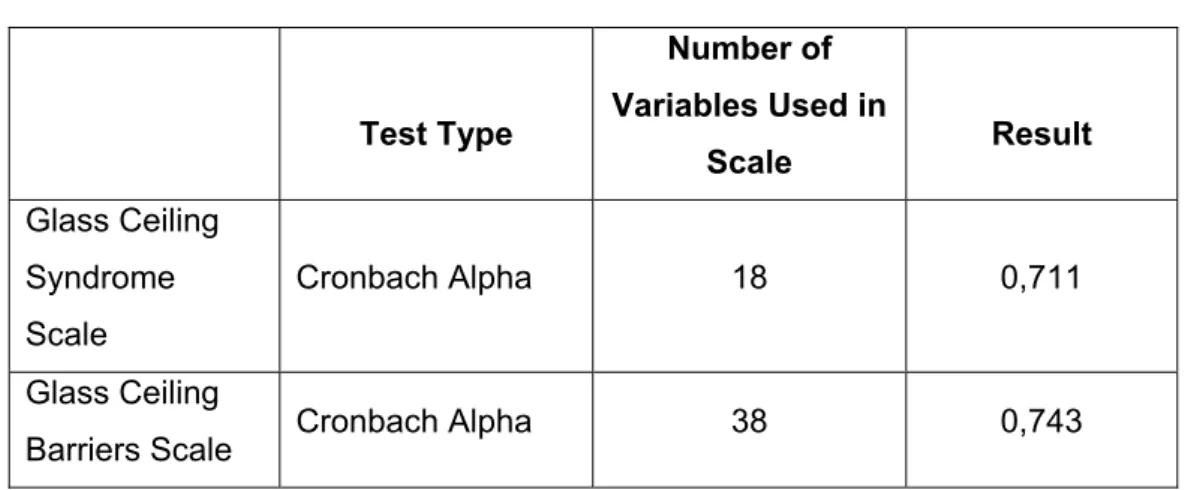
4.5. Reliability of the Measurement Tool ... 82
4.6. Demographic Characteristics of Participants ... 83
4.7. Perception of Glass Ceiling Syndrome ... 84
4.8. Differences of Glass Ceiling Perceptions according to Demographic Variables ... 87
4.9. Perception of Glass Ceiling Barriers ... 90
4.10. Differences of Perceptions of Glass Ceiling Barriers according to Demographic Variables ... 95
4.11. Testing of Hypotheses ... 100
4.1.1.1 Regression Analysis ... 100
CHAPTER IV ... 114
xi REFERENCES ... 121 APPENDIX ... 130 QUESTIONNAIRE (in Turkish) ... 130
xii LIST OF TABLES
Table 1. Women's Labor Force Participation Rates in Turkey ... 16
Table 2. Labor Force Participation Rates between 1970 and 1990 ... 17
Table 3. Number of ministers by gender, 1980-2018 ... 27
Table 4. Concepts Related to the Term: Glass Ceiling ... 37
Table 5. Research Hypotheses ... 78
Table 6.Scale Reliability Analysis ... 83
Table 7.Distribution of Participants according to Demographic Characteristics ………..83
Table 8. Evaluation Range of Arithmetic Means According to 5-Point Likert Scale ... 84
Table 9.Perceptions of Denial ... 85
Table 10.Perceptions of Endurance ... 85
Table 11.Perceptions of Abandonment ... 86
Table 12.Perceptions of Acceptance ... 86
Table 13. Independent Sample T Test Results of Glass Ceiling Perceptions for Gender Variable ... 87
Table 14.Independent Sample T Test Results of Glass Ceiling Perceptions for Marital Status Variable by gender (married) ... 88
Table 15. Independent Sample T Test Results of Glass Ceiling Perceptions for Marital Status Variable by gender (Single) ... 88
Table 16.Variance Analysis of Glass Ceiling Perceptions According to Educational Level ... 89
Table 17.Variance Analysis of Glass Ceiling Perceptions According to Age .. 90
Table 18. Evaluation Range of Arithmetic Means According to 5-Point Likert Scale ... 91
Table 19. Perception of Glass Ceiling Barriers (MULTIPLE ROLE ASSETING)……….91
Table 20. Perception of Glass Ceiling Barriers (WOMEN'S PERSONAL CHOICE AND PERCEPTION) ... 92
Table 21.Perception of Glass Ceiling Barriers (ORGANIZATIONAL CULTURE AND POLICIES) ... 92
xiii Table 22.Perception of Glass Ceiling Barriers (INFORMAL COMMUNICATION
NETWORKS) ... 93
Table 23.Perception of Glass Ceiling Barriers (MENTORING) ... 93
Table 24.Perception of Glass Ceiling Barriers (PROFESSIONAL DISCRIMINATION) ... 94
Table 25.Perception of Glass Ceiling Barriers (STEREOTYPES) ... 94
Table 26.Independent Sample T Test Results of Perceptions of Glass Ceiling Barriers for Gender Variable ... 95
Table 27.Variance Analysis Results of Perceptions of Glass Ceiling Barriers According to Educational Variables ... 96
Table 28.Variance Analysis of Perceptions of Glass Ceiling Barriers according to Age ... 98
Table 29.Independent Sample T Test Results of Perceptions of Glass Ceiling Barriers according to Marital Status Variable by gender (Married) ... 99
Table 30.Independent Sample T Test Results of Perceptions of Glass Ceiling Barriers according to Marital Status Variable by gender (Single) ... 100
Table 31.Regression Analysis Results for Hypotheses H1a ... 101
Table 32.Regression Analysis Results for Hypotheses H1b ... 101
Table 33. Regression Analysis Results for Hypotheses H1c ... 102
Table 34. Regression Analysis Results for Hypotheses H1d ... 102
Table 35. Regression Analysis Results for Hypotheses H2a ... 103
Table 36. Regression Analysis Results for Hypotheses H2b ... 103
Table 37. Regression Analysis Results for Hypotheses H2c ... 104
Table 38. Regression Analysis Results for Hypotheses H2d ... 104
Table 39. Regression Analysis Results for Hypotheses H3a ... 105
Table 40. Regression Analysis Results for Hypotheses H3b ... 105
Table 41. Regresion Analysis Results for Hypotheses H3c ... 106
Table 42. Regression Analysis Results for Hypotheses H3d ... 106
Table 43. Regression Analysis Results for Hypotheses H4a ... 107
Table 44. Regression Analysis Results for Hypotheses H4b ... 107
Table 45. Regression Analysis Results for Hypotheses H4c ... 108
Table 46. Regression Analysis Results for Hypotheses H4d ... 108
Table 47. Regression Analysis Results for Hypotheses H5a ... 108
Table 48. Regression Analysis Results for Hypotheses H5b ... 109
Table 49. Regression Analysis Results for Hypotheses H5c ... 109
Table 50. Regression Analysis Results for Hypotheses H5d ... 110
xiv
Table 52. Regression Analysis Results for Hypotheses H6b ... 110
Table 53. Regression Analysis Results for Hypotheses H6c ... 111
Table 54. Regression Analysis Results for Hypotheses H6d ... 111
Table 55. Regression Analysis Results for Hypotheses H7a ... 112
Table 56. Regression Analysis Results for Hypotheses H7b ... 112
Table 57. Regression Analysis Results for Hypotheses H7c ... 113
Table 58. Regression Analysis Results for Hypotheses H7d ... 113
Table 59. The Effect of Glass Ceiling Barriers on Glass Ceiling Perceptions ………113
xv LIST OF FIGURES
Figure 1. Labor Force Structure in Developed Countries:
Labor Force Participation Rate, Female (% 15+ age female populations) ... 11
Figure 2. Labor force participation rates of males between 1996 and 2018 (% of male population ages 15+) ... 19
Figure 3. Labor force participation rates of females between 1996 and 2018 (% of female population ages 15+) ... 19
Figure 4. Percentage distribution of female employment in terms of economic activities between 2007-2018 ... 22
Figure 5.Females' share of managerial positions, 2012-2018 ... 23
Figure 6. Percentage of teachers by level of education, 2016-2017 ... 24
Figure 7.Percentage of the Rectors of Universities by Gender, 2018 ... 24
Figure 8. Percentage of teaching staff by academic title, 2018/2019 ... 25
Figure 9. Number of police by gender, and gender ratio, 2007-2018 ... 26
Figure 10. Female representation rate in the Assembly by the election year, 1935-2018 ... 27
Figure 11. Percentage of Judges by gender, 2006-2018 ... 28
Figure 12. Distribution of staff working for newspapers and magazines by gender (publishing department) ... 29
Figure 13. Distribution of staff working for newspapers and magazines by gender (printing and distribution department) ... 30
Figure 14. Percentage of ambassadors by gender, 2000-2018 ... 31
Figure 15. Distribution of Public Servants according to Gender ... 76
xvi LIST OF ABBREVATIONS
EU: European Union
ILO: International Labor Organization
OECD: Organization for Economic Co-operation and Development TurkStat: Turkish Statistical Institute
1 CHAPTER I
INTRODUCTION
Since the 20th century, women have entered the business world intensively. Women's existence in business life has brought some changes and women have taken their place in many professions. The number of working women and the rate of women in the business world are gradually increasing, but the number of women among senior managers and leaders is not still at the desired level. Low levels of women at the top management level exists both in the developed and developing countries. Also, in Turkey, the number of women in managerial positions is quite low compared to men.
In the literature, there are many different situations that explain the reasons why women cannot rise to senior management positions in organizations. One of these obstacles is the glass ceiling concept which is regarded as an invisible obstacle that prevents women from becoming senior managers. Glass ceiling has individual and organizational consequences. Individual factors consist of loss of motivation, low levels of commitment to organization and job satisfaction, and job alienation; whereas, increase in costs and absenteeism, employee turnover and productivity reduction are among the organizational consequences.
There exist many barriers in front of women's advancement in organization. Gender-based glass ceiling barriers are classified differently, in international and national literature. When the glass ceiling in organizations is approached with a holistic perspective, it is explained that the causes of it are individual, organizational and social factors. Accordingly, women's multiple roles and personal preferences and perceptions constitute barriers arising from individual factors. Organizational culture and policies, lack of mentors and inability to participate in communication networks are examined as barriers arising from organizational factors. Finally, it is suggested that the barriers arising from social factors constitute professional discrimination and stereotypes.
2 On the other hand, perceptions about glass ceiling syndrome is evaluated in many different ways in the literature. One of those is about women’s perceptions about their career pathways. According to the career pathways defined by Smith et al (2012; as cited by Sarıoğlu, 2018) glass ceiling syndrome has four dimensions that are denial, endurance, abandonment and acceptance. Denial is considered to be about the view that women reject the difficulties they face in business life. The endurance dimension of the glass ceiling is the belief that women can do great things if they are given the opportunity and come to the leading positions. The dimension of abandonment suggests, beliefs of women that they can have more difficulty in business life than men and loose their self-confidence more quickly. The dimension of acceptance represents the beliefs of women who balance their lives rather than dealing with career planning.
In order to prevent glass ceiling syndrome and its consequences, it is important to understand which of the barriers related to glass ceiling causes denial, endurance, abandonment and acceptance. Within this frame, the aim of the research is to examine the relation of glass ceiling perceptions with the factors that arise as barriers for advancement of women. In order to achieve this target, research was conducted with 250 public employees, and perceptions of both female and male employees were determined. According to December 2018 data of State Personnel Presidency, the total number of people working in the public sector is 3.487.396, which constitutes the majority of the employees. 61,52% of the people working in the public sector consist of men, while 38,48% is composed of women. However, the rate of female managers working in the public sector is only 14,8% and this ratio is quite low, which indicates the importance and the necessity of research conducted in this area.
This study about the relation of glass ceiling barriers and glass ceiling syndrome is conducted in a public institution and it consists of four parts. The first chapter consists of introductory information. In the second chapter, to explain the place of women in the business world, the position of women in the business world were examined separately, both the situation in world and Turkey.In this respect, the forms of appearance of female labor force are examined and the concepts about labor force are discussed. In addition, employment rates of women according to some occupational groups are examined.
In the third part of the study, the concept of glass ceiling is discussed based on various definitions and research in the literature. In this respect, the factors that reveal the glass ceiling and the individual and organizational strategies that can be
3 used to overcome the glass ceiling are mentioned. At the end of the chapter, the results of the glass ceiling for individuals and organizations are discussed.
In the fourth section; the findings from the applied questionnaire is analyzed in order to identify the problems and obstacles in the context of glass ceiling based on the theoretical section. In this context, the perception of the employees in a public institution about glass ceiling syndrome and their perceptions towards glass ceiling barriers and the relationship between these two concepts are evaluated by statistical analysis. To investigate the research questions, quantitative research design has been preferred. In this section, findings related to demographic characteristics, validity and reliability of the research, means, factor analysis and difference tests are conducted. In the final section, findings from the analysis are discussed and suggestions are presented.
4 CHAPTER II
WOMEN LABOR FORCE PARTICIPATION
Labor force consisting of all economically-active population contributes to economic development of countries. Labour force according to International Labour Office (ILO, 1988) is “the sum of persons in employment plus persons in unemployment. Together these two groups of the population represent the current supply of labour for the production of goods and services taking place in a country through market transactions in exchange for remuneration” (https://www.ilo.org). The labour force participation rate is expressed according to Turkish Statistical Institute (2019) as “the ratio of labour force to non-institutional working age population” (http://www.TurkStat.gov.tr).
Women's involvement in business life is an important element of social development. In terms of social development, the increase in female labor force participation and employment creates a sustainable impact (Değer, 2016:5). The composition of socio-cultural and macroeconomic factors that determine labor supply and demand is reflected in the labor force participation rates of women in a country. Socio-cultural factors, such as patriarchal mentalities that dominate society and the family, can prevent women's access to employment and lead to a reduction in female labor supply (Kılınç, 2015:127). Women's labor force refers to women who are currently employed, and unemployed but seeking employment. The ratio of female labor force to female population indicates the female labor force participation rate (Güner, 2010:11).
When the labor force status of the population in Turkey in the year 2018 is considered, it can easily be noticed that the population aged 15 and over was 60 million 654 thousand people. Women aged 15 and over was 30 million 647 thousand and women's labor force participation rate was 34,2% (TurkStat, Labour Force Statistics, 2018).The labor force participation rate among women in Turkey is far behind the average of EU and OECD countries. According to TurkStat 2018
5 data, when female labor participation rate were analyzed, the country with the highest labor force participation among the 28 EU member states is Sweden with 61,1%. This rate is followed by Denmark with 58% and Greek Cypriot Administration of Southern Cyprus with 57,2%, respectively. The countries with the lowest female labor force participation rates are Italy with 40%, Malta with 43,3% and Greece with 45,3%.
A similar situation is valid for OECD countries. Among the 35 OECD countries, the country with highest female labor force is Iceland with 72,1%, followed by New Zealand with 64,6% and Switzerland with 62,6%, respectively. While the labor force participation rate of women in Mexico is 43,8%, this rate is 40% in Italy. When the rate of female labor force participation in Turkey in 2018 is taken into consideration, it can be concluded that Turkey is far behind all of these countries with %34,2 (TurkStat, 2018).
There are many factors affecting the female labor force participation rate. Economic, social and demographic factors are some factors that prevent women from joining the labor force. Low education and skill level and employment in unqualified jobs are among the economic reasons. Among the social causes are women's roles in some fields such as motherhood, child care and domestic work, as well as gender discrimination and community pressure. Finally, migration from village to city and marriage can be grouped as demographic factors (Kılınç, 2015: 128-129).
According to TurkStat 2004-2018 labour force statistics, factors such as, not seeking a job but being available to start, working seasonally, being a housewife, having education, being retired, being disabled are reasons why women do not participate in labour force. According to TurkStat (2018) data, the significant reason why women do not participate in the labor force is due to being a housewife. This rate was 54,8% in 2018. 13,4% of women cannot even be included in the labor force due to illness or being senile. Owing to their education, 11,5% of women were not included in the labor force. Women who were available for a job but were not looking for one were also not included in the labor force with a rate of 1,2%. Finally, 5,6% of women were not included in the labor force due to retirement (TurkStat, Labour Force Statistics, 2004-2018).
6 2.1. Development of Female Labor Force in the World
In this section, female labor force participation in the world is discussed under three titles.
2.1.1. Female Labor Force before Industrial Revolution
Women's positions before the industrial revolution can be examined in three parts as primitive period, slave and feudal period and finally, feudalism, bourgeoisie period.
In the primitive period, there was a classless and non-exploitable society. In this society, the biological differences between women and men were more prominent (Çullu, 2009:22). When the phenomenon of employment in primitive societies is examined, it can be realized that there were some processes of exploring nature (Ören and Yüksel, 2012:44). In primitive societies, people had a nomadic lifestyle; men were engaged in hunting and gathering, and women were engaged in child care and plant gathering.
When the anthropological studies are examined, it is seen that societies known as matriarchal were dominated by the authority and control of women in primitive times. In these matriarchal societies, the aim of the system is to ensure a continuous solidarity within the women's work group. Since women's labor force was important in these societies, a matriarchal culture was formed and women were kept superior (Gülbay, 2012:7-8; Doğan, 2014:5). The reason for the high status of women is due to the direct participation of women in productive activities. During this period, men devoted their time to hunting and fighting, while women developed many tools (Çullu, 2009: 23).
In the matriarchal order, the woman who had the right to produce was the guide and manager within the organization which had blood connection with her. Since the way in which women in this sort of society were involved in production were restricted to working in the house and in the field. Therefore, women have exchanged carpets and cover with others. In other words, both the agricultural work and the primitive industrial labor and trade were opened to the world (Zeybek, 2010:.12; Dalkıranoğlu, 2006:8).
7 With the transition from matriarchal order to patriarchal order, the emergence of property and the transition from hunting to agricultural society are known to have important effects. The adoption of the established way of life of the society led to radical changes in the economic, political and social structure. The establishment of new settlements revealed the economy of change and initiated trade. In this process, with the development of the means of production, agricultural activities began to develop and new business lines such as mining and fishing emerged (Altan, 2004: 243). In this period, with the development of the means of production, women and the elderly were withdrawn from the production and as a result of this; the place of women in the society began to change (Dalkıranoğlu, 2006: 9).
In the society, a woman was first considered to be an individual for her house and her family. For this reason, work groups belonging to men and women were formed in the society. This understanding forced women to work only in areas where women's labor was needed. In the patriarchal society; women could not find a place in all areas (Duruoğlu, 2007: 62). During this period, women withdrew from active production processes and started to deal with traditional housework such as preparation of food, child care and cleaning, and as a result in family and community life, a gender-based division of labor started. As a result of the active removal of women from the production, the gap between men and women has deepened (Dalkıranoğlu, 2006: 9).
Social scientists refer to the period between the first ages and the tenth century as the period of slavery and captivity. In this order where patriarchal family structure was dominant, the labor force requirement of the society was provided by the slaves. Most of these slaves were women and in this period, male and female slaves were used in production without any discrimination (Dalkıranoğlu, 2006: 9). Since female slaves performed at the same rate as male slaves, there was no distinction between male and female slaves in terms of their contribution to production. However, sexual exploitation of women slaves became the most prominent indicator of gender inequality in this period (Mayatürk, 2006: 52).
The system of slavery was later replaced by feudal period. Production and trade in the countryside took place in the lands dominated by the feudal lords or by the seigniors; and in the cities, it was realized through guilds formed by various artisans. During this period, women were used intensively in agricultural activities, especially in rural areas. In addition, women and girls were initially employed free of charge as servants in homes (Dalkıranoğlu, 2006: 9).
8 2.1.2. Female Labor Force after Industrial Revolution
The 18th century is considered by many researchers and authors as the most
prominent century in history with major changes. One of the most important developments in this century is the Industrial Revolution in which women participated in business life. For the first time, with the Industrial Revolution, women began to earn their own living for a wage in the economic field. In this period, women started to work in the status of wage earners and workers. For this reason, the Industrial Revolution is considered to be the most important historical development that led to the emergence of the concept of ‘wage labor’ for women for the first time (Kocacık and Gökkaya, 2005: 197).
The process called the Industrial Revolution; first started with the invention of the spinning wheel machine. After the invention of the steam engine by James Watt in 1782, it showed a spread to other sectors and countries, mainly to iron and steel production. With the mass production that started in the European industry, there have been revolutionary developments in agriculture and the women labor migrated to the city and started to join the labor markets as labor force (Özer and Biçerli, 2003-2004: 57). With the Industrial Revolution, women started to work in non-agricultural areas for wages as well. In this period, the technical developments and the formation of the division of labor with the invention of machines that simplified the production increased the need for women labor (Dalkıranoğlu, 2006, p.12).
In the first period of industrialization, women were employed in textile industry for twelve hours a day with low wages. In this period, the percentage of women working in the manufacturing industry in the UK increased from 35% in 1841 to 45% in 1851. Again in this period, almost 40% of the female labor force worked as cleaners in the service sector. Changes in industrialization and women's employment in the UK have also affected other European countries, especially France (Özer and Biçerli, 2004: 57). The impact of the Industrial Revolution on women's employment also led to some changes in the United States. Industrial Revolution allowed women in the United States to work in the industrial sector. Before the revolution, women could only find employment in the agricultural sector as unpaid family workers (Özer and Biçerli, 2003-2004: 57). While the proportion of women working in the industrial sector in the northeast of the country was 9% in 1820, this rate increased to 33% in 1932. With the development of industry, the number of firms increased and the scales of firms grew. By virtue of these developments, women employment was not only limited to the manufacturing
9 industry, but also it provided a lot of women to have the opportunity to work in secretarial, accountancy and clerical services (Costa, 2000: 10-11).
In the years following the Industrial Revolution, the number of women's labor force increased rapidly in parallel with the developments in the weaving sector. In this case, the machinery which simplified the production technique and the division of labor and the specialization, made it easier to benefit from women's labor. Thus, women's power in the weaving industry was more successful than men's. On the other hand, a solid understanding of liberal economics was expressed by the slogan "Let them do it, let them pass!", and this situation led to the fact that wages of women's labor were much lower than men. In short, it can be said that the women labor force was exposed to intense exploitation during the manufacturing process. However, starting from the mid of the 19th century, especially in the Western
countries where the Industrial Revolution took place, the understanding of the status of liberal state was transformed into state of mixer-interventionist and participatory state. With this change, the negative conditions that women had been exposed to in working life were gradually removed. As a matter of fact, in this period, the limitation of working hours in the Western countries by laws, the prohibition of the work of women in some workplaces and businesses and protective legal policies were implemented (Kocacık and Gökkaya, 2005: 197-198).
It can be noticed that during World War II, parallel to the development in the service sector, the number of women participating in the labor force increased rapidly. In the same period, as in World War I, the male labor force that went to war in this period was replaced by women. In this period, married women also participated in the labor force. The participation of men in the war ensured that women became the head of the family (Çullu, 2009: 29).
2.1.3. Women Labor Force during the Globalization Period
The increasing division of labor and international importance, the expansion of new technologies, the rapid development of the service sector can be regarded as some significant events that emerged in the last decades. These changes led to an increase in employment rate. However, it is also a fact that the number of labor force and labor force structure also increased. Among these structural changes, labor characteristics of women are remarkable. It is possible to realize the effects of these
10 changes in the business life, international division of labor, in the sub-cultures and household relations between men and women (Kocacık and Gökkaya, 2005: 199).
From the 1970s onwards, the periodic crises and developments in the world economy necessitated the restructuring of the economy. As a result of these, different theses about economic and social dimensions have been put forward. All these developments, efforts and innovations brought about by globalization have led to great steps in the employment of female labor force. While the globalization process has affected the entire world in every field, it has deeply affected the business life and the employees. While globalization has produced positive results in developed countries, which have completed industrialization, it has deepened and diversified the problems in the countries that have not achieved industrialization. (Kocacık and Gökkaya, 2005: 199-200). Globalization has enabled the production to be flexible in terms of female labor force; which provided a flexible, part-time work for them. With part-time employment, women had the opportunity to work in the labor market without abandoning their family responsibilities. This new system provided an important opportunity for women who could not participate in the labor market due to their family responsibilities (Özer and Biçerli, 2003: 59).
In the process of globalization; the industrial revolution, which began in the 18th century and covered the 19th century, not only provided new inventions and
increased production, but also helped the institutionalization of capitalism (Güleç, 2015: 6). As a result of the technological developments in this process, the emergence of new areas, new methods and production processes in the organization of work has created new job opportunities for women. Likewise, increased educational opportunities, demographic developments, shrinkage of the family size, decrease in marriage rate, improvements in child care and other services played an important role in increasing the number of female labor force (Karaca, 2007: 15).
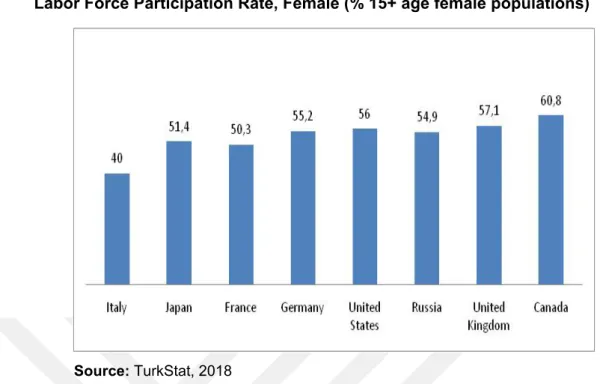
In recent years, the labor force participation rates of women in developed countries have been increasing significantly (Berber and Eser, 2008: 4) According to 2018 data of TurkStat, when the labor force structure of the developed countries is evaluated, it can be easily noticed that the female labor force participation rate is highest in Canada with 60,8% and lowest in Italy with 40% (Figure 1).
11
Figure 1. Labor Force Structure in Developed Countries: Labor Force Participation Rate, Female (% 15+ age female populations)
Source:TurkStat, 2018
In this long period of time, which was analyzed from the primitive times to the present day, the devaluation of women's labor, both in social life and in the labor markets, has been observed, depending on the economic conditions. Women, who endeavored to meet the basic needs for themselves and their families to work against the hard working conditions, were sometimes unable to go beyond a partial improvement, although they sometimes engaged in activities to improve this order (Kaya, 2009: 31).
2.2. Female Labour Force in Turkey
In this section, female labor force during the Ottoman, Republican and globalization periods is discussed.
2.2.1. Female Labor Force during Ottoman Period
Before the Republican period, in the Ottoman Empire, the greatest duty of women was accepted as maternity and this perspective was preserved for a considerably long time. When we analyze the women in the Ottoman period, it is observed that women were kept in the framework of social traditions and customs and contributed to the livelihood of the family at home (Zeybek, 2010: 17). In the
12 Ottoman period, women represented a great workforce as the members of the family who had jobs in the rural areas and as agricultural laborers within the scope of their daily work. In addition to this, women also contributed greatly to domestic consumption which is described as "home industry" including the processes of spinning, carpeting and weaving. On the other hand, women also contributed to production in non-agricultural activities like producing for the market. In addition, in urban areas, production activities were controlled by merchandising organizations and women's labor was generally left out of these organizations. Women who were not included in merchandising organizations provided yarn, wool and similar materials for men (Karaca, 2007: 17). During this period, women had no opportunity for education. They were merely able to go to the Sıbyan schools, which offered only religious education (Ak, 2006: 48).
Economic life during the Ottoman Empire until the beginning of the 19th century
was based on agriculture, animal husbandry, trade, hand-made and home arts. Women started to work for wages in some traditional industries such as weaving, mining, war industry (Çullu, 2009: 50). During the Ottoman period, the most significant developments in women's attending in business life occurred during the Tanzimat and the Constitutional Era (Karaca, 2007: 18). The liberation of women in Turkey and strides towards gaining rights to many subjects showed a parallel development with Westernization and Turkish nationalism. The Tanzimat and Constitutional Monarchy periods changed the positions of women in the Ottoman Empire (Çullu, 2009: 49).
The social status of women was discussed in the official dimension with the 1839 Tanzimat Decree. Together with this decree, women had some rights and their positions were gradually debated. After the Tanzimat movement; it was not possible for the Ottoman society to remain insensitive to the process of industrialization, which began in Western societies. This westernization movement, which started in the Ottoman Empire, was significant for women. In 1847, the slavery and concubine were abolished; and in 1857, it was concluded that the inheritance of girls and boys was brought to an equal position (Çakmak, 2001: 41). With the Tanzimat, new educational institutions were opened for women in order for them to have a profession. “The School of Midwives” in 1842, "Ina's Industrial School” in 1869 and “The School of Girls Teacher” in 1870 began education. (Karaca, 2007: 18). All these education and employment opportunities increased the education levels of women. Therefore, it was also possible for them to take a bigger step in business life due to their education in later periods (Ak, 2006:48).
13 In the Second Constitutional period, a university was opened with the name of Inas Darülfünunu. The upper class and those who lived in big cities could benefit from these modern institutions. Nevertheless, only a few literate women contributed to the change in the status of the Ottoman women (Çakmak, 2001: 41). It was also during this period that women took their first steps to have higher education. Nursing education as vocational training started in the Constitutional period. In 1922, the view supporting the education of female students in medical faculties was accepted (Karaca, 2007: 18-19). In the Constitutional period, the economic crisis and the ongoing wars created employment opportunities for women due to the fact that the male population went to military service. However, these developments occurred mostly in cities. In Anatolia, women had always been within economic life as unpaid family workers in the traditional mode of production. During the Balkan wars, men went to the frontline, and women were placed in civil service, post offices and telegraphy houses, in hospitals as nurses and in the army. Officers, workers, tradesmen and merchants took their places in economic life in this period. The state also supported women in economic life (Ak, 2006: 52).
The Ottoman Empire, which entered into a new and different civilization with the Tanzimat Decree announced in 1839, started to make changes in social, political and many other fields. In this transition period, women were able to benefit from these changes and innovations. From this period on, the limited life of women in the house began to change and a new image of women began to form. In the historical process; changes that began with Tanzimat in the social life of women and the movement of change in the rights of women, especially during the Constitutional Era, laid the groundwork for the rights granted to women in the Republic period (Ağlı and Tor, 2016: 76).
With the development of industrialization efforts in the country, the participation of women in employment was balanced, and after 1850, women started to work intensively especially in textile workplaces. In those years, there were carpet workshops operated by Europeans, most of these stalls were in İzmir and Uşak and 3.000 women were employed. In 1913 and 1915, the first industrial forecast was made and the results showed that the number of working women increased. Accordingly, one third of the employees were women and most of these women worked in weaving industries (Çullu, 2009: 51, 52). Besides the cheapness of women's labor, the labor force requirements of the Balkan Wars and World War I increased the demand for women's labor force because of men being in the military
14 service. Even during World War I, women were recruited as civil servants and officers, and were used in military back services like tailoring (Önder, 2013: 38-39).
The First World War also led to compulsory changes in the social structure of our country. Muslim women in the Ottoman Empire also started to work in different fields. As a result of the efforts of Enver Pasha and his wife, an organization called Cemiyet-i Islamiye was established in 1916. The organization, which was established to bring more women into employment in diverse areas, received intense interest, and 14.000 women applied for work in two and a half months. The number of women who were employed in a year reached 8.860 (Mardin, 2000: 6). From the 19th century onwards, the scarcity of the male labor force created by the
war environment in the Ottoman Empire and the low wage policies towards women were the most important reasons for the increase of female labor force during this period. Men's participation in the war led to a limited supply of labor.. As a result, Ottoman women had to be included in work life. In this period, from factories to workshops, from road construction to street cleaning, many female workers started to be employed (Güldal, 2006:17-19).
The defeat of the Ottomans in the First World War and the War of Independence, which began later, allowed women to change their legal status in their real lives. Due to the war environment, the fact that the majority of the male population had to go to the fronts created huge gaps in the labor market and this gap in the labor market was tried to be closed with women. The necessity and significancy for the employment of female civil servants was also realized in this period. Especially, the decrease in thenumber of male workers due to the economic crisis and the war accelerated the recruitment of women workers (Özer and Biçerli, 2003-2004: 58).
2.2.2. Female Labor Force in the Republican Period
In 1923, when the Republic was proclaimed, radical changes were made in many areas by Atatürk's leadership. In this period, there were significant changes for women and women labor force. Women's participation in the labor force started with the necessity of reinforcing the labor force as a result of the participation of most of the men in the 1915 Balkan War. Participation of women in the labor force increased during the First and Second World Wars and the Independence War.
15 However, with the demobilization of men after the war, most of women returned to traditional household chores (Mardin, 2000: 14).
On 23th April 1920, the Grand National Assembly of Turkey was opened in
Ankara. On 29 October 1923 the Republic was accepted as the governing form of the new state. With the innovations brought by the Republic on women's rights, the status of women was expanded. In this process, the gains of women also improved in education, economic and political life. When compared with the pre-republic period, a more planned, programmed and radical Westernization process started with the economic, political and social reforms that started in 1923 (Ak, 2006: 54). With Atatürk's revolutions, the social conditions of women underwent a significant change and development during the Republic period. The equality of women and men in front of law was realized and appreciated to a great extent. Women gained the right to divorce, and the rights for election, education, choice of profession and public office. The most serious breakthroughs in all sectors which constituted a truly modern society were realized in this period (Sağ, 2001: 18).
The representatives who participated to the first Economics Congress held in İzmir in 1923 on behalf of women workers decided to issue a law proposal on the way of granting paid leave for eight weeks and also three days before and after the birth in order to protect the workers. This arrangement was a remarkable development in the name of women and for protecting the rights of women workers (Büyükyaprak, 2015: 27). Tevhid-i Tedrisat Law was enacted on March 3, 1924, and the education system was laicised, and thus, girls and boys had equal education opportunities. The Law of Disguise, adopted in 1925, paved the way for modern clothing for women (Karaca, 2007: 19-20). With the Civil Code adopted on the 4th of
October, 1926, the privileges granted to men were abolished and a balance was struck between the rights of women and men. With the Turkish Civil Code, polygamy was abolished, equal rights were granted to men and women during divorce, equal rights were granted in the utilization of heritage, and an age limit was set for marriage. In courts, the witnesses of men and women were equalized, and, most importantly, the principle of equality between men and women was adopted as a basic principle. The Civil Code changed the shape of Turkish family life and had a great impact on our social structure. The new rights and changes in the status of Turkish women changed its structure and increased their effectiveness in social life (Ak, 2006: 54-55). In the National Assembly elections of 1934, women were granted the right to vote and to be elected. Thus, this abolished all legal restrictions on gender in the political sphere. As a result, in 1935, 18 (4,6%) women entered the
16 parliament in the first parliamentary elections. With the Labor Law in 1936, the new regulations made in working life increased the proportion of working women (Karaca, 2007: 20).
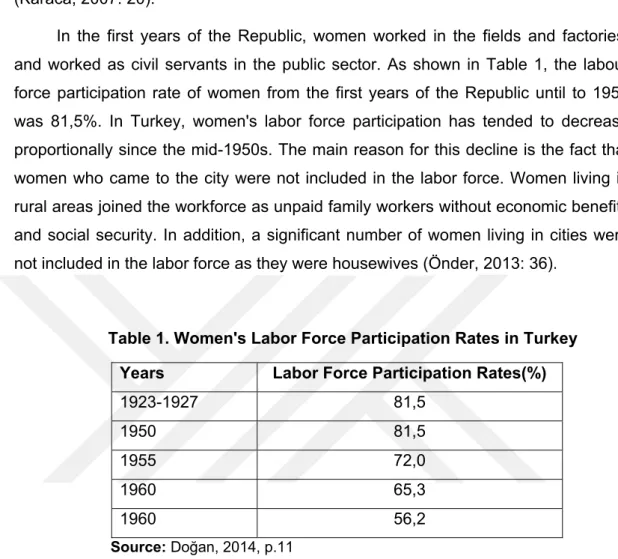
In the first years of the Republic, women worked in the fields and factories, and worked as civil servants in the public sector. As shown in Table 1, the labour force participation rate of women from the first years of the Republic until to 1950 was 81,5%. In Turkey, women's labor force participation has tended to decrease proportionally since the mid-1950s. The main reason for this decline is the fact that women who came to the city were not included in the labor force. Women living in rural areas joined the workforce as unpaid family workers without economic benefits and social security. In addition, a significant number of women living in cities were not included in the labor force as they were housewives (Önder, 2013: 36).
Table 1. Women's Labor Force Participation Rates in Turkey Years Labor Force Participation Rates(%)
1923-1927 81,5 1950 81,5 1955 72,0 1960 65,3 1960 56,2 Source:Doğan, 2014, p.11
Between 1950 and 1980, the proportion of female population in wage workers increased, while the ratio of female population in total employment decreased from 47,1% to 36,8%. Especially with the process of urbanization, women in Turkey started to move away from business life (Tansel, 2002: 5). In 1955, while the labor force participation rate of women was 70%, this rate decreased to 30% in the 1990s. Since the beginning of the 1950s, there has been an absolute decrease in the number of working women. In line with the results of the census, the ratio of housewives increased from 78% in 1975 to 82% in 1990, parallel to the decline in labor force participation. Migration from rural to urban areas is considered to be the main reason behind the continuous decline of women's labor force participation since 1950 (Ağlı and Tor, 2016: 77). Women's work outside the home in the 1960s was regarded as a temporary situation due to imperatives. The priority of a woman
17 was her home and working for wages was not among these priorities (Güldal, 2006: 22).
To participate in the non-agricultural labor force in the true sense for women in Turkey, as a result of urbanization, began with the effects of migration which took place as a natural consequence. With the migration from the village to the city, after 1950s, women began to take part in the labor market in the real sense. In this period; developing service sector provided new job opportunities for women. The position and business life of women were affected by the process of adaptation to urban life. In this process of change; women were engaged in education and the possible change in their positions in the labor market (Berber and Yılmaz-Eser, 2008: 2). The more active participation of women in the work life in our country occurred during 1950s. In 1950s, industrial work in urban areas ranked after the service sector in terms of social dignity and was not preferred by women unless required. The service sector, which started to develop in this period, created new jobs for women even if not as much as for men (Kocacık and Gökkaya, 2005: 201).
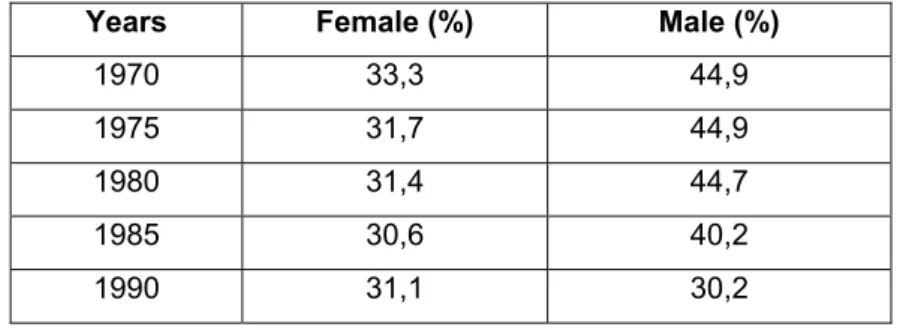
Since 1970s, the number of women who want to work in cities has begun to increase considerably due to the negative imposition of the conditions created by urban life and the impact of urban culture. However, from 1980s onwards, the industrial sector has not created the same rate of employment. While the service sector has shown a faster development than the industrial sector and provided more employment opportunities; it has been insufficient against women's demand (Kocacık and Gökkaya, 2005:201). As shown in Table 2, in 1970s, while the female labor force was 33,3%, it decreased to 22,7 in 1996. Spread of education, prolongation of education times, migration from village to city and mechanization in agriculture, were among the reasons for this decline. Especially with the urbanization process, women started to move away from business life (Doğan, 2014: 12-13).
Table 2. Labor Force Participation Rates between 1970 and 1990
Years Female (%) Male (%)
1970 33,3 44,9 1975 31,7 44,9 1980 31,4 44,7 1985 30,6 40,2 1990 31,1 30,2 Source: Küçükkalay, 1998: 3
18 In 1980, instead of the import substitution approach, export-oriented approach was introduced after the decision made on January 24; the export-oriented model increased the production, but the same increase was not reflected in employment. The reason for these developments especially in the industrial sector arised from the increase in the existing capacity, rather than the creation of new investments and new employment areas. However, due to the maximization of the increase in production, which was achieved through the use of idle capacity in the early 1990s, the industrial sector experienced serious stagnation. With the lifting of the ban on removing workers in 1980, the unemployment rate increased considerably. Only between the years 1980-1985, the percentage of women unemployed in the industrial sector was around 20% (Kocacık and Gökkaya, 2005: 201).
2.2.3. Female Labor Force in Turkey during the Globalization Period
After the proclamation of the Republic, in response to the significant development realized in the female labor force in Turkey, it still was not yet at the same level as of the developed countries. Due to the proclamation of the Republic, Turkish women were emancipated not only politically but also economically. In addition, women took their place in work life except agriculture and hand crafts. After World War II, women started to work in urban areas and women labor force gained momentum due to migration along with industrialization. Accelerating industrialization after the Republic, the urbanization and migration incidents brought by industrialization, the legal system brought by the republic, the equality between women and men provided women to study in the field and get a profession (Öztürk, 2011: 16-17).
When the 2018 data of Turkish Statistical Institute (TurkStat) is analyzed, it is observed that while the male population was 41 million 139 thousand 980, the female population was 40 million 863 thousand 902. In other words, 50,2% of the population was male and 49,8% was female (TurkStat, 2018). When the labor force status of the population in 2018 is taken into consideration, the population aged 15 and over was 60 million 654 thousand. That is, the total participation rate in the labor force was 53,2%. Of the population aged 15 years and older, 30 million 700 thousand were male and male labor force participation rate was 72,7%. The number of women aged 15 and over were 30 million 647 thousand. Women's labor force participation rate was 34,2% (TurkStat, Labour Force Statistics, 2018). The following
19 figures (Figure-2 and Figure-3) indicate the labor structure in Turkey between the years 1996 and 2018.
Figure 2. Labor force participation rates of males between 1996 and 2018 (% of male population ages 15+)
Source: TurkStat, Household Labour Force Survey, 1996-2018
Note: Series are not comparable with the previous years due to the new arrangements made since 2014.
Figure 3. Labor force participation rates of females between 1996 and 2018 (% of female population ages 15+)
Source: TurkStat, Household Labour Force Survey, 1996-2018
Note: Series are not comparable with the previous years due to the new arrangements made since 2014.
77,3 76,776,7 75,8 73,7 72,9 71,6 70,470,370,669,969,870,170,570,8 71,7 71,071,571,371,672,0 72,572,7 1996 1997 1998 1999 2000 2001 2002 2003 2004 2005 2006 2007 2008 2009 2010 2011 2012 2013 2014 2015 2016 2017 2018 Male 30,6 28,829,3 30 26,627,127,926,6 23,323,323,623,624,526,0 27,628,829,530,830,3 31,532,533,634,2 1996 1997 1998 1999 2000 2001 2002 2003 2004 2005 2006 2007 2008 2009 2010 2011 2012 2013 2014 2015 2016 2017 2018 Female
20 When Figure 2 and Figure 3 are examined, the difference between the male and female labor force is remarkable. The female labor force participation rate in the labor market in Turkey remained at low levels compared to labor force participation of males. When we examine the male labor force participation rate in Turkey, it was 77,3% in 1996, it appears that this ratio decreased until 2007. From 2007 to 2011, it is observed that the male labor force ratio has increased. On the other hand, the female labor force rate, which was 30,6% in 1996, decreased until 2005, and increased after 2005 and remained at 34,2% in 2018.
When the labor force participation rate is compared between the years 1996 and 2018, it can be suggested that the female labor force ratio increased from 30,6% to 34,2%, but the male labor force participation rate has decreased from 77,3% to 72,7%. In all countries of the world, the number of women's labor force is increasing day by day. With the economic and social changes experienced over time, more women enter work life and the employment structures are re-shaped accordingly (Kaya, 2009: 30).
2.3. Concept of Employment
The concept of employment, which is of great importance for economic problems in countries, has a wide range of meanings, although it is defined as using in a job, in a task, and as an operation (Özmen, 2012: 111). It is possible to explain the concept of employment in a narrow and broad sense. Employment in a narrow sense indicates the degree of use, work or employment of manpower in a country in a one-year period. Employment in a broad sense refers to the degree to which the capacity of a country's labor, land and capital, that is, the capacity of production elements to be used in a one-year period (Alıcı, 2008: 11).
The concept “employed” by the Turkish Statistical Institute is described as follows (TurkStat, 2019):
“Non-intuitional working age population included in the group of persons at work and persons not at work specified below are the employed population.” ‘Persons at work’ are defined as, “persons engaged in any activity during the reference period for at least one hour as a regular employee, casual employee, employer, self employed or unpaid family worker”.
21 ‘Persons not at work’ are defined as, “all self-employed and employers who had a job but not at work in the reference week for various reasons are considered as employed.”
Women have undeniably remarkable effects on economic life, therefore, women's employment is important. Another important issue is that women have a serious labor force in creating employment. That is, the inadequacy of employment in the country adversely affects women's labor force participation (Değer, 2016:7). It is thought that women are employed in jobs which are considered to be more suitable for themselves. Women who entered work life after men had to fulfill the tasks defined for them. For this reason, there has been a difference between women's work and men's work and women have had to abide by the rules of this discrimination in work life (Dalkıranoğlu, 2006:27).
One of the most important indicators of the economic and social development level of a country is the sectoral distribution of employment and the female population among those employed (Alıcı, 2008:12). According to Figure 4, when viewed on the status of employment in Turkey between the years 2007 and 2018, it is observed that the female employment was at its highest point in the agriculture sector with 42,7% in 2007. In the years after 2007, the rate of women's participation in employment declined and in 2018, this ratio decreased to 26,1%.
When Figure 4 is examined, it is observed that the female employment in the service sector has increased over the years. While the rate of women employed in the service sector was 41,2% in 2007, this ratio increased to 57,9% in 2018.
22 Figure 4. Percentage distribution of female employment in terms of
economic activities between 2007-2018
Source: TurkStat, Household Labour Force Survey, 2007-2018
The sectoral development of employment in developed countries has been the transition from agriculture to industry and from there to the service sector. However, in Turkey, which is a developing country, due to insufficient development of the industrial sector, the country has experienced a rapid transition from the agricultural sector to the services sector (Alıcı, 2008: 12). When the employment of women in the industrial sector in Turkey is examined, it can be said that there is not a significant change. While the ratio of women employed in the industrial sector in 2007 was 16,1%, it was 16% in 2018.
2.4. The Distribution of Employment of Women in Selected Occupational Groups in Turkey
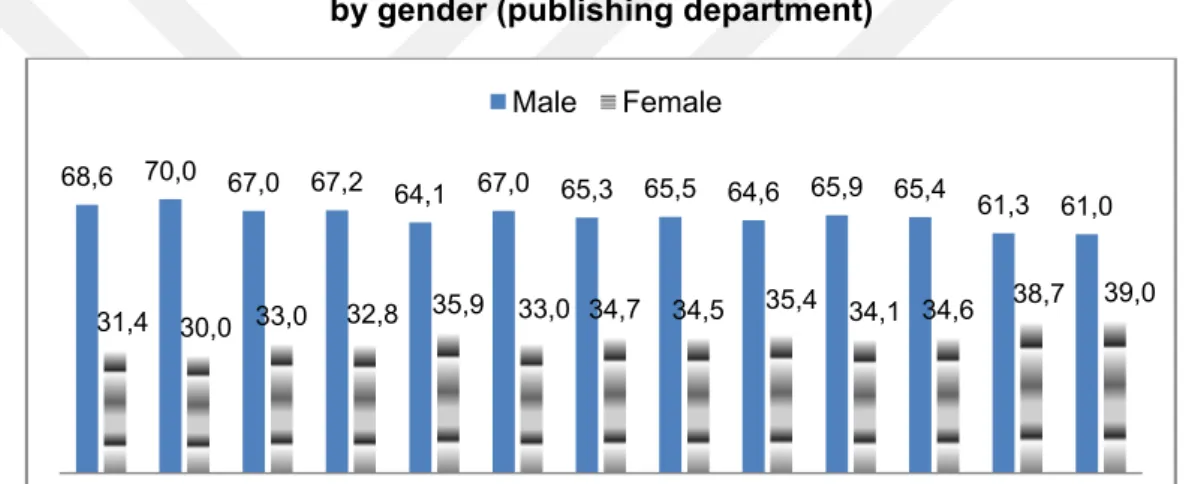
In this part, the participation of women in selected occupational groups is discussed in terms of managerial positions, education (primary, secondary and high school education), security services, and representation at the Assembly, ministries, security services, justice services, press and foreign affairs.
According to TurkStat, Household Labor Force Survey, 2012-2018, employment of females in managerial positions has increased from 2012 to 2018. When Figure 5 is examined, while the employment rate of males in managerial positions was 87,8% in 2012, this ratio decreased to 85,2% in 2018. When the employment rate of females in the managerial position is examined, it was 12,2% in
42,7 42,1 41,6 42,4 42,2 39,3 37 32,9 31,4 28,7 28,3 26,1 16,1 15,7 15,3 15,9 15,2 14,9 15,3 17,1 16,1 15,9 15,6 16,0 41,2 42,2 43,1 41,7 42,6 45,8 47,7 49,9 52,5 55,4 56,1 57,9 2007 2008 2009 2010 2011 2012 2013 2014 2015 2016 2017 2018 Agriculture Industry Service
23 2012 and this rate increased to 14,5% in 2013. In 2015, share of females in employment was again at the same level as in 2012, and in 2018, the females’ share of managerial positions was 14,8%. In other words, the share of females in managerial positions increased from 2012 to 2018.
Figure 5.Females' share of managerial positions, 2012-2018
Source: TurkStat, Household Labour Force Survey, 2012-2018
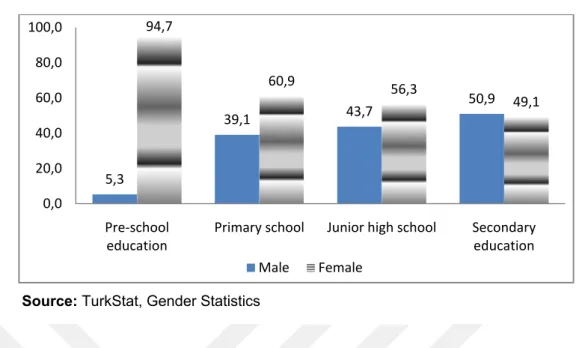
According to the data obtained from the TurkStat, 2016/2017 education year, when the ratio of teachers according to gender and education level is examined in general, it can be noticed that the ratio of female teachers was higher than that of males. When the ratio of women and men in pre-school education is examined, it is seen that 94,7% of pre-school teachers were female while 5,3% of male. In other words, the majority of pre-school teachers are women. When the ratio of female and male teachers in primary school is examined, it is seen that 60,9% of females and 39,1% of males take part. Again, the number of female teachers (56,3%) in secondary school is higher than that of male teachers (43,7%). On the other hand, while the ratio of female teachers at secondary level is 49,1 percent, the ratio of male teachers is 50,9 percent. The ratio of male and female teachers at the secondary level is almost equal (Figure-6).
87,8 85,5 86,6 86,8 84,9 85,0 85,2
12,2 14,5 13,4 13,2 15,1 15,0 14,8
2012 2013 2014 2015 2016 2017 2018
24 Figure 6. Percentage of teachers by level of education, 2016-2017
Source: TurkStat, Gender Statistics
When the ratio of male and female rectors in universities is examined, it is observed that there were more male rectors. When Figure 7 is examined, according to 2018 data, 89,8% of the rectors in the universities were male and 10,2% was female. While the ratio of male rectors in the state universities was 95,3%, this ratio was 80% in private universities. On the other hand, while the rate of female rectors in the state universities is 4,7%, this rate is 20% in private universities. We can say that the number of female rectors in private universities is higher than the number of female rectors in state universities.
Figure 7.Percentage of the Rectors of Universities by Gender, 2018
Source: TurkStat, Gender Statistics, 2018
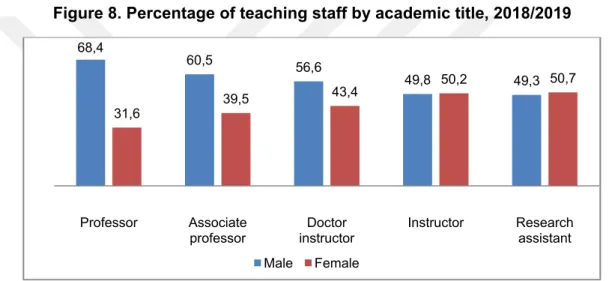
When the ratio of teaching staff according to academic title is examined, it can be said that the ratio of males and females working as research assistants in
5,3 39,1 43,7 50,9 94,7 60,9 56,3 49,1 0,0 20,0 40,0 60,0 80,0 100,0 Pre‐school education
Primary school Junior high school Secondary education Male Female
89,8 95,3
80,0
10,2 4,7 20,0
Total State university Private university
25 Universities was the same as 50% in 2018. According to Figure 8, the proportion of female instructors in 2018 was 50,2%. The ratio of the male language instructors was 49,8% in 2018. When the working status according to the academic title was examined, it can be realized that there was a decrease in the proportion of women for associate professor and professor positions. The percentage of males who were associate professors is 60,5% and the rate of women was 39,5%. Also, the ratio of men who were professors is 68,4% while the rate of women professors is 31,6%. According to Figure 8, it can be said that women were employed more than men as an instructor. With the rise of academic positions, women were less involved in employment.
Figure 8. Percentage of teaching staff by academic title, 2018/2019
Source: TurkStat, Gender Statistics, 2018
When police rates are examined by gender, the ratio of male police officers was higher than that of female police officers. According to Figure 9, between 2007 and 2018, male police officers were more than female police officers. Between 2007 and 2018, male police ratio was usually over 94%. When the rates of female and male police officers were compared, it can be noticed that the female police ratio was far behind the male police ratio. On the other hand, between 2007 and 2018, the rate of female police officers was generally around 5%.
68,4 60,5 56,6 49,8 49,3 31,6 39,5 43,4 50,2 50,7 Professor Associate professor Doctor instructor Instructor Research assistant Male Female
26 Figure 9. Number of police by gender, and gender ratio, 2007-2018
Source: TurkStat, Gender Statistics, 2018
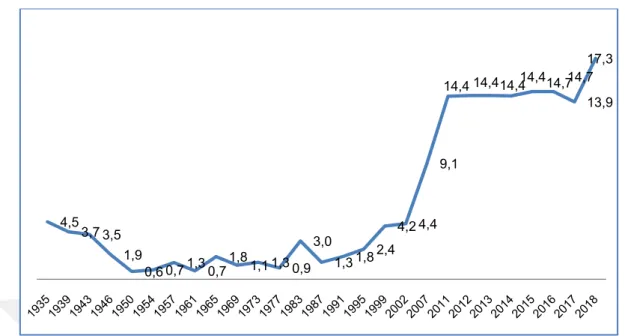
On December 5, 1934, women began to show their presence in parliament with the right to be elected in the elections. Women's representation in parliament was 4,5% in 1935 after women took part in parliament. In 1980s, demands for women's rights and gender equality became visible in public places. Organized groups of women came to the streets to protest the Convention on the Elimination of All Forms of Discrimination against Women (CEDAW) (Terzi, 2014: 90). The reason for the increase in the representation of females in the parliament between 1977 and 1983 can be attributed to this reason. In 1977, while the rate of representation of females in the parliament was 0,9%, it was 3,0% in 1983. According to Figure 10, female representation rate in the assembly increased after 1987. Between 2011 and 2016, the rate of representation of females in the assembly was 14,4%. This ratio declined to 17,3% in 2018.
94,4 94,4 94,3 94,3 94,4 94,5 94,5 94,5 94,5 94,0 93,6 93,4
5,6 5,6 5,7 5,7 5,6 5,5 5,5 5,5 5,5 6,0 6,4 6,6
2007 2008 2009 2010 2011 2012 2013 2014 2015 2016 2017 2018
27 Figure 10. Female representation rate in the Assembly by the election
year, 1935-2018
Source: TurkStat, Gender Statistics, 2018
When Table 3 is examined, it can be realized that the number of male ministers has always been more than the number of female ministers since 1980. From 1980 to 2018, the number of female ministers was generally 1 or 2.
Table 3. Number of ministers by gender, 1980-2018
Year Total Male Female
1980 29 29 - 1990 31 30 1 1995 34 32 2 2000 36 36 - 2001 36 36 - 2002 25 24 1 2003 22 21 1 2004 22 21 1 2005 22 21 1 2006 22 21 1 2007 24 23 1 2008 24 23 1 2009 24 22 2 4,5 3,7 3,5 1,9 0,6 0,71,30,71,81,1 1,3 0,9 3,0 1,3 1,82,4 4,2 4,4 9,1 14,4 14,414,414,414,714,7 13,9 17,3
28 2010 24 22 2 2011 25 24 1 2012 25 24 1 2013 25 24 1 2014 25 24 1 2015 27 25 2 2016 27 26 1 2017 27 25 2 2018 16 14 2
Source: TurkStat, Gender Statistic, 2006
When the ratio of male and female judges is examined in the period from 2006 to 2018, it is noteworthy that the percentage of male judges was higher than that of female judges. Between 2006 and 2009, female judge ratios were generally around 27% and 29%. In these years, the ratio of male judges ranged from 71% to 72%. After 2010, the number of female judges increased and the number of male judges decreased. Lastly, by 2016, there was a noticeable increase in female judges compared to previous years. In 2016, the rate of female judges was 41,3%, while the ratio of male judges was 58,7%. In 2018, the rate of female judges was 44,7% while the percentage of males was 55,3% (Figure-11).
Figure 11. Percentage of Judges by gender, 2006-2018
Source: TurkStat, Gender Statistics, 2018
71,8 72,8 72,2 70,3 68,7 66,6 66,3 64,9 64,6 64,4 58,7 58,1 55,3 28,2 27,2 27,8 29,7 31,3 33,4 33,7 35,1 35,4 35,6 41,3 41,9 44,7 2006 2007 2008 2009 2010 2011 2012 2013 2014 2015 2016 2017 2018 Male Female