ISTANBUL BILGI UNIVERSITY
INSTITUTE OF SOCIAL SCIENCES
INTERNATIONAL FINANCE MASTER’S DEGREE PROGRAM
STOCK PRICE REACTIONS OF ACQUIRING FIRMS TO
MERGERS AND ACQUISITIONS IN TURKEY
SELEN TÜMER
116668003
ASST. PROF. EBRU REİS
İSTANBUL 2019
iii
ACKNOWLEDGEMENT
I would like to express my sincere gratitude to my supervisor Dr. Ebru Reis who
provided me the opportunity to work on this topic and guided me until the completion of my
thesis. I also would like to thank Prof. Dr. Cenktan Özyıldırım for his invaluable opinions
through calculations and statistical analysis.
I am genuinely grateful to my husband Ahmed whose support comments encouraged
me to achieve my best for his IT support during the statistical analysis.
Finally, I am deeply thankful to my mother Asuman and my brother Serhan for their
iv
ABSTRACT
In this study, impact of merger and acquisition announcement on share prices of
acquiring firms was examined. First theoretical framework was clarified by giving
definitions, explaining the types of integrations with advantages and disadvantages. Second
the most outstanding motives for entering a merger and acquisition deal such as economies
of scale, hubris, synergy, tax advantages, transfer of know-how etc. laid out in detail. Then
merger waves were described through the events causing and terminating them, fundamental
outcomes. Event study methodology conducted throughout the research. Sample is made up
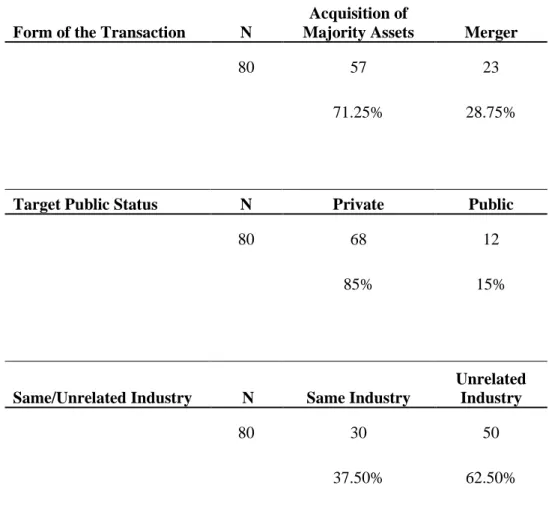
of 80 observations for the period of 1994-2014. Apart from full sample analysis, three
comparison groups which are “form of transaction”, “industry relatedness”, “target public status” were formed and their impact on the share prices were measured separately. Consequently, it is proved that M&A disclosures have a very insignificant impact on
acquiring companies’ share prices.
v
ÖZET
Bu çalışmada şirket satın alma ve birleşme haberlerinin alıcı fırmanın hisse senetleri üzerindeki etkileri incelenmiştir. İlk olarak tanımlamalar yapılarak, birleşme şekilleri avantaj ve dez avantajlarıyla açıklanarak çalışmanın teorik çerçevesi sunulmuştur. İkinci olarak fırmaları birleşme ve satın alma kararlarına yönlendiren sinerji, ölçek ekonomilerinden yararlanma, yöneticilerin kibirleri (hubris), vergi avantajları, know-how transferi gibi öne çıkan sebeler detayları ile açıklanmıştır. Sonrasında birleşme dalgaları başlangıç ve bitiş sebepleri, sonuçları ile birlikte anlatılmışır. Analiz kısmında olay etüdü yöntemi benmsenmiştir. Örneklem 1994-2014 yılları arasında gerçekleşen 80 birleşme ve devralmayı içermektedir. Bütün olarak örneklem incelemesine ek olarak örneklemden “birleşme türü”, “endüstriyel ilişki (aynı ya da farklı endüstriye ait olma)” ve “satın alınan firmanın halka açık ya da özel” olmasına göre alt gruplar oluşturup bunların alıcı firmanın hisse senetleri üzerindeki etkileri ayrı ayrı incelenmiştir. Sonuç olarak satın alma ve birleşme haberlerinin alıcı firmanın hisse senetleri üzerinde istatistiki olarak anlamsız bir etkiye sahip olduğu tespit edilmiştir.
Anahtar Kelimeler: Birleşme, satın alma, birleşme dalgaları, olay etüdü, kümülatif olağan dışı getiri
vi
TABLE OF CONTENTS
ACKNOWLEDGEMENT ... iii ABSTRACT ... iv ÖZET ... v TABLE OF CONTENTS...vi LIST OF TABLES...viii LIST OF FIGURES...ix INTRODUCTION ... 1CHAPTER 1 MERGER AND ACQUISTIONS ... 4
1.1 Fundamental Definitions ... 4
1.2 Structural Forms of Mergers and Acquisition ... 5
1.2.1 Horizontal M&As ... 6
1.2.2 Vertical M&As ... 7
1.2.3 Conglomerate M&As ... 9
1.3 Motives for Mergers and Acquisitions ... 10
1.3.1 Synergy ... 11 1.3.2 Economies of Scale ... 12 1.3.3 Diversification ... 13 1.3.4 Hubris Hypothesis ... 14 1.3.5 Financial Reasons ... 15 1.3.6 Tax Advantages ... 17 1.3.7 Elimination of Inefficiencies ... 18
1.3.8 Intellectual Property, Expertise & Know-How ... 19
CHAPTER 2 MERGER WAVES ... 20
2.1 Introduction ... 20 2.1.1 First Wave (1897-1904) ... 20 2.1.2 Second Wave (1916-1929) ... 22 2.1.3 Mid-Period 1940s ... 23 2.1.4 Third Wave (1965-1969) ... 23 2.1.5 Fourth Wave (1981-1989) ... 24
vii
2.1.6 Fifth Wave (1992-2000) ... 26
2.1.7 Sixth Wave (2003 - 2007) ... 27
CHAPTER 3 EMPIRICAL EVIDENCE ... 29
3.1 Developed Markets ... 29
3.2 Emerging Markets ... 32
CHAPTER 4 ANALYSIS OF ACQUIRER RETURNS ... 37
4.1 Methodology ... 37
4.1.1 Introduction ... 37
4.1.2 Brief History on Event Study ... 38
4.2 Cumulative Abnormal Return Calculation (CAR) ... 39
4.3 Sample ... 42 4.3.1 Sample Description ... 42 4.4 Event Windows ... 44 4.5 Results ... 45 CONCLUSION ... 50 REFERENCES ... 52
APPENDIX A: Table 2.1. Summary Table of Merger Waves ... 61
APPENDIX B: Global Mergers and Acquisitions ... 62
APPENDIX C: CAR Table by Countries ... 63
APPENDIX D: Sample Description ... 64
viii
LIST OF TABLES
Table 1.1. Structural Forms of Mergers and Acquisitions 5
Table 1.2. Economies of Scale Sample 12
Table 2.1. Summary Table of Merger Waves 20
Table 2.2. 10 Largest M&A Transactions Worldwide 27
Table 4.1. Descriptive Statistics 43
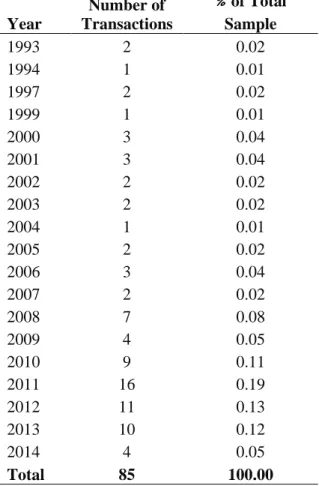
Table 4.2. Distribution of M&A Deals through Years 43
Table 4.3. Distribution of Industries of Acquirers 44
Table 4.4. Distribution of Industries of Targets 44
Table 4.5. Full Sample CARs 46
Table 4.6. Merger vs. Acquisition of Majority Assets CARs 47
Table 4.7. Same vs. Unrelated Industry CARs 48
Table 4.8. Private vs. Public Target CARs 48
ix
LIST OF FIGURES
Figure 1.1. Vertical Integration Schema 8
Figure 1.2. Economies of Scale Graph 13
Figure 2.1. First Wave Merger Amounts 21
Figure 2.2. First Wave Types of Mergers 21
Figure 2.3. Third Wave Merger Amounts 24
Figure 2.4. Global Deal Values 28
Figure 2.5. Number of Deals Worldwide 28
Figure 4.1. Estimation and Event Windows 45
Figure 4.2. Mean CAR Chart for Full Sample 46
Figure 4.3. Mean CAR Comparison (Merger vs Acquisition) 47
Figure 4.4. Mean CAR Comparison (Same vs Unrelated Industry) 48
1
INTRODUCTION
In today’s dynamic business environment, in consequence of globalization phenomenon national markets started to be replaced by global markets. Almost all the
countries realized that to national markets are not enough to compete in a global market. New
competition rules resulting from globalization led companies to concentrate more on
technological investments, exploring methods to decrease costs, intensive R&D activities.
Companies need to be in the adequate size to keep pace with the new business environment
with extreme competition and proceed with their operations.
Nowadays, companies are more emboldened to grow continuously with more
efficiency in the work processes. There are various reasons behind growth decisions of
companies such as benefiting from economies of scales, decreasing costs, expanding
production capacities in case of inadequate demand, entering new markets or controlling the
market by increasing the market share and eventually making a profit. After a growth
decision companies face an important choice: “internal or external growth?” Due to considerable uncertainty and necessity for a long time of implementation, instead of internal
growth, commonly external growth is adopted by authorities. The most favored external
growth method is growing via mergers and acquisitions.
Stock returns based on M&A disclosures became a popular research subject in
2
operations were prevailing and capital markets were efficient, so as in US and UK.
Documentation in the finance literature exhibits that stock price performances generally
actualized above the market (abnormal return) around the M&A announcement day,
however, these ARs were predominately formed in target share price returns.
In Turkey from the beginning of 1990s, there is an observed upsurge in the numbers
of M&As. In this alteration, Turkish economy being more open to international expansions,
formation of stock markets and fast progress of the secondary equity market after 1980
resolutions played a significant role. In the period after 1990s, factors like increase in
privatization, improvements in the relationship with EU and great interest of foreign capital
in sectors like financial services and telecommunication had a considerable influence on the
rise of transaction volumes. Despite these improvements and the rise especially in 2005,
Turkish literature regarding impacts of the mergers and acquisition on the publicly-traded
parties’ stock returns are still limited.
Main historic data was retrieved from the database of Thompson Reuter's Securities
Data Corporation (SDC) and research conducted for the duration of 1993-2014. However,
this date set was filtered like the others in the literature to determine the real sample that
serves the purpose of the research. As a result, 80-observation sample was obtained.
Filtering criteria is as below:
i. “The transaction is listed as completed with an announcement date in the sample period;
ii. The acquirer firm is a publicly traded company on the Turkish Stock Exchange (Borsa
Istanbul);
iii. The transaction is identified as a “merger”, “acquisition of majority interest”; iv. The acquiring firm is a non-financial firm;
3
v. The acquirer does not own more than 20% of the target firm prior to the event date
and owns at least 50% after the event date” (Reis, 2015)
In the first chapter of 3-chapter research, comprehensive definitions were made
regarding basic merger and acquisition terms, structural forms of M&As, advantages and
disadvantages of them were explained in details in the light of examples, motives for merger
and acquisition were exemplified and supported with literature view conducted regarding
these motives.
Second chapter covers the timeline of the merger waves in details. How these waves
started and ended, what are the main characteristics, which distinguished deal types and
payment methods come front and what kind of the outcomes they brought are explained.
Third chapter is the coverage of literature review. Empirical evidence on “the impact of mergers and acquisitions announcements on stock prices of acquirers” was presented in two main groups as developed and emerging markets. Lastly, Turkish literature regarding
this topic was examined and outstanding examples were explained.
Fourth and final chapter is the research analysis part. In this part event study
methodology was described with the steps to follow in the light of brief history. Capital asset
pricing model, daily returns, abnormal and cumulative abnormal returns were shortly
clarified with formulas. Event windows and sample description was defined through a series
4
CHAPTER 1
MERGER AND ACQUISTIONS
1.1 Fundamental Definitions
“Merger”, “acquisition” and “takeover” terms are generally used interchangeably in the terminology. (Singh, 1971) However, there are clear distinctions among them and it
would be beneficial to clarify them from the beginning for further understanding.
A merger can be simply described as “complete absorption of one company by
another, wherein the acquiring firm retains its name and identity whereas the acquired firm
ceases to exist as a separate entity.” In merger, bidder (acquirer) acquires everything that the
target has such as assets and liabilities. (Sherman & Hart, 2006)
A consolidation is like a merger but this time a completely new company is
established. Separate existence of acquirer and target terminates at this point. Differences
between parties (acquirer & target) becomes trivial and they combine their power; assets and
liabilities to function as one. (Ross, et al., 2005)
An acquisition can be described as buying an asset (a section, a product line) or stocks
of another company in a way that give the controlling right to the acquirer on the acquired
5
A takeover does not carry a precise meaning and more like general term to show that
control of the entity under discussion changed hands. It may refer any transaction that transfer
the rights of control. (Ross, et al., 2016)
1.2 Structural Forms of Mergers and Acquisition
As a result of various merger waves occurred throughout history, three distinctive
integration types have been developed. Companies should choose the correct form of
integration which suits their philosophy on growth. The decision of structural integration
must be settled during the planning process. They can be listed as below:
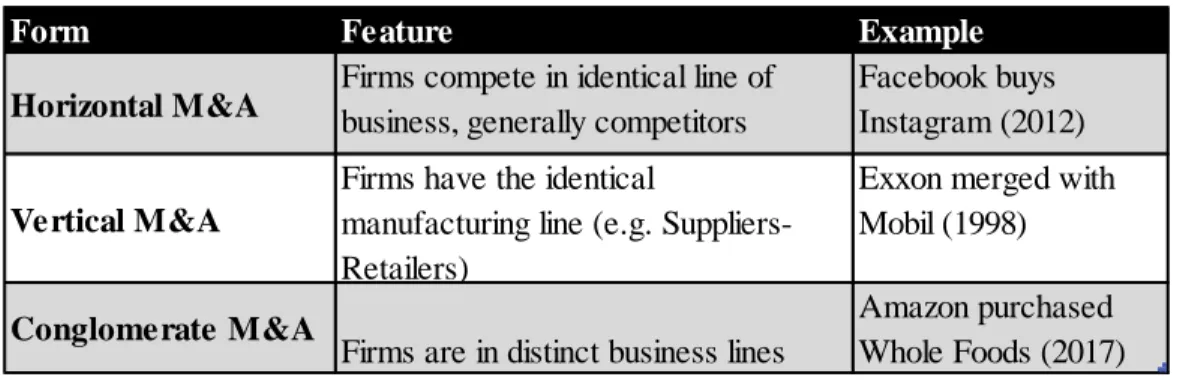
Horizontal M&As Vertical M&As Conglomerate M&As
Table 1.1. Structural Forms of Mergers and Acquisitions
Source: Moskovicz, 2018
Form Feature Example
Horizontal M&A Firms compete in identical line of business, generally competitors Facebook buys Instagram (2012)
Vertical M&A
Firms have the identical
manufacturing line (e.g. Suppliers-Retailers)
Exxon merged with Mobil (1998) Conglomerate M&A
Firms are in distinct business lines
Amazon purchased Whole Foods (2017)
6
1.2.1 Horizontal M&As
Horizontal mergers or acquisitions happens with the integration of the parties within
the similar branch of business, producing identically same or similar products or services
regardless of their geographic location. (Robert et al., 2010) For instance, a merger of two
automobile companies one located Germany, the other one located in US can be great
example of horizontal mergers.
Horizontal M&As can be a great opportunity for wealth accumulation and have the talent to
attract the attention of media and authorities. Advantages of horizontal integration can be
counted as below:
Benefiting from economies of scale (resource combination)
Cost reduction (e.g. elimination of excess usage of resources, allocation of source efficiently)
Market domination
Efficient usage of distribution opportunities Possession of more adept and skillful labor force
Possible working capital and CAPEX expenditure reduction. (Dringoli, 2016)
On the other hand, additional costs coming along with the horizontal M&As should not be
ignored. Some of them can be exemplified as below:
Reorganization of fundamental and supplementary activities and removal of excessive and unnecessary assets
Integration of disparate corporate culture, particularly in marketing and production areas
7
Coordination and controlling complications of a more intricate organization
Extra attention on the demand projections, as soon as the market feels satisfied, the organization may be affected negatively. (Kudełko, et al., 2015)
Integration with the aim of increasing market share and subsequently preventing market competition will be subjected to law enforcement. Because such M&As can
generate monopoly1 in the market and can damage market structure and pricing
mechanism. (Ülgen &Mirza, 2004)
1.2.2 Vertical M&As
Vertical integration occurs by a manufacturer merging with suppliers or retailers
which are functioning in the identical business industry. It is the easiest and most preferable
form of M&As. Manufacturers have collaboration with several suppliers for raw material or
goods and with a retailer for the sales of the finished goods. The principal aim of vertical
integration is to decrease the risk against suppliers and retailers (Robert et al., 2010).
Vertical integration can occur in two different ways: forward integration and
backward integration. In forward integration acquired company take part in the later levels
of the process. It heads towards to retailer (customer side). In backward integration process
flows in the opposite direction, this time acquirer takes place in the earlier levels of
production and the whole process heads towards the supplier side.
1“A monopoly is where there is just one firm in the industry, and hence no competition from within the industry.” (Sloman,
8 Figure 1.1. Vertical Integration Schema
Source: Robert, Wallace, Moles, 2010
Some of the leverages gain by vertical integration can be listed as below (Dringoli, 2016):
Cost reduction in the production cycles due to combined phases (transactional costs) Reduction of costs of raw materials by benefiting from economies of scales
CAPEX reduction as the specialize companies takes the control of related phases such as resources
Reduction of risk and/or improvement in risk management
Assurance in the quality of the product in the early phases via backward integration and of output, distribution via forward integration
Ability to monitor inventory cycles closely in the case of acquisition of the supplier Elimination of the intermediaries or mediators, subsequently reduction of related
costs
Nonetheless, potential disadvantages should also be taken into consideration. They can be
listed as below (Ross et al., 2016): Acquirer Retailer (Customer Side)
Supplier (Raw Material)
Forward Integration
9
Entering into a new line of business
Problems regarding managing the new more complex business operations Direct elimination of rivalry in the supply market (via backward integration) Loss of flexibility in the combined corporation
While the elimination of mediators decreasing the cost, it may also cause the elimination of profit generation by the acquired company for the acquirer
1.2.3 Conglomerate M&As
Conglomerate integration is relatively rare compared to the other two methods. In
conglomerate integration, acquiring company decides to seek opportunities in different
sectors/ industries, unrelated to its core operations. (Felton, 1971)
Chance to diversify provides compensation for the business side that is underperforming
Entrance to the new markets and to be introduced to new customers Great tool for business risk diversification
Can be used as a marketing tool in case complementary products and services (e.g. acquisition of the financial subsidiaries by car retailers to enabling or fastening the
car purchases)
Risks conglomerate integration can be listed as below (Jeon & Kim, 2004)
Administrating problems arising from the fact that company is operating in separate industries
Risks caused by resource and capability shortage of the company Requires strong managerial skills
10
May require the establishment of a new corporate culture Focal point alteration in business activities
Conglomerate M&As can be separated into two category which are “pure
conglomerate mergers” and “mixed conglomerate merger”. Pure conglomerate mergers occur between companies that are totally separate and unrelated to each other. On the other
hand, parties enter mixed conglomerate mergers to pursue either product or market extension.
(Spivack, 1970)
1.3 Motives for Mergers and Acquisitions
There is a vast sort of motives considered valid for M&As such as financial support,
tax advantages provided by capital markets and synergy. Basically, no matter how many and
complicated the reasons for companies entering into M&A agreements are, the main aim
behind every pace is the net present value increase and the maximization of company
profitabilities. As companies pursue value-creating opportunities, they grow in the process.
(Watson & Head, 2007) Especially, during the recent years in which structural changes
occurring in the economy, the growth process of the businesses accelerated in parallel.
There are many reasons behind companies struggling to grow, choose mergers and
acquisitions to fulfill this purpose. These motives vary regarding the socioeconomic factors
of the country in which the company maintains the business activities, characteristics of the
businesses and time. (Piesse et al., 2007) After all the explanations, motives for M&As can
11
1.3.1 Synergy
Synergy is a fundamental motive behind companies enters into M&A agreements. In
the broadest sense, it means the totality of the fragments is worth more than the whole.
(Gaughan, 2015) The relation among the pieces creates extra value. In M&A concept it
indicates that after merging company value becomes greater than it being single and separate.
Moreover, it may also mean the gains purely coming from totally separate fields as a
result of the combination. For instance, one personnel in company A may be highly qualified
to lead X department in company B or another personnel in company B may be perfectly
suited to sell the products of company A. (Pike & Neale, 2009)
To illustrate, a company that has two machines that allow producing 600 and 900
units respectively. Through merger they could achieve production of 1,800 units per day,
doubling or tripling the number of machines used in both processes.
V(AB)> V(A)+V(B)
Synergic impacts emerge from five sources (Ehrhardt & Brigham, 2011):
Operating impact arises from managerial economies of scale such as in marketing, administration, manufacturing and distribution.
Financial impact is the increase in stock prices despite low transaction costs. Tax impact suggests that joint organizations carry less tax burden than single ones. Diversification impact refers that after merges party with weak management
becomes more powerful and the party with the strong management grows into a more
efficient system. Consequently, assets of weak management are used more
12
Market power increases as the competition decreases in the market. However, in today’s markets, such kind of mergers are neither desirable nor allowed.
1.3.2 Economies of Scale
Economies of scale denote that by increasing production, the average fixed cost can
be decreased. So the more products produced, the less average total cost will be. (Megginson
et al., 2008) However, every production facility has limits and these limits can be extended via M&As. Same is applicable to fixed cost, they can be decreased even more in case of an
M&aA (DePamphilis, 2014) Economies of scale provide leverage to businesses for reducing
costs by broadening their scope of production. The main aim is to decrease the unit cost of a
product. Economies of scale are the genuine purpose of horizontal integrations: merged
companies can accomplish cost reduction by sharing administrative services, executives and
general management. (Watson & Head, 2007)
Mergers can also enable technical economies of scale. For instance, if a high quantity
of production requiring a great amount of funds case arises, large-scale companies can fund
such kind of investment rather than small-scale ones. For instance, if you want to print out
flyers, offer you get is generally like this:
Table 1.2. Economies of Scale Sample
As can be seen in this simple example as the quantity produced increases unit price is
decreasing.
Unit Total Price Unit Price
1000 TRL 200 TRL 0.20
2000 TRL 300 TRL 0.15
13 Figure 1.2. Economies of Scale Graph
1.3.3 Diversification
As mentioned before companies have two alternatives to pursue their growth target:
internal or external growth. Since the application of internal growth is time-consuming, more
difficult and costly, external growth becomes more favorable. Entering into mergers and
acquisition agreements is the most basic version of growth. Diversification in this concept
means business growth outside its main activity area. The central pillar of this theory relied
upon modern portfolio theory suggested by Harry Markowitz (1952).It is next to impossible
to attain a perfect investment in the real world which is achieving high returns with low risks
but the theory asserts that it is possible to accomplish a perfect investment by creating an
optimal portfolio. That means a portfolio generated with various unrelated instruments can
reduce the risk with diversification and create an optimal portfolio. This hypothesis sustains
the idea of M&As motive via diversification. (Motis, 2007)
As it was mentioned before, such kind of growth provides financial support. If one
segment performs under the expectation, the other one provides financial leverage.
14
profitable and with better growth potential industry. The fact that the main industry reached
its maturity, high competition in market decreasing profitability, slow-down in the growth
targets can lead a business to grow via diversification. (Elmas, 2007)
On the other hand, there are some researches proving that diversification has a
downward effect on the worthiness on the overall company value. Berger and Ofek (1995)
to measure the effect of diversification, compared the aggregate values with the individual
ones for the period 1986-1991 and found 13-15% loss in the value owing to diversification.
Lang and Stulz (1994) findings support the previous study. They compared Tobin’s-q2 value with diversification and found a negative relationship between them. Firms choose to
diversify performed poorer compared to non-diversified opponents. Moreover, Akbulut and
Matsusaka (2010) also had similar results with their research which financial results were
affected negatively due to diversification and according to them agency problems are the
reason. However, unlike the previous researches, they also found that throughout their
observation, the combination of bidder and target returns are meaningfully positive and
significant
1.3.4 Hubris Hypothesis
This theory suggested by Richard Roll (1986) helps to explain the effect of
overconfidence of management in M&A process. Basically, it assumes that in a takeover
manager overestimate the benefits of synergy or their abilities to estimate, in other words,
2 “The q-ratio is the ratio of the market value of the acquirer’s stock to the replacement cost of its assets. Firms
can choose to invest in new plant and equipment or obtain the assets by buying a company with a market value of less than what it would cost to replace the assets” (DePamphilis, 2014)
15
they become arrogant. Their individual motives are the priority for them rather than putting
the benefit of the company as first.
The research conducted by Hayward and Hambrick (1997) supports the findings of
Roll. They found a positive correlation between hubris indicators and premiums payments.
They examined 106 acquisitions and four of their indicators were heavily correlated with the
hubris of CEO. Moreover, it was detected that bidding firms’ shareholders had suffered from the losses and as the premiums of acquisitions and CEO hubris increment, losses for
shareholders were also increasing.
Furthermore, another study carried out by Seth, Song and Pettit (2000) had similar
outcomes and findings were parallel with the previous researches. Their study consists of 100
U.S. overseas deals for the period 1980s. However, they have measured not only the impact
of the hubris hypothesis but also synergy and managerialism which is very much alike to
hubris. All in all, in the light of these empirical shreds of evidence, the hubris hypothesis is
a valid motive for M&A deals.
1.3.5 Financial Reasons
Growth decision is obscurity for companies, should it be internal or external? That
becomes a greater concern for small and middle-size businesses. They generally face the
difficulty of growing with internal resources. In such cases merging offer coming from
large-size businesses are accepted (Wild & Rapinet, 2007) and payment regarding purchase is
generally asked to be made via acquirer’s common stocks. On the other hand, since there will not be any cash outflow from the acquirer side, the need for additional funds significantly
16
In most cases, it is more alluring for managers to merge with another business, which
has an established system (production, marketing, administration, distribution, etc.), by
paying via their stocks rather than gathering funds by selling the stocks publicly to obtain
new capacity. Financial reasons can be explained under two categories (Özden, 2006):
Excessive free-cash-flow: Companies with excess funds may use these funds to purchase fixed-income securities, to pay dividends, to repurchase their own securities
or to merge with/acquire another company. Among these, “acquiring a company” option does not generate an immediate tax impact for acquiring party. That is why it
becomes an attractive opportunity and fuel for M&As. On the other hand, it can be
an opportunity for a company with lots of investment possibilities and no cash to
finance to merge with one with great potential to generate cash in the future. (Brealey,
et al., 2011)
Cost of capital reduction: As a theory, debt capacity of the company formed after M&A should be greater than the parties separately involved. (Berk & DeMarzo,2014)
With the synergy effect after M&As take place cost of capital decreases. If one party
has unused debt capacity, this can be used to finance mergers and acquisition process.
From the point lender point of view, due to the low level of risk, it is possible to find
a cheap loan. (Akay, 1997) As a result, the cost of capital after M&As decreases
17
1.3.6 Tax Advantages
Tax aspect has been a great motive for a number of M&As, on the other hand, there
are still ongoing debates on this topic. For instance, a lucrative company performing in the
top tax bracket can benefit via acquiring a company having through accrued tax loss.
(Auerbach & Reishus, 1987) So, instead of transferring it to the following years to use it in
the future, immediate usage as tax savings would be more favorable for companies. However,
it is crucial to mention that benefiting this kind of a deal is more difficult recently due to the
strict controls and legislation. (Gaughan, 2015)
Moreover, for companies with excess cash reserves, this kind of M&A deal can be a
great advantage for decreasing tax burden. To illustrate, if one company is lacking options
for internal investment, as mentioned under “free-cash-flow” there are several options ahead for the usage of such kind of excess cash: dividend payment, purchasing securities,
purchasing back their own stocks from the market or acquiring another company. Dividend
payment to shareholders will end up with abrupt tax payment with the conclusion of the
distribution. Purchasing securities has a short-term average benefit for companies, however,
they are inadequate to match the expectations of shareholders. Repurchasing stocks from the
market and selling them again may create a capital accumulation but nothing more. Acquiring
another company with the spare cash would provide a clean shortcut and avoidance of tax
burden. However, it should not be ignored that acquisition premium payments are still more
than the tax saving, therefore making the tax advantage as the sole motive for an acquisition
may end up with a loss from acquiring party side. (Ehrhardt & Brigham, 2011)
Gilson, Scholes, and Wolfson (1988) conducted a research to test the accuracy and
validity of this theory of gaining tax advantage and found that it is valid only for a small
18
with the previous research. She investigated the importance of tax feature of targets for the
bidder and target abnormal returns and proved the noteworthy existence of the relation. In
addition, tax aspect, especially tax-free status provided by it, was a considerable driver for
acquisition deals.
1.3.7 Elimination of Inefficiencies
If this motive is a driving force for the acquiring party, then this means there are two
assumptions from their side. First, they believe that the company is underperforming and that
can be reversed and second highly probably there is an efficiency problem with the
management with should be corrected. It is expected then, that poorly managed companies
are subject to a takeover. Thus, by eliminating these problems, improving the quality of
management, changing the downward direction of stock prices, new shareholders may be
attracted. (Watson & Head, 2007) So rather than cash, there are other things that can be
wasted by mediocre management. It is essential to mention that the main reason lying
beneath the takeover nothing to do with the wealth of the joint parties. It is used as a technique
to substitute the old one with new and efficient. Due to the high positions of the management,
it can be challenging to dismiss the top personnel and M&As make it much easier and
practical. (Brealey, et al., 2011) Martin and McConnell’s (1991) findings support this theory
that in following year of the takeover chief officers are possibly changed. Maximum of 10%
of replacement amount (for the years (-1, -5)) reaches almost 42% after the takeover had been
19
1.3.8 Intellectual Property, Expertise & Know-How
Parties of an M&A deal may have dissimilar technological competences, corporate
culture, intellectual properties (copyrights, trademarks, patents, human capital, etc.) and
know-how. In case of an agreement, all of these strengths will be combined and diffuse
through the new structure. Eventually, they will gain a solid place in the market or in an
extreme case they may dominate the market. (Röller et al., 2006)
Nowadays, expertise in precise areas is a required specification to be more efficient
and compete with the rest of the market. So, in case of such need, it is pretty difficult to find
the required labor force and even more difficult him to obtain success in an unfamiliar
environment. So instead, getting this force with his already operating unit, in other words,
acquiring the company owning the labor force would be more target-oriented and fertile in
considerably less time. (Berk & DeMarzo,2014)
What’s more, if the acquirer has a belief that the target company will be in an upright position future in the market due to the valuable intellectual property rights it has, acquiring
party may desire to prevent competition or enlarge invention capacity by taking over the
20
CHAPTER 2
MERGER WAVES
2.1 Introduction
Cyclical and intensified merger activities appeared mainly in US history during the
six period are named as merger waves. (Fuad & Gaur, 2019) Historical process of merger
and acquisition waves can be classified as below. Recurring activity of great amount of
mergers followed by comparatively less amounts formed these periods. Between the years
1897-1989 is the materialization of the four waves, from that time until the end of 1980 there
was a noticeable drop in the merger activities. However, there was opposite movement in
from the beginning of 1990s till 1992 (commencement of fifth wave). (Gaughan, 2015)
[Appendix A: Table 2.1. Merger Waves]
2.1.1 First Wave (1897-1904)
In 1883, after great depression first merger wave emerged. Two third of mergers
concluded in this period concentrated on petroleum and food products, metal, mining and
transportation fields. (Owens, 2009) Peak period was between the years 1898-1902 and in
21
with respect to years are as below. (Eis, 1969) During this period horizontal M&As were
dominating the market.
Figure 2.1. First Wave Merger Amounts
Source: Gaughan, 2015
To illustrate, in this period in addition to J.P. Morgen merging with Carnegie and US
Steel. It merged with more than seven hundred small steel firms. As a result, this enormous
sized company held control of 80% of overall steel production. That is why, preventing the
formation of such entities, demolishing the ones already standing in the market and the
protection of the competition became the official policy of the US government. (Owen, 2009)
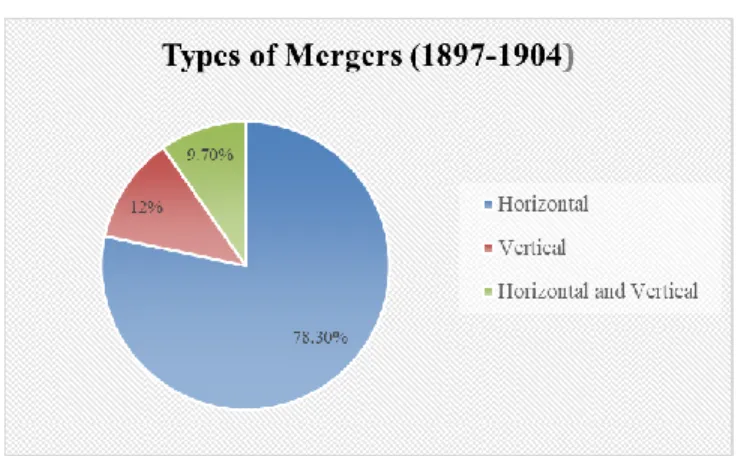
Figure 2.2. First Wave Types of Mergers
22
78% of mergers between the years 1895-1904 were horizontal mergers whereas only 12% of
them were vertical. Most of the horizontal mergers occurred in this period brought about
monopolistic market creation. That is why this period is known with the role it played in the
formation of monopolies. (Kleinert & Klodt, 2002)
2.1.2 Second Wave (1916-1929)
As the first wave was known as the mergers of monopolies, the second wave was
called as the merge of oligopolies. An oligopoly can be described as an industry controlled
by only a few producers. (Case et al., 2017) It comes from the same roots that prompted
monopoly. The main difference between the first and the second wave is that the first wave
was the creator of the monopolies, the second wave was the initiator of oligopolies
(monopolistic competition). (Kim, 1998) Horizontal merger forms observed in the first wave
period lingered through the second wave and at the same time US economy carried on
altering and booming. During this period, in order to prevent monopolistic formations, a
stricter regulatory environment was established. As a result, efforts were paid and compared
to first wave more oligopolistic structures emerged and many vertical integrations occurred.
(Markham, 1955) continue
Moreover, in this period, it is encountered that many unrelated industrial branches
enter into mergers (pure conglomerate merger). The second wave was concluded with the
Wall Street Crash of 1929 (Black Thursday) on 24th of October, 1929. Even though this is
not the sole cause for the Great Depression, it had a great role. With the diminished
confidence in the business world and with the visible constricted consumption, depression
23
was a more concentrated structure in investment banks, a huge amount of capital was
controlled by only a tiny group of people. (Sudarsanam, 2003)
2.1.3 Mid-Period 1940s
It would be beneficial to enlighten briefly the period between first and second merger
waves. Since the market is already in motion of alteration, it would be helpful to understand
the environment prepared the third wave. The fundamental purpose of this period’s merger activities was to relive the tax burden on the shoulders of large businesses. Therefore,
generally private and small-sized businesses were acquired by the larger ones. Because taxes
were high and businesses changing hands within the family was extremely pricey, offering
businesses for acquisitions became more attractive during this period. (Gaughan, 2015)
Owing to the minor percentage weights of mergers in overall assets of the industry, we cannot
mention a concentration on mergers. This period was relatively stagnant; no significant
technological improvements, no groundbreaking inventions etc. Consequently, we cannot
mention a rise in the merger amounts.
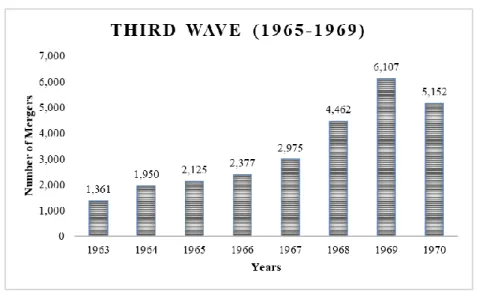
2.1.4 Third Wave (1965-1969)
Emergence of a new merging wave took more than 20 years due to impacts of the
great depression in the 1930s and Second World War. Owing to the strict antitrust policies
in this period, many conglomerate integrations were observed. The third wave is known as
the year of merger of businesses which are totally unrelated to each other, in other words, the
era of conglomerates. (Kusstatscher & Cooper, 2005) With the aid of the booming economy,
24
Businesses aiming for conglomerate mergers targeted not only product diversification
but industry differentiation because of the severe antitrust laws restricting the mergers within
the same industry. Celler-Kefauver Act in 1950 was enacted against the monopolies and
oligopolies emerged during the first & the second waves and also to strengthen the previous
act in 1914 (Clayton Antitrust Act). (Gaughan, 2002) Clearly, this act was aiming for the
protection of competition and when we look at the increasing numbers of conglomerate
integrations, it was obviously reached. (Shleifer & Vishny, 1991) However, in 1973 with the
oil crises broken out and economic recession following, third wave period terminated.
(Gregoriou & Renneboog, 2007)
Figure 2.3. Third Wave Merger Amounts
Source: Kim, 1998
2.1.5 Fourth Wave (1981-1989)
This wave occurred as a consequence of the inadequacies generated by the third
wave’s differentiation and diversification policies. (Bhagat et al., 1990) Diminution trend of the mergers monitored from the 1970s until 1980s reversed exactly opposite in 1981. Main
25
characteristics of this period were ease of antitrust policies, enhanced control of shareholders
and increased competition in capital markets. Businesses started to realize the advantages of
de-diversifying and move their focus again on core business activities. (Blair, 1993)
What makes this period totally different from the previous three is the takeover
method. Fundamental characteristic of this period is the hostile takeovers3. Corporations and
strategic partners inclined towards hostile takeover to earn abnormal returns in a very short
time. Despite the excessive number of hostile takeovers observed, this period is remembered
with the increased concentration on the strategic integrations. Businesses developed several
attacks and defend strategy against hostile takeovers. Core effort was downsizing of the
operations, foregrounding specialization in operations and the correction of extreme
expansions and diversifications arose during the third wave. (Gaughan, 2015) In brief, main
motives in this period were re-seizing the control of company’s focal point, shrinking
company in the process to catch back the focus and consequently, synergy was captured in
transferring production and technology after mergers. Especially, mergers concentrated on
the technology-intensive sectors. (Kleinert & Klodt, 2002)
At the end of the 1990s economy experienced a slight recession, expansions of 1980s
slowed down and came to a halt eventually. Moreover, economy also experienced the
breakdown of the junk bond market (main contributor to hostile takeover rise) in the late
1990s. Junk bond market was one of the main veins feeding the great majority of leveraged
buyouts 4(LBOs) at that time. (Hurduzeu & Popescu 2015) In short, all these events prepared
the conclusion of the fourth merger wave.
3“A hostile takeover is really quite the same thing as a regular buyout or acquisition. The thing that makes such a takeover hostile is the fact that it occurs without the consent of the management of the acquired company.” (Taillard, 2012) 4 “A leveraged buyout (LBO) is the acquisition of a company by one or several private equity funds who finance their purchase mainly by debt.” (Vernimmen et al., 2014)
26
2.1.6 Fifth Wave (1992-2000)
Fifth merger wave provided various opportunities for businesses similar to its
predecessor. During this wave, hostile takeovers and short-term financial gambles were
avoided, instead, friendly and strategic with long-term-promise agreements were focalized.
Holmström and Kaplan (2001) claim that the reason behind why hostile takeovers declined in this period is that companies inclined towards advantageous aspects of LBOs. As it
happened it the previous waves, this wave falls on the peak point of the economic growth.
(Martynova & Renneboog, 2008) Throughout this period new peak points were reached in
the stock markets and in market indices.
During expansion and growth period in order to respond to increasing demand,
businesses started to enter M&A deals. That is why this wave is known as great agreements.
(Moeller et al., 2005) Furthermore, unprecedentedly enormous international corporations
arose and the importance of such formations was emphasized. High stock prices encouraged
companies and the idea of “being big to compete” became popular. The largest M&A deal in the history at that time realized in this period. (Lipton, 2006)
It can be said that this is also the period of globalization and deregulations.
Globalization brought about the expansion of the global market and consequently, company
magnitudes were pushed to follow this movement. Moreover, deregulation made entry and
the exit to the market easier. International competitors entered the market against local
competitors for the elimination of the monopolistic structures and eventually, cross-border
M&As provided greater opportunity to move into prosperous markets. This wave’s antitrust
policies, deficiencies in the global competition were heavily criticized. (Gönüllü, 2017) This period terminated with the burst of millennium balloon and big scandals causing
27 Table 2.2. 10 Largest M&A Transactions Worldwide
Source: Institute for Mergers, Acquisitions and Alliances, 2019
2.1.7 Sixth Wave (2003 - 2007)
This wave is relatively shorter compared to the previous periods, but also can be
considered as M&A intensive. This wave began with low-interest rates after the recession in
the economy and sources to finance M&As were created. Low-interest rate and soaring
market conditions enabled the rise of private equities, leveraged buyouts became extremely
inexpensive for them. They could borrow money with fascinating rates to establish a capital,
then purchase companies or parts of it with this raised capital and finally by maximizing the
profits of these acquired companies sell them to make great profits. Hence, this was the era
of private equity firms. They borrowed with very little rates and after sale enjoyed the high
returns, this opened the appetite for M&A targets. (McCarthy, 2011)
As in the fourth wave, companies preferred to finance mergers and acquisitions by
paying cash or by getting into debt rather than their equity. Acquirers had cash-balance
abundance, therefore financing M&A deals with free cash/debt became more common and
only a few of the deals in this period was financed with equity in contrast to 1990s. (Harford,
2005)
Ranking Year Acquirer Target Value ($) Value (€)
1 1999 Vodafone AirTouch PLC M annesmann AG 202,7 204,7 2 2000 America Online Inc Time Warner 164,7 160,7 3 2013 Verizon Communications Inc Verizon Wireless Inc 130,2 100,5 4 2007 Shareholders (Spin out) Philip M orris Intl Inc 107,6 68,1 5 2015 Anheuser-Busch Inbev SA/NV SABM iller PLC 101,5 92,3 6 2007 RFS Holdings BV ABN-AM RO Holding NV 98,2 71,3 7 1999 Pfizer Inc Warner-Lambert Co 89,6 85,3 8 2017 Walt Disney Co 21st Century Fox Inc 84,2 72,5 9 2016 AT&T Inc Time Warner Inc 79,4 72,9 10 2019 Bristol-M yers Squibb Co Celgene Corp 79,4 69,7
28
However, these sixth-period deals couldn’t create value for acquiring parties, on the
contrary, they ended up with the loss of a great deal of money. A reason for this can be
explained as due to great cash reserves, acquirers were really robust and paying cash during
deals might cause free cash flow complication. (Jensen, 1986) Targets shared the same
destiny or even poorer abnormal returns. (Alexandridis et al., 2011)
Eventually, in 2007 subprime mortgage crisis burst out and these companies which
were enjoying the low rates could not attain inexpensive debt and keen investors. With the
subsequent recession in the economy, this period came to end. (Gaughan, 2015)
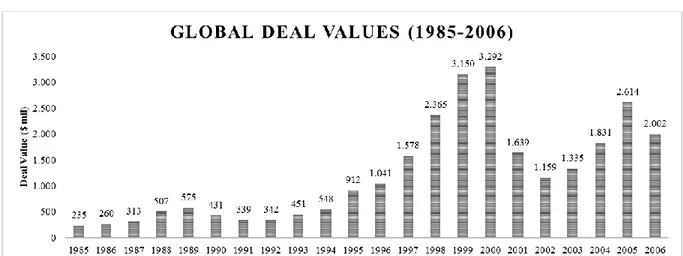
Figure 2.4. and Figure 2.5 provides an overall view of the M&A deals for the period
of 1985-2006.
[Appendix B: Figure 2.4. Global Deal Values] [Appendix B: Figure 2.5. Number of Deals Worldwide]
29
CHAPTER 3
EMPIRICAL EVIDENCE
In the global dimension, there is a wide-ranging documentation measuring how the
stock price performance of M&As on the pre-and post-disclosure period affected. There are
several types of research conducted on this subjected so here is some around the world.
The major purpose of the studies regarding merger and acquisitions (M&A) is to
investigate whether the stock prices of companies subjected to M&A appreciate or depreciate
and correspondingly whether shareholders gain profit. In these studies, it is tested whether
abnormal returns (ARs) is attained with mergers and acquisitions. Some studies measure the
immediate effect of the announcement on the prices within a very short event window
whereas others concentrate on long term performance of the company. (Yılgör, 2014)
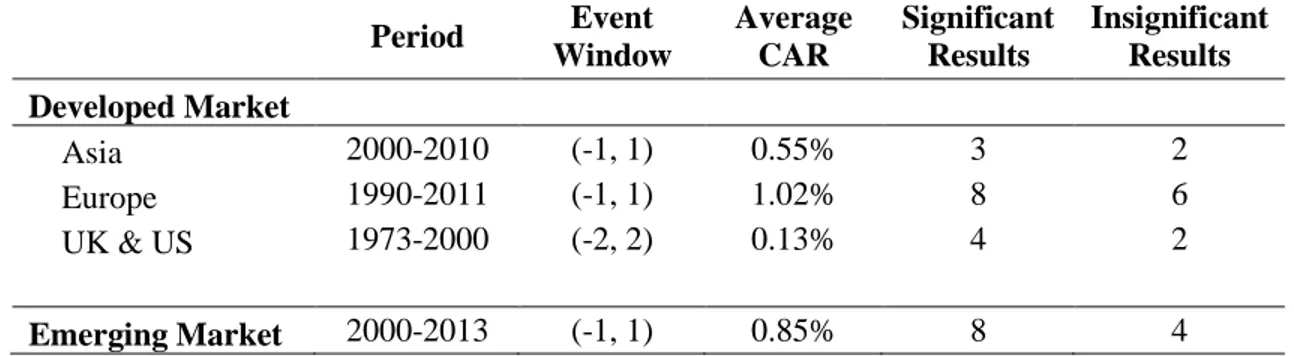
3.1 Developed Markets
Liargovas and Spyridon (2011) examined the impact of mergers and acquisition
announcements on Greek industry. At the end of their study, in which event study
methodology has been conducted, semi-strong form of efficient market hypothesis has been
30
shareholders gained substantial positive cumulative average abnormal returns (CAARs) and
results show that positive CAARs had been achieved after the announcement of diversifying
and horizontal M&As. Overall outcomes demonstrates that banking M&As do not generate
wealth for acquiring parties.
Alexandridis, Petmezas and Travlos (2010) chose several developed markets to test
their theory which are UK, US and Canada. Their findings showed that the best-case scenario
for acquirers to have a zero AR or more commonly negative ARs around the disclosure dates.
On the other hand, acquirers from these countries gain with the less premia payment. On the
contrary to the previous studies, targets from these markets make considerably less one-sided
profit, namely, there is an even, fair distribution of benefits.
Nystad and Grinden (2013) investigated abnormal returns of acquirers for both large
and small companies in Norwegian Stock Exchange and AR was calculated both in euro and
NOK5. The results showed that acquirers experience an average 2.16% AR in €, but AR
calculation in NOK shows that acquirers had statically insignificant negative ARs. On the
other hand, it has been proved that ARs were changing depending on the company size. AR
is 0.22% for large size companies whereas it is 4.10% for smaller size companies. As it can
be observed M&A deals create value for acquirers depending on some circumstances.
Schaik and Steenbeek (2004) have studied the non-financial mergers in Japan for the
period of 1993-2003. Consistent with the findings of Nystad and Grinden (2013), they found
positive AR of 1.4% around the disclosure date and highest return achieved two days before
the announcement, however, it is detected that these gains had quite short life and they
31
vanished shortly after. Observed CARs of (-1,0), (-1,1), (-5,5) are 1.37%, 0.57% and 0.87%
respectively.
Adnan and Hossain (2016) studied merger disclosure and effect on the share prices
of both acquirers and targets in the US market via event study methodology in 2015. During
the study, the role of insider data was measured and clarified. Results indicated there is an
observed increase in bidder and target stock prices. They propose two explanation:
information leakage or good new expectancy. Pre-announcement CAARs are increasing
from 0.64% (5 days before) until 1.04%. However, there is an observed decrease in the bidder
stock prices during post-event period; CAARs are falling with the announcement day from
0.98% till 0.01% (-5,3) and followed by an increase until 1.01% (-5,5). This shows the
incoherency of returns.
Andrade, Mitchell and Stafford (2001) defended the argument that the most
trustworthy method to survey whether a merger and acquisition deal produces value is to
observe the returns in a short-term event window. They investigated 3,688 samples for the
period of 1973-1998. Findings are calculated and presented in 9-years group and results are
-0.3% (’73- ’79), -0.4% (’80-’89), -1.0% (’90-’98) and -0.7 (’73-’98). Even though results
are negative, they claimed that this is not reliable information.
Martynova and Renneboog (2006) investigated the European takeover market (2,419
samples) for the period of 1993-2001. Their sample includes 28 European countries, Ireland
and the UK. Although calculated CAARs are statistically significant and positive for
acquirers, they are still less compared to target returns; 0.5% on the disclosure date. It is
detected that samples coinciding the end of fifth merger wave ruined acquirers’ value.
According to them, the reason for this failure is because of the hubris, limited data processing
32
Ings and Inoue’s (2012) findings are also consistent with the previous works. They have analyzed Japanese bidder companies for the period of 2000-2010 to investigate
shareholder wealth impact on domestic and international acquisitions. Findings revealed that
domestic acquisitions are less profitable than the cross-borders. Cross-border transactions
generate 1% CAAR, whereas domestic deals could only manage 0.4%, within three days
(-1,1) event window.
3.2 Emerging Markets
Shah and Arora (2014) aimed to survey the effect of 37 M&A announcements which
were made in Asia-Pacific region, on bidder and target share price returns for the period of
March 2013-September 2013. During the study, for various event windows “event study
methodology” had been used to measure the CAAR on bidding and target companies’ share prices. Paired sample t-test had been applied by comparing target and acquiring companies’
pre- and post-announcement stock price return within a (-2, 2) event window. It had been
observed that target returns generated statistically significant positive CAARs, different than
zero, whereas in all the event windows the acquirer CAARs were statistically irrelevant. It
was indicated that pre-disclosure returns were considerably less than post-disclosure returns
and also detected that market reaction given to the announcements were really formidable.
Mushidzhi and Ward (2004) analyzed ARs for 64 acquisitions from South Africa
including both target and acquiring for the period of March 1998 - December 2002. Event
study methodology had been conducted throughout the research for CAAR calculations. For
the maximum event window of (-10, 10), findings had been interpreted. As a result,
33
positive of targets two days before the disclosure date with a halt on day-0 (announcement
date) and a downward behavior until +2 days. In the following days, it continued to fluctuate.
On the other hand, there was no significant alteration in acquirer AARs’ not event on the disclosure date.
Sylvani and Yunita (2017) investigate market response against merger and
acquisitions in the telecommunication sector in the Asia-Pacific region. The sample contains
17 observations for the period of 2011-2014. For abnormal returns (AR) computation 21 days
window (-10, 10) with 100 days estimation period was used. The primary aim of this project
was to assess the impact of the disclosure on stock price return, stock price volatility and
trading volume via event study methodology. However, findings showed that there is not
much of an influence on ARs during the pre-post announcement period.
Moeller and Zhu (2016) analyzed the short-time effects of cross-border deals among
Chinese public listed firms and British companies during 2012-2016. During the research,
four different event windows were formed and consequently obtained data had been
measured through event study methodology. Results show that Chinese acquirers had
attained significant positive ARs in the very first day of the post-disclosure date, however, it
was monitored that these ARs had been lost through time. Furthermore, as the event study
was applied to sub-sectors, it is inspected that Chinese bidders in several sectors including
real estate enjoyed the positive ARs while the ones in financial sector bore negative ARs.
Keown and Pinkerton (1981) proved that there were positive abnormal returns in
acquiring parties’ share prices enjoyed by the investors before the public disclosure regarding projected mergers had been taken place. This study had been applied to 194 sample
34
as this could not be kept as a secret. Especially, the fact that excess returns dated back to
twelve days before the disclosure show the severity of the leakage issue.
Sehgal, Banerjee and Deisting (2012) examined whether merger and acquisition
disclosures and deal financing methods have any impact on excess returns. As sample BRICS
countries were chosen for the period of 2005-2009 however, researchers described their
sample as BRICKS countries by adding South Korea also in the group and study was
conducted through event study methodology. It was observed that 5 out of 6 countries have
benefited from the pre-announcement ARs. Consistent with the Keown and Pinkerton’s
(1981) research, the results point out possible leakages. South Korea, China and India
experienced negative ARs during post-evet period whereas South Africa enjoyed positive
ARs. It was also discovered that deal disclosures do not have noteworthy influence on the
trading capacity and the stock prices. Nonetheless, there is observed decline in return
fluctuation.
In their study, Bae, Kang and Kim (2002) have calculated acquirer abnormal returns
listed in Korean Stock Exchange by using market model for the period of 1981-1997.
According to their findings, all ARs calculated within the event window are statistically
relevant. At 5% significance level their CAARs of (-1,0), (-5,5), (-10,10) are 1.23%, 2.67%,
3.39% respectively.
Examples from Turkish Literature
Nowadays, this topic started to be trend topic in Turkey and some recent studies can
be exemplified as below.
The study conducted by Çıtak and Yıldız (2007) investigated 40 acquisitions and abnormal returns (ARs), cumulative abnormal returns (CARs) of acquirers had been
35
computed. It is ascertained that post-sales ARs of acquirers are not statistically meaningful.
Furthermore, if the deal is a merger deal, it is likely that there will be negative CAARs
whereas, in the case of an acquisition, there will be positive ARs. According to Çıtak and
Yıldız, if the deal amount paid by cash, AR returns are positive but if it is made by shares, ARs will be negative.
Yılmaz (2010) researched the effect of M&A deals on share prices of bidders and targets, investigated 51 deals occurred within 2002-2008. Results are presented as
1-month,3-months and 6-1-month,3-months. It is proved that in the 1-month period (-30,30) pre-disclosure ARs
(2.56%) are greater than the post-event (0.94%) period. There is a subsequent surge in the
post-disclosure ARs; 3-months and 6-months ARs are 0.96% and 6.45% respectively.
However, t-test proves that before and after announcement period differences are not
statistically meaningful.
Reis (2015) examined the impact of merger and acquisition announcement on Turkish
acquirer returns and the determinants of these returns for the period of 1994-2013. Results
obtained through standard event study methodology presents a 2.27% cumulative abnormal
return during 11-day (-5, 5) event window. CAARs were compared under the several
determinants such as merger vs. acquisition, same vs. unrelated business, target country
(cross-border vs. domestic), etc. Results present that merger returns are greater than
acquisition returns and same relation is valid for companies performing in same industry line
compared to unrelated business line.
Eceyurt and Serçemeli (2013) concocted their study on a quite smaller group of 5 sample deals completed during 2008-2009. It was detected that in the 360-day (-180,180)
event window, there were no ARs compared to the index. It is more likely to obtain little
36
the main objective of a merger of an acquisition is to make increase the market value. It was
found unlikely to attain this target.
Findings of Çevikçelik’s (2012) are somehow coherent with the previous works. She used 10- and 30-days event window and observed and an increase in the pre-event period.
However, this increase reached the peak value either on the event date or the first post-event
day and started the fall in the following days. Post-event CAAR trends were observed higher
than the pre-event trends. Increase in the pre-event period interpreted as the leakage of the
intercompany information. All in all, it is confirmed that IMKB is not even half-effective and
that is why it is possible to achieve an abnormal return in the short-term period.
Last but not least, Genç and Coşkun (2013) investigated the impact of both M&A deal announcements and completions on the share prices within an 81-day event window.
Results were calculated for both acquirers (138 observations) and targets (76 observations)
for the period 2001-2011. They presented that target shareholder experience more abnormal
returns than the acquirer shareholders. Even though there were calculated positive abnormal
returns, they were not statistically meaningful and not non-zero. CAARs for (-1,0), (0,1) and
37
CHAPTER 4
ANALYSIS OF ACQUIRER RETURNS
4.1 Methodology
4.1.1 Introduction
Event study methodology is used to estimate the influence of a precise economic
incident on the value of the company by utilizing historical financial data. (Campbell et al.,
1996) McWilliams and Siegel (1997) listed the basic assumptions behind event study
methodology as so;
Impact of such an incident will be instantly reflected in the stock prices (efficient-market hypothesis).
There are no insider information leakages and market is informed about the event upon the announcement.
There is no other event affecting the stock prices in the given event window. Fisch et al. (2018) listed the steps to follow to conduct an event study as below:
i. Event(s) subjected to study must be defined and the dates (announcement,
38
ii. Actual returns must be computed for the stocks of the companies in discussion
iii. Expected returns for the same group must be estimated with the help of historical data
iv. ARs (and CAARs, if required) must be computed (ARit = Rit - E(Rit))
v. Finally, in the light of acquired data ARs must be evaluated if the results are
statistically significant.
4.1.2 Brief History on Event Study
Although event study methodology seems like new method, actually it has quite a
long history. It is assumed that the first published work conducted by Dolley (1933). He
analyzed how stock split-ups affect the prices in the light of nominal price alteration during
these splits take place. There is an observed sophistication and complexity increase in the
researches carried out through the 1930s till 1960s. Studies conducted by Myers and Bakay
(1948), Ashley (1962) can be examples of this period. Myers and Bakay (1948) investigated
also the split-up impact on prices, however, unlike Dolley they observed effects before and
after the event to have a more comprehensive understanding. Ashley (1962), on the other
hand, benefited from the event study method in the evaluation of the stock prices with respect
to changes in the earnings and dividends. Nonetheless, current version of the event study
method which is still in use, introduced by Ball and Brown (1968), Fama, Fisher, Jensen, and
Roll (1969). Ball and Brown (1968) examined the utility of existing by exploring their
information content. Fama et al. (1969) concentrated on evaluating the process of stock price
adjustment to the incoming information (such as dividend increases) contained in the stock
split and explaining the impact of stock splits independent from the external factors. These