EGE AKADEMİK BAKIŞ / EGE ACADEMIC REVIEW Doi: 10.21121/eab.536640SS. 323 / 339 Başvuru Tarihi: 3.7.2019 • Kabul Tarihi: 7.4.2019
1*Prof. Dr., Bogazici University, Istanbul, Turkey, [email protected], [email protected], 2Bahçeşehir University , Istanbul, Turkey, [email protected]
Asymmetric Cost Behavior and Acquirer Returns:
Evidence from U.S. Mergers
Asimetrik Maliyet Davranışı ve Alıcıların Getirileri: A.B.D. Birleşmelerinden
Bulgular
Mine UGURLU
1*https://orcid.org/0000-0002-1323-4610
Gamze OZTURK DANISMAN
2https://orcid.org/0000-0003-3684-6692
Seda BILYAY-ERDOGAN
3https://orcid.org/0000-0001-6701-4448
Cigdem VURAL-YAVAS
4https://orcid.org/0000-0002-3440-4762
ÖZET
Bu çalışma alıcıların satış, genel ve yönetim maliyetlerinin asimetrik davranışlarını incelemekle birlikte; “Birleşme ve Satın Alma” performanslarına olan etkisini 1 yıllık olay penceresinden analiz etmektedir. Çalışma A.B.D.’de 2003-2015 yılları arasında tamamlanan 6,888 birleşme ve satın-almaya dayanmakta ve panel veri regresyonları kullanmaktadır. Sonuçlar alıcıların 73%’ünün maliyetlerinin asimetrik davranış sergilediğini göstermektedir. Birleşme duyurusunun ardından maliyet yapışkanlığı ile alıcıların olağandışı getirileri arasında anlamlı ve negatif bir ilişki olduğu saptanmıştır. Piyasadaki rekabet alıcıların getirilerini olumlu etkiler, ancak yapışkan maliyetlerin alıcıların olağandışı getirileri üzerindeki olumsuz etkisini daha da artırır. Ayrıca alıcıların temerrüt riskinin olağandışı getiriler üzerinde anlamlı ve negatif yönde etkisi vardır. Bununla birlikte, temerrüt riskinin getiriler üzerindeki olumsuz etkisi yapışkan olmayan maliyet yapısı olan alıcılar için daha kuvvetlidir. Alıcıların riski rekabetin getiriler üzerindeki pozitif etkisini azaltmaktadır. Bir yıllık olay penceresinden incelendiğinde, yapışkan maliyet yapısına sahip alıcıların yapışkan olmayan maliyet yapısına sahip alıcılara göre daha az olağandışı getirilere sahip olduğu gözlemlenmiştir. Bu çalışma 2003-2015 yılları arasında gerçekleşen birleşmelerde rol alan alıcıların asimetrik maliyet davranışlarını ortaya çıkararak ve alıcı firmaların daha düşük olağandışı getiri elde etmelerine alternatif bir açıklama getirerek literatüre katkıda bulunmuştur.
Anahtar sözcükler: Maliyet asimetrisi, Birleşme
performansı, Alıcı getirileri, Yapışkan olmayan maliyetler, Yapışkan maliyetler
JEL Codes: G34,G32
ABSTRACT
This paper investigates the asymmetric behavior of the selling, general and administrative (SG&A) costs of acquirers, and reveals its effects on mergers & acquisitions (M&A) performance in a one-year event window. It is based on a sample of 6888 M&As completed in the U.S. during the 2003-2015 period and employs panel data regressions. The results show that 73% of the acquirers display asymmetric cost behavior. A significant negative relation is found between cost stickiness and acquirers’ abnormal returns following the merger announcement. Competition in the market for corporate control is positively related with acquirer returns but exacerbates the negative effects of cost-stickiness on abnormal returns of acquirers. The acquirers’ risk of default is significantly negatively related to the abnormal returns they generate. This adverse effect of default risk on returns is stronger for acquirers with anti-sticky costs. Acquirer risk offsets the positive effects of competition on returns. Acquirers with sticky costs have lower abnormal returns than those with anti-sticky costs in a one-year window. The present study contributes to the literature by revealing the asymmetric cost behavior of acquirers involved in merger activity during the last decade, and provides evidence for an alternative explanation for the lower abnormal returns of the acquiring firms.
Keywords: Cost asymmetry, Merger performance,
Acquirer returns, Cost anti-stickiness, Sticky-costs.
JEL Codes: G34, G32
İD
İD
İD
1. Introduction
The seminal paper by Anderson, Banker and Jana-kiraman (2003) [hereby referred to as ABJ], compares the traditional model of cost behavior in which costs move proportionately with changes in the level of activity with an alternative model they develop. In their paper, ABJ propose a model which rests on the premise that sticky selling, general and administrative costs [hereby referred to as SG&A] arise because managers deliberately adjust resources committed to the activities when revenues decrease. ABJ (2003) define costs as sticky if the magnitude of the incre-ase in costs associated with an increincre-ase in volume is greater than the magnitude of the decrease in costs related with an equivalent decrease in volume. Sticky costs may reflect a deliberate retention of resources based on a manager’s expectations that revenue will increase in the future. These expectations may reflect both rational inferences and behavioral biases. Hence, following a prior sales increase or decrease, managers will anticipate future sales changes in the same dire-ction. When managers are optimistic, they are more willing to retain slack in the event of a current sales decrease, enabling them to reduce current adjustment costs such as severance payments to laid-off workers and future adjustment costs such as hiring costs for new employees. A change in the direction of prior sales affects managers’ expectations for future sales and constitutes an important determinant of cost asymmetry.
ABJ (2003) model of cost behavior is refined by Banker, Byzalov, Ciftci and Mashruwala (2014a) who claim that the type of cost asymmetry (stickiness or anti-stickiness) observed in the current period is deter-mined by the direction of prior- period sales change. Thus, conditional on a prior-period sales increase, ma-nagers will be able to retain additional slack, cutting resources less than proportionately. Banker, Byzalov, Ciftci and Mashruwala (2014a) develop two-period and three-period models of cost behavior, showing that optimism increases managers’ willingness to acquire additional resources, when current sales increase, and to retain unused resources when sales decrease; and pessimism has the opposite effect. While most of the evidence rests on the model developed by ABJ (2003), we use three-period BBCM (2014a) model of asymmetric cost behavior which constructs a better classification of managerial expectations.
The objective of this study is to investigate the ef-fects of asymmetric cost behavior on acquirer returns
and examine whether competition in the takeover market and risk of the acquirer tend to affect this relation. The competition in the market for corporate control, may have different implications for various acquirers with sticky costs. If sticky-cost acquirers are optimistic, following a prior period sales increase, they may choose to retain slack resources while engaging in efficiency – increasing mergers in competitive mar-kets. This may result in higher post-merger acquirer returns. On the other hand, competition may lead to higher premium payments to targets, resulting in lower acquirer returns (Alexandridis et al., 2010). Cost stickiness of the acquirer may reduce resource adjustment flexibility of the acquirer, making post in-tegration more difficult, and reducing acquirer returns. Although recent studies show that market competi-tion is an important external mechanism affecting corporate actions, it appears that very little attention has been paid to the impact of competition on returns of acquirers with asymmetric cost behavior. When sales decrease in consecutive periods, the default risk may rise for some corporations. We expect that cost stickiness may result in lower acquirer returns when risk of default rises. So, the second factor included in the study is acquirers’ risk of default. Previous research provides evidence indicating that as the default risk of a firm increases, cost stickiness decreases (Dierynck et al. 2012). We investigate if the default risk of the acquirer, when combined with the sticky cost beha-vior, leads to lower M&A performance and control for its effects.
The first part of this paper displays the asymmetric cost behavior of acquirers involved in 6888 merger transactions in the United States (U.S.) during the 2003-2015 period, using Banker et al. (2014a) three-period model and Weiss’s (2010) measure of cost asymmetry. In the second part, we aim to investigate whether managerial expectations, as measured by the degree of cost stickiness of acquirers, provide an explanation for acquirer’s post-announcement performance, cont-rolling for acquirer and deal characteristics.
The results show that 73% of acquirers display asymmetric cost structure. The majority of these acquirers (90%) display sticky-cost behavior while a small portion (10%) reveals anti-sticky cost behavior. The increase in cost stickiness significantly decreases the one-year cumulative abnormal returns (CARs) generated by the acquirers. The significant negative relationship between cost stickiness and acquirer’s ab-normal returns provides an alternative explanation for
the lower returns observed in the literature generated by acquirers involved in merger transactions.
Competition in the market for corporate control has a favorable impact on abnormal returns of acquirers, but the co-existence of a competitive takeover market exacerbates the adverse effects of cost asymmetry on the abnormal returns of acquirers. Furthermore, the significant positive impact of competition on returns diminishes and becomes significantly negative when the acquirer has a high default risk. In other words, acquirer’s high default risk offsets the positive effect of a competitive market for corporate control. Small acquirers have higher returns supporting Moeller et al., (2004) and deal size is significantly positively related to bidder returns, especially for acquirers with highly sticky costs.
Our study contributes to the literature by provi-ding evidence for an alternative explanation of the lower abnormal gains of the acquirers. The degree of cost asymmetry of the acquirers significantly affects M&A performance. Controlling for competition and acquirer risk, we show that acquirers’ asymmetric cost behavior significantly and negatively affects the ab-normal returns they generate from the merger activity. The significant negative effect of cost asymmetry on abnormal returns is exacerbated when acquirers with sticky SG&A costs operate in a competitive market for corporate control.
2. Literature Review
2.1. Theoretical Models of Asymmetric Cost Behavior
Anderson et al., (2003) compare the traditional model of cost behavior to an alternative view that is based on resource adjustment costs and deliberate managerial decisions and show that the empirical behavior of SG&A costs is inconsistent with the tradi-tional model. They consider SG&A costs “sticky” if the magnitude of the increase in costs associated with an increase in volume is greater than the magnitude of the decrease in costs associated with an equivalent decrease in volume. Anderson et al., (2003) document that when sales decrease, managers prefer to retain some slack resources rather than incur adjustment costs. Managers consider revenue decline more permanent when it occurs in the second consecutive period of revenue losses, less stickiness is expected when revenue declines for two consecutive periods.
BBCM (2014a) refined Anderson et al.’s (2003) sing-le-period model by introducing two and three-period models where the type of asymmetry observed in the current period is determined by the direction of sales change in the prior period. They combined two conditional processes that give rise to a more complex pattern of asymmetry: cost stickiness conditional on a prior sales increase and cost anti-stickiness conditional on a prior sales decrease. Hence, the BBCM (2014 a) two-period model, shows that these two conditional processes lead to cost stickiness in the current period only in the case of a prior sales increase and generates anti-stickiness following a prior sales decrease. In the three-period model, if the sales increase in period t-1 (relative to t-2), then managers acquire needed re-sources in that period and the amount of slack carried over to period t is zero. However, if the sales decrease in period t-1, then managers retain significant slack resources which are carried over to current period t. If sales decrease further in the current period, managers are expected to cut resources proportionately. In this case, costs will rise less for current sales increases than they will fall for current sales decreases, thus exhibi-ting cost anti-stickiness. While this model is useful in the assessment of determinants of cost asymmetry, Weiss’s (2010) alternative measure of cost asymmetry can be used as an explanatory variable to study the impact of cost asymmetry on other outcomes.
Managers tend to be more optimistic (pessimistic) after a prior sales increase (decrease) for two distinct reasons. One is that a prior-period sales brings opti-mistic expectations for future sales and results in a greater likelihood of further increases. On the other hand, a prior sales decrease induces pessimism and brings a higher probability of further decreases. The second reason is that past trends are likely to be ext-rapolated by the managers (Barberis, Shleifer &Vishny, 1998; Daniel, Hirshleifer & Surahmanyam, 1998; Lant & Hurley, 1999).
The three-period model set forth by Banker et al. (2014a) encompasses economic adjustment costs in addition to managers’ agency related adjustment costs. When sales of a company decrease, empire building managers tend to keep their slack resources, while on the other hand when sales of a company increase, these managers choose to acquire new resources (Anderson et al., 2003; Chen et al., 2012). When sales decrease instead of increasing, the perso-nal adjustment costs of managers will drive them to preserve additional slack resources. In addition to this,
it will also result in managers being more aggressive when doing their resource commitments in cases of optimistic expectations for future sales. Hence, the cost asymmetry model becomes applicable in the agency-related adjustment costs framework.
From a behavioral and agency perspective, asy-mmetric cost behavior may result from managerial biases (Calleja, Lu & Thomas, 2006), pessimism, opti-mism (Anderson et al., 2007; BBCM, 2014; Yasukata & Kajiwara, 2011) or overconfidence (Kuang, Mohan, & Qin, 2015). Adjustment costs, including costs and be-nefits that affect the agent’s utility function, should be considered from the agent’s perspective. Social status, reputation and power relate to the size of the entity they manage. Empire building incentives (Chen et al., 2012; Dierycnk et al., 2012; Banker et al., 2014a) and managerial exuberance (Calleja et al., 2006) encourage growth investments and discourage downsizing. As Balakrishnan, Petersen and Soderstrom (2004) and Anderson et al. (2007) suggest, the disutility of overstaffing may be lower than the disutility of un-derstaffing. This incentive of misalignment results in agency problems.
2.2. Evidence on Asymmetric Costs
Banker and Byzalov (2014) provide strong support for the global pervasiveness of asymmetric cost beha-vior. Subsequent studies have extended Anderson et al.’s (2003) predictions of cost stickiness (Weiss, 2010; Chen et al., 2012; Kama & Weiss, 2013) while other studies have predominantly explained cost stickiness in terms of economic factors such as asset intensity, employee intensity and uncertainty of future demand (Anderson et al.,2003; Banker et al, 2014a; Banker et al.,2014b). Studies focusing on agency-related adjust-ment costs provide evidence that agency problems increase SG&A cost asymmetry. Chen et al. (2012) find that cost stickiness partly reflects empire building behavior, which is mitigated by strong corporate go-vernance. Dierynck et al. (2012) and Kama and Weiss (2013) find that cost stickiness is diminished when managers face incentives to meet an earnings target.
Various studies provide evidence on the impli-cations of cost behavior for fundamental analysis. Anderson et al. (2007) propose an earnings prediction model and find that future earnings are positively re-lated to increases in SG&A cost to sales ratio in periods of revenue declines. Other studies document myopic activities related to earnings management, sacrificing employee morale and long-term value creation to
meet short-term targets (Banker and Byzalov, 2014; Dierynck et al., 2012; Kama & Weiss, 2013). Thus, when sales decrease, a decreasing SG&A ratio is an ambiguous signal, as it may indicate either efficient or inefficient cost control.
2.3. Acquirers Cost Behavior and Performance of Mergers and Acquisitions
Although there is extensive research on M&A per-formance, studies investigating the effects of acquirers’ cost behavior on post-M&A returns are rare. A recent study reveals that acquirers with low pre-acquisition cost stickiness are better acquirers than those with high cost-stickiness as reflected by deal announce-ment returns (Jang, Yehuda & Radhakrishnan, 2017). The authors find that less sticky acquirers have higher resource adjustment flexibility, earn higher abnormal returns, and purchase more intangible-intensive tar-gets. Their evidence rests on ABJ’s (2003) model and 3-day CARs around the acquisition announcement date.
Alexandridis et al. (2012) reveal that acquirers continue to realize significant losses around the acqu-isition announcements and destroy more value than in the past. Authors claim that a potential explanation for the lower returns in the sixth merger cycle is based on investor sentiment. Rosen (2006) found that short-run abnormal returns to acquirers are higher during perio-ds that are preceded by more investor over-optimism. M&A performance is the focus of study in nume-rous disciplines, the conclusions of which are varied. Evidence shows that M&A performance assessment is sensitive to the definition of performance, the met-hodology selected, the sample and the time-horizon used. Some acquisitions may be considered succes-sful when using CARs but unsuccessucces-sful when using accounting ratios (Betzer, Doumet & Goergen, 2015; Wang & Moini, 2012). This happens because different measures emphasize different aspects of the organiza-tion (Meglio & Risberg, 2011. Using a global data-set, Alexandridis, Petmezas and Travlos (2010) find that acquirers outside the most competitive takeover markets (specifically the U.S., the U.K. and Canada) pay lower premiums and realize more gains whereas target shareholders in these markets gain significantly less. They find that the premium paid, the gains of the acquirer and the target are related to variations in the competitiveness of the M&A market.
3. Empirical Design
In the first part of the paper, the acquirers are clas-sified into categories of cost asymmetry, employing the three-period BBCM (2014a) model. Furthermore, the Weiss measure of cost-stickiness is used to verify Banker et al.’s (2014a) classification of cost asymmetry.
The second part focuses on the impact of cost stickiness on acquirer returns. High cost stickiness may result in lower resource flexibility which may make post-M&A integration more difficult and lead to lower acquirer returns. Acquirer risk and competition
in the market for corporate control may either mitigate or exacerbate the effect of asymmetric SG&A costs on acquirer returns when controlling for deal and acquirer characteristics that may affect this relation.
3.1. The BBCM (2014a) Model of SG&A Behavior and M&A Performance
Most of the empirical literature on cost stickiness builds on Anderson et al.’s (2003) model, which is based on a piecewise-linear relationship between log-changes in SG&A costs and concurrent log-chan-ges in sales:
(Eq.1)
where is the
log-change in the SG&A costs of the acquirer i in year is the log-change in sales revenue, is a sales decrease dummy, equal to 1 if < 0 and zero otherwise, and is an error term. Where the slope coefficient shows the percentage change in SG&A costs for a one percent sales increase, the coefficient captures the degree of asymmetry in cost response to sales decreases versus increases. Cost stickiness implies that is negative which indicates that costs fall to a lesser extent for a one percent sales decrease than they rise for an
equi-valent sales increase ( ).
Subsequent research on cost stickiness has used further extensions of the ABJ model (Banker & Byzalov, 2014). Owing to its single-period nature, the ABJ model does not clearly distinguish between the underlying processes of conditional stickiness and anti-stickiness. Therefore, Banker et al. (2014a), in their refined model, propose two and three-period models, where the slopes and are estimated conditional on the directions of sales changes in one prior period and two prior periods, respectively.
In our analysis, we use their three period model to distinguish stickiness and anti-stickiness in our sample as shown in equation (2):
(Eq.2)
where is a dummy variable for a sales increase (decrease) in year t−2 relative to year t−3, and is a dummy variable for a sales increase (decrease) in year t−1 relative to year t−2.
Similar to the BBCM (2014) model (Equation 2), we observe strong stickiness in the “pure” optimistic case , strong anti-stickiness in the pure pessimistic case and no significant effects of stickiness or anti-stickiness on log-changes in SG&A costs, respectively, in the corresponding
“mixed” cases in
our sample.
However, as stated in Banker and Byzalov (2014), equation (2) is more appropriate when the resear-cher’s objective is to examine the determinants of cost stickiness. Since we expect to observe strong stickiness in only the pure optimistic case and strong anti-stickiness in only the pure pessimistic case, we compare the effect of acquirer risk and competition on M&A performance in sticky cost vs. anti-sticky cost sub-samples and see how cost stickiness affects these relationships. Specifically, we conduct our analysis based on a sticky-cost subsample with prior two
period sales increase where and an
decrease where and exclude mixed
cases and from
our sample.
We regress M&A performance on the independent variables of interest (acquirer risk and competition)
and control variables that are related to the deal and acquirer characteristics for these two subsamples and use the following Models (1-3) in order to gain further insight into our research questions:
Model (1)
Model (2)
Model (3)
3.2. Weiss Measure of Cost Behavior and M&A Performance
After revealing the asymmetric cost behavior of acquirers in the first part, we investigate the impact of cost stickiness on acquirers’ CARs in a one-year event window employing the cost asymmetry measure proposed by Weiss (2010). The main benefit of this
measure is that it can act as an explanatory variable in investigating the impact of cost asymmetry on other outcomes (Banker & Byzalov, 2014). Therefore, we de-velop Models (4-7) , using Weiss’s (2010) cost stickiness measure along with some interaction variables, to gain further insights to the effects of cost asymmetry on acquirer returns: Model (4) Model (5) Model (6) Model (7)
We conduct regression analyses employing these models (Models 1-7) using pooled cross-sectional, time-series data with clustered standard errors at the acquirer level to control for cross-sectional depen-dence (Petersen, 2009). We include fixed effects for industries and years.
4. Sample, Data and Methodology
4.1. Data and Sample
Data is collected from Thomson Reuters Eikon database, with the announcement dates of completed mergers and acquisition transactions between January 1, 2003, and December 31, 2015. The sample period starts with the year 2003 because older data was not available and 2015 was the latest available data at the time of its collection. In order to be included in the sample, the following criteria must be satisfied:
Acquiring firms are U.S. firms that are publicly quoted on the AMEX, NASDAQ, or NYSE that have both return information and financial statement informati-on available informati-on Thomsinformati-on Reuters Eikinformati-on database. The deal value is at least one million dollars.
- The percentage of target acquired by the acquirer is at least 50%.
- Both “sales” and “SG&A expenses” are non-ne-gative and SG&A costs do not exceed sales.
- Information regarding the Sales and SG&A ac-counts of acquirers should be available within at least a 2-year period in advance to the M&A transaction.
- Only firms performing in the non-financial sector are included and industrial classification is based on their 2-digit SIC codes.
- The study is based on domestic acquisitions that involve U.S. acquirers and targets.
All data is adjusted for inflation using the consumer price index, stemming from the fact that the theory of sticky costs concerns real changes in activity. Therefo-re, all data dealt with is converted into their real values. Furthermore, all continuous variables are truncated at the top and bottom 1% in order to get rid of extreme observations. So, after all the above filtering is comp-leted, the population of 97,495 M&A’s over the period is reduced to a sample of 6,888 M&As.
The first part of our analysis, where we investigate whether acquirers exhibit asymmetric cost behavior, employs a sample of 6888 domestic U.S. acquisitions between 2003 and 2015. The regression analyses in the next section aim to reveal the effects of cost asymmetry on acquirers’ returns and rely on two subsamples that are formed using the BBCM (2014a) model: a sticky-cost subsample (comprised of 4,377 acquisitions) with a prior two- period sales increase, and an anti-sticky cost subsample (comprised of 507 acquisitions) with a prior two-period sales decrease. We exclude the mixed cases which are insignificant. The industry breakdown of the sample is given in Appendix Table AI.
4.2. Variables and Descriptives
Cost asymmetry measure employing the BBCM (2014a) three-period model, as shown in equation (2) above, is used. The descriptives of this model are summarized in Table II.
Weiss Cost Stickiness Measure: The second cost
asy-mmetry measure is developed using the Weiss (2010) model. We estimate the difference between the rate of cost decrease for the previous four consecutive years with decreasing sales, and the corresponding rate of cost increase for the previous four consecutive years with increasing sales:
(Eq 3) where is the most recent of the previous four
years with a consecutive decrease in sales and is the most recent of the previous four years with a conse-cutive increase in sales,
and .
If costs are sticky, meaning that they increase more when activity rises than they decrease when activity falls by an equivalent amount, the Weiss measure has a negative value. Therefore, a lower and negative value of this measure expresses more sticky cost behavior.
However, in order to ease the interpretation of results, we multiply Weiss measure by (-1) so that higher values of the measure indicate more sticky behavior.
Since Weiss measure can be computed only for firms that have both a sales increase and a sales decrease in the previous four consecutive periods and the sample has to be restricted to observations for which sales and costs change in the same direction; we encounter substantial data loss in constructing this measure as Banker and Byzalov (2014) indicated.
For instance, as displayed in Table II, we are able to calculate this measure for 354 acquisitions, with an average of -0.03.
M&A performance measure: We employ the
cu-mulative abnormal return (CAR) as the stock market based measure of M&A performance (Moeller et al., 2004; Alexandridis et al., 2010; Jang et al., 2017). A one-year (-1, + 1) event window is used with the con-sideration that financial markets are forward-looking and that the effects of M&A’s will be captured around the announcement date. Moreover, the uncertainties are expected to be eliminated during the days, and months following the merger, implying that the merger effects will be fully reflected in the stock pri-ces within one year. Given that a long event window
may incorporate the impact of confounding events, the stability of stock price, which is the requirement of a long-term event study, is difficult to meet. So we employ a short-term event study (< 1 year) as defined by Meglio and Risberg (2011) who point out that most research in this area uses short-term event windows.
Cumulative Abnormal Return (CAR): CAR is the acquirer’s 1-year cumulative abnormal returns around the acquisition announcement date, capturing any expected value changes in the acquirer. Abnormal stock return is defined as the difference between the acquirer stock return and the MSCI USA Value-Weigh-ted Index.
Other Variables: Acquirer and deal related control
variables are displayed in Table I. Table I: Variables and Measures
Variable Calculation
Riskiness of the Acquirer
Altman (1968) z-score
High Risk = 1 when change in z-score between t+1 and t-1 is below the median
and 0 otherwise
Competition
For each industry group, an index is calculated through dividing the number of listed acquired firms in an industry to the total number of listed firms in that industry (Alexandridis et al., 2010)
High competition = 1 when the competition index is above the median and 0 otherwise
Acquirer related Control variables
Size ln (total assets of the acquirer)
Leverage* ln (Book value of debt / Book Value of assets of the acquirer)
CAPEX CAPEX / Total Assets
Deal related Control Variables
Payment method of the M&A Acquisition
Cash (CASH) or stock (STOCK)
Dummy variable= 1 if the payment of the M&A is conducted in Cash
and 0 if stock is used
Relative size of the deal* Deal value / Total assets of the Acquirer
Target Status 4 categories are present: public, private, subsidiary and joint venture, 3 dummies are included in the regressions
Horizontal vs. Vertical M&A’s
In horizontal M&A’s: Acquirer and target function in the
same line of business, and have the same primary two-digit industry codes.
In vertical M&As: Acquirer and target belong to different primary two-digit industry codes.
*Due to high skewness, these variables are taken in logs to smooth out the largest values The descriptive statistics of the variables used in the study are presented in Table II.
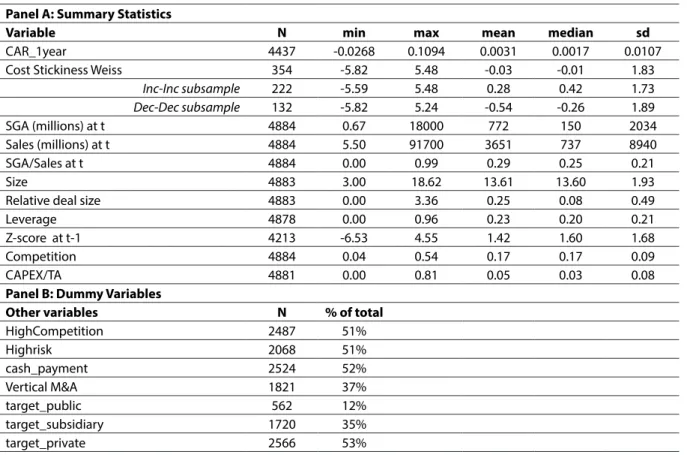
Table II: Descriptive Statistics
Panel A: Summary Statistics
Variable N min max mean median sd
CAR_1year 4437 -0.0268 0.1094 0.0031 0.0017 0.0107
Cost Stickiness Weiss 354 -5.82 5.48 -0.03 -0.01 1.83
Inc-Inc subsample 222 -5.59 5.48 0.28 0.42 1.73 Dec-Dec subsample 132 -5.82 5.24 -0.54 -0.26 1.89 SGA (millions) at t 4884 0.67 18000 772 150 2034 Sales (millions) at t 4884 5.50 91700 3651 737 8940 SGA/Sales at t 4884 0.00 0.99 0.29 0.25 0.21 Size 4883 3.00 18.62 13.61 13.60 1.93
Relative deal size 4883 0.00 3.36 0.25 0.08 0.49
Leverage 4878 0.00 0.96 0.23 0.20 0.21
Z-score at t-1 4213 -6.53 4.55 1.42 1.60 1.68
Competition 4884 0.04 0.54 0.17 0.17 0.09
CAPEX/TA 4881 0.00 0.81 0.05 0.03 0.08
Panel B: Dummy Variables
Other variables N % of total
HighCompetition 2487 51% Highrisk 2068 51% cash_payment 2524 52% Vertical M&A 1821 37% target_public 562 12% target_subsidiary 1720 35% target_private 2566 53% 5. Results
5.1 Asymmetric Cost Behavior of Acquirers
The models of cost behavior used in the present study reflect that there are differences between acqu-irers with respect to the stickiness of their SG&A costs. The results of the analyses employing the BBCM (2014) model are reported in Table III.
5.2 Univariate Test Results
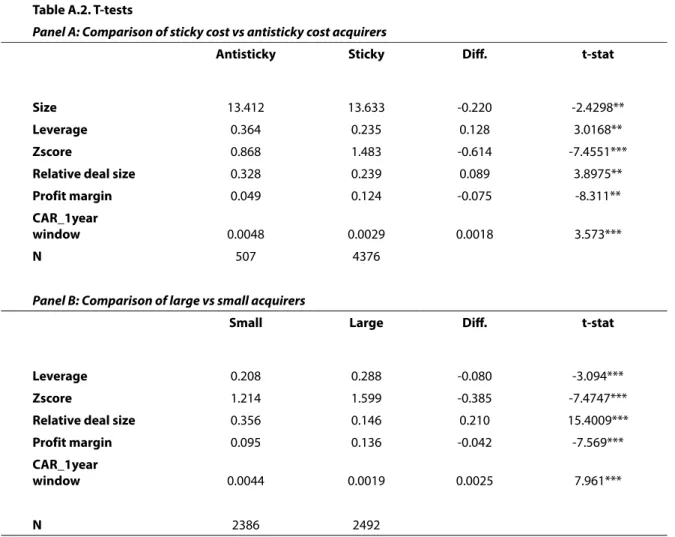
T-test analyses, in Appendix Table A.II- Panel A, indicate that sticky-cost acquirers are larger and less distressed, use lower leverage and are more profitable than acquirers with anti-sticky costs. The CARs of sti-cky-cost acquirers are significantly lower than those of acquirers with anti-sticky SG&A costs in the one-year window around M&A announcement date.
Table III: Three Period Model (Banker et al., 2014a)
Dep. Variable: ∇lnSG&Ait
It-2 x It-1 x ∇LnSALESit 0.597*** (38.22) It-2 x It-1 x Dt x ∇LnSALESit -0.397*** (-7,64) Dt-2 x It-1 x ∇LnSALESit 0.365*** (21.92) Dt-2 x It-1 x Dt x ∇LnSALESit 0.058 (0.67) It-2 x Dt-1 x ∇LnSALESit 0.427*** (23.7) It-2 x Dt-1 x Dt x ∇LnSALESit -0.081 (-0,98) Dt-2 x Dt-1 x ∇LnSALESit 0.406*** (18.27) Dt-2 x Dt-1 x Dt x ∇LnSALESit 0.449*** (5.5) N 6,700 R2 29.49% Adj. R2 29.40%
***, **, and * indicates statistically significant levels of 1%, 5% and 10%, respectively. The numbers in parentheses are the t-statistics, based on standard errors clustered by firm.
Furthermore, t-tests, in Table A.II Panel B, in the appendix, reveal that small and large acquirers have different characteristics. Large acquirers use higher le-verage, are more profitable and have lower cumulative abnormal returns.
5.3. Multivariate Test Results
5.3.1. Effects of Competition and Bidder Risk on Acquirer Performance: Sticky-cost and Anti-sticky Cost Cases
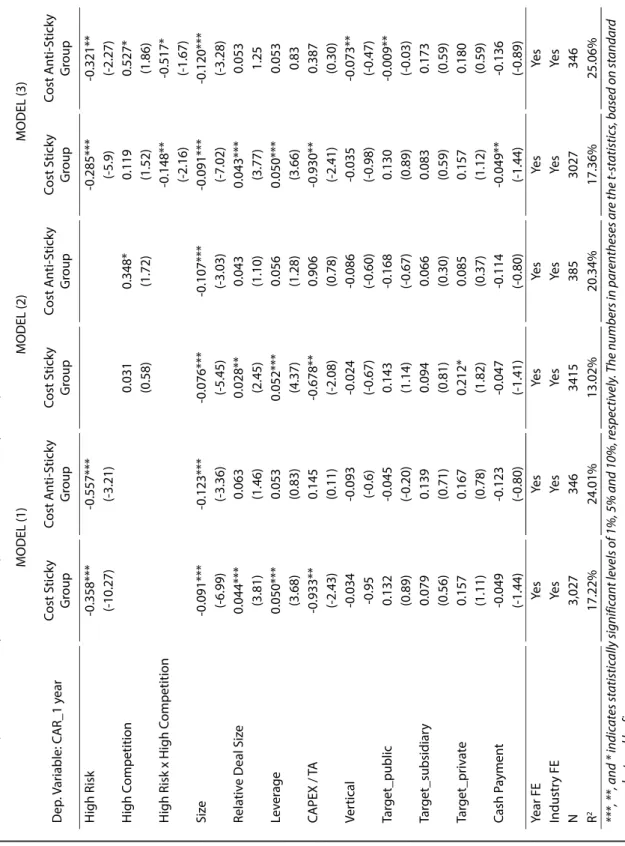
The regression analyses for the two groups of acquirers (sticky cost and anti-sticky cost acquirers), are presented in Table IV.
Table IV : C ompar ison of S tick y – Cost Gr oup v s. C ost A nti-S tick y Gr oup C ARs MODEL (1) MODEL (2) MODEL (3) D ep . V ar iable: C AR_1 y ear Cost S tick y Gr oup Cost A nti-S tick y Gr oup Cost S tick y Gr oup Cost A nti-S tick y Gr oup Cost S tick y Gr oup Cost A nti-S tick y Gr oup H igh R isk -0.358*** -0.557*** -0.285*** -0.321** (-10.27) (-3.21) (-5.9) (-2.27) H igh C ompetition 0.031 0.348* 0.119 0.527* (0.58) (1.72) (1.52) (1.86) H igh R isk x H igh C ompetition -0.148** -0.517* (-2.16) (-1.67) Siz e -0.091*** -0.123*** -0.076*** -0.107*** -0.091*** -0.120*** (-6.99) (-3.36) (-5.45) (-3.03) (-7.02) (-3.28) Rela tiv e D eal Siz e 0.044*** 0.063 0.028** 0.043 0.043*** 0.053 (3.81) (1.46) (2.45) (1.10) (3.77) 1.25 Lev er age 0.050*** 0.053 0.052*** 0.056 0.050*** 0.053 (3.68) (0.83) (4.37) (1.28) (3.66) 0.83 CAPEX / T A -0.933** 0.145 -0.678** 0.906 -0.930** 0.387 (-2.43) (0.11) (-2.08) (0.78) (-2.41) (0.30) Ver tical -0.034 -0.093 -0.024 -0.086 -0.035 -0.073** -0.95 (-0.6) (-0.67) (-0.60) (-0.98) (-0.47) Tar get_public 0.132 -0.045 0.143 -0.168 0.130 -0.009** (0.89) (-0.20) (1.14) (-0.67) (0.89) (-0.03) Tar get_subsidiar y 0.079 0.139 0.094 0.066 0.083 0.173 (0.56) (0.71) (0.81) (0.30) (0.59) (0.59) Tar get_pr iv at e 0.157 0.167 0.212* 0.085 0.157 0.180 (1.11) (0.78) (1.82) (0.37) (1.12) (0.59) Cash P aymen t -0.049 -0.123 -0.047 -0.114 -0.049** -0.136 (-1.44) (-0.80) (-1.41) (-0.80) (-1.44) (-0.89) Year FE Ye s Ye s Ye s Ye s Ye s Ye s Industr y FE Ye s Ye s Ye s Ye s Ye s Ye s N 3,027 346 3415 385 3027 346 R 2 17.22% 24.01% 13.02% 20.34% 17.36% 25.06% ***, **, and * indic at es statistic ally signific ant lev els of 1%, 5% and 10%, r esp ec tiv ely . T he n umb ers in par entheses ar e the t-statistic s, based on standar d err ors clust er ed b y firm.
The default risk of the acquirers tends to reduce the CARs significantly in both groups as shown in both Model (1) and Model (3). However, acquirer default risk has a significantly stronger negative effect on returns of acquirers with anti-sticky costs. Thus, the perfor-mance of bidders with anti-sticky costs deteriorates faster when the acquirer has a high default risk.
Competition seems to have a weak positive effect on returns, only for acquirers with anti-sticky costs as displayed in Model (2) and Model (3). The high competition in the market for corporate control tends to increase the premium paid to targets and the reduction of SG&A costs in the anti-sticky cost group of acquirers offsets the significant negative effects of premium payments, leading to positive effects on CARs, supporting Alexandridis et al. (2010).
The joint effects of acquirer risk and competition in the takeover market seem to be significantly and ne-gatively related to acquirer returns for all acquirers as shown in Model (3). Hence, high default risk mitigates the benefits of competition in the market. Acquirers with a high default risk have lower gains when the competition in the market increases. This effect is stronger for acquirers with anti-sticky cost behavior.
Acquirer size is significantly negatively related to CAR in all the regressions. This supports evidence from Moeller et al. (2004) who claim that small acquirers have higher returns. Capital expenditures (CAPEX) significantly reduce returns of sticky-cost acquirers in all models, but do not have significant effects on anti-sticky group returns. The coefficients of vertical mergers and cash payments are negative in all regres-sions but are significant only in Model (3). Acquisitions of private targets seem to increase CARs but this is sig-nificant only in Model (2) for the sticky-cost acquirers. Deal size is significantly positively related to abnormal returns of acquirers and sticky-cost acquirers that undertake large deals seem to generate significantly higher returns. This relationship is insignificant for bidders with anti-sticky costs. Leverage is significantly positively related to CARs in all the regressions, but the coefficients are significant only for sticky-cost acquirers. Further analyses show that leverage raises the abnormal returns of the sticky-cost acquirers, but is not significantly related to the returns of acquirers with anti-sticky cost behavior. Thus, leverage and relative deal size appear to have significant positive effects on returns of acquirers with sticky costs. These findings are consistent in all models.
Overall, our findings for two groups of acquirers (sticky cost and anti-sticky cost acquirers) imply that the default risk of the acquirers tends to reduce the CARs significantly in both groups. Competition in the market increases CARs for acquirers with anti-sticky costs. Besides, the joint effects of acquirer risk and competition in the takeover market significantly dec-reases acquirer returns for both groups of acquirers. Hence, high default risk mitigates the benefits of competition in the market.
5.3.2 Asymmetric Cost Behavior and Acquirer Performance –Weiss Measure Results
In the second part of this study, the effect of cost behavior on acquirer returns is investigated using the Weiss measure (2010) of cost stickiness. As displayed in descriptive statistics in Table II, the sticky group has a higher mean (0.2755) than anti-sticky cost group (-0.54) which justifies the aforementioned sticky and anti-sticky classification of acquirers based on the BBCM (2014) model. Hence, both models produce consistent classification of the sample. Moreover, the correlation coefficients between the variables are low and there is no multicollinearity.
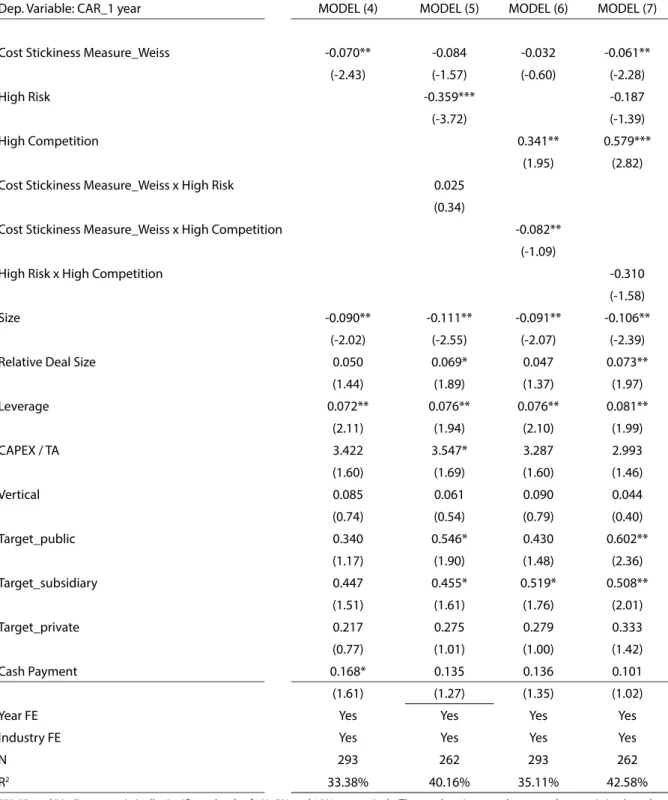
The results of Models (4-7) that use Weiss (2010) measure of cost stickiness and CAR as a measure of merger performance are displayed in Table V. Our findings indicate that cost stickiness has a significant and negative effect on acquirers’ CARs in models (4) and (7). Therefore, managerial optimism or pessimism leads to asymmetric cost behavior in M&A transactions which in turn reduces their abnormal returns.
The results of Table V further reveal that acquirer default risk tends to reduce CARs and that competition tends to increase it, confirming previous findings (see Section 5.3.1). As detected in Model (6), competi-tiveness of takeover markets seem to be strongly positively related to bidder returns which implies that the synergy gains of acquirers compensate for the premiums paid to targets. Furthermore, competition serves as a disciplining device for managers and leads them to undertake value-increasing acquisitions. When the joint effect of cost stickiness and competi-tion is analyzed, cost stickiness tends to mitigate or even reverse the positive effect of competition on the abnormal returns of acquirers. On the other hand, the joint effect of
Table V: The Effect of Cost Stickiness on CAR- Weiss Measure
Dep. Variable: CAR_1 year MODEL (4) MODEL (5) MODEL (6) MODEL (7)
Cost Stickiness Measure_Weiss -0.070** -0.084 -0.032 -0.061**
(-2.43) (-1.57) (-0.60) (-2.28)
High Risk -0.359*** -0.187
(-3.72) (-1.39)
High Competition 0.341** 0.579***
(1.95) (2.82)
Cost Stickiness Measure_Weiss x High Risk 0.025
(0.34)
Cost Stickiness Measure_Weiss x High Competition -0.082**
(-1.09)
High Risk x High Competition -0.310
(-1.58)
Size -0.090** -0.111** -0.091** -0.106**
(-2.02) (-2.55) (-2.07) (-2.39)
Relative Deal Size 0.050 0.069* 0.047 0.073**
(1.44) (1.89) (1.37) (1.97) Leverage 0.072** 0.076** 0.076** 0.081** (2.11) (1.94) (2.10) (1.99) CAPEX / TA 3.422 3.547* 3.287 2.993 (1.60) (1.69) (1.60) (1.46) Vertical 0.085 0.061 0.090 0.044 (0.74) (0.54) (0.79) (0.40) Target_public 0.340 0.546* 0.430 0.602** (1.17) (1.90) (1.48) (2.36) Target_subsidiary 0.447 0.455* 0.519* 0.508** (1.51) (1.61) (1.76) (2.01) Target_private 0.217 0.275 0.279 0.333 (0.77) (1.01) (1.00) (1.42) Cash Payment 0.168* 0.135 0.136 0.101 (1.61) (1.27) (1.35) (1.02)
Year FE Yes Yes Yes Yes
Industry FE Yes Yes Yes Yes
N 293 262 293 262
R2
33.38% 40.16% 35.11% 42.58%
***, **, and * indicates statistically significant levels of 1%, 5% and 10%, respectively. The numbers in parentheses are the t-statistics, based on standard errors clustered by firm.
cost stickiness and acquirer default risk does not have a significant impact on the abnormal returns of acquirers.
In all the models employing Weiss measures of stickiness, small bidders have significantly higher
CARs and thus support Moeller et al. (2004). Leverage significantly positively effects bidder returns in all the models supporting our previous analyses. Relative deal size is significantly positively related to acquirers’ abnormal returns in Models (5) and (7). Therefore,
the regressions that employ Weiss measures strongly support the results documented in Table IV which are based on the BBCM (2014) classification of cost asymmetry.
Overall, our findings using Weiss measure of cost asymmetry imply that cost stickiness of acquirers has a significant and negative effect on CARs. Higher default risk significantly decreases CARs and competition increases it, confirming findings in Section 5.3.1. When the joint effect of cost stickiness and competition is analyzed, cost stickiness tends to mitigate or even reverse the positive effect of competition on the abnormal returns of acquirers.
5.3.3 Robustness of Results
For robustness tests, we employ a control group comprised of acquirers that do not exhibit significant asymmetric cost behavior. The control group is selec-ted from the categories of the BBCM (2014) three-pe-riod model in which no significant effects of stickiness and anti-stickiness were observed, i.e. the “mixed”
cases and
. We then investigate the effect of cost stickiness, using the Weiss (2010) cost asymmetry measure, on M&A performance as measured by CARs and using a one-year event window. Our results indicate that cost stickiness has no significant effect on M&A performan-ce for this control group, validating the robustness of our findings1.
6. CONCLUSION
This paper investigates the asymmetric cost behavior of U.S. acquirers involved in M&A activity during the 2003-2015 period, using BBCM (2014a) three-period model and the Weiss (2010) measure of cost asymmetry, and reveals the effects of asymmetric cost behavior on acquirers’ returns. The results show that 73% of acquirers display asymmetric SG&A cost structure. The majority of these acquirers (90%) display sticky-cost behavior while a small portion (10%) reveals anti-sticky cost behavior. The increase in cost stickiness significantly decreases the one-year cumulative abnormal returns (CARs) generated by the acquirers. The univariate analyses show that the abnormal returns of the sticky-cost acquirers are signi-ficantly lower than bidders with anti-sticky costs in the one-year window around the merger announcement. Because the competition in the market for corpo-rate control and acquirers’ risk of default tend to affect 1The analyses will be presented upon request.
acquirers’ returns, these variables are expected to moderate the effect of cost-stickiness on post-merger acquirer returns. The results of the regression analyses that employ the two groups, sticky-cost and anti-sti-cky cost acquirers, show that the default risk of the acquirers tends to reduce the CARs significantly in both groups.
The joint effects of acquirer risk and competition in the takeover market significantly decreases acquirer returns for both groups of acquirers. The high negative coefficient of the interaction term indicates that the default risk of the acquirers offsets the positive effect of competition on acquirers’ abnormal returns, the effect being stronger for acquirers with anti-sticky costs. Therefore, managerial pessimism leading to cost anti-stickiness makes acquirers’ returns more vulnerable to variations in default risk, especially when the market for corporate control is highly competitive. The analyses that employ Weiss measure of stickiness indicate that as cost stickiness rises, CARs of acquirers drop significantly. Competition in the takeover market is significantly positively related to acquirer returns. This finding supports Alexandridis et al. (2012) who find evidence that mergers in recent years have involved lower premiums, indicating more rational behavior. It seems that high competition in the takeover market serves as a disciplining device for ma-nagers and leads them to undertake value-increasing acquisitions rather than empire building investments. Another explanation may be that firms that are under competitive pressures obtain synergy gains from their mergers which may offset the premiums paid to targets. When the joint effect of cost stickiness and competition is analyzed, cost stickiness tends to miti-gate or even reverse the positive effect of competition on the abnormal returns of acquirers. Furthermore, the results indicate that the default risk of acquirers significantly reduces their abnormal returns.
This study contributes to the literature in several ways. It provides an alternative explanation for the low post-merger abnormal returns of the acquirers which is prevalent in M&A transactions. It shows that (a) managerial optimism or pessimism that is reflec-ted in stickiness of SG&A costs ,leads to asymmetric cost behavior of acquirers which in turn reduces their abnormal returns; (b) the negative effect of cost stickiness on acquirers’ abnormal returns is stronger in a competitive market for corporate control, and mitigates the positive effects of competition; (c)
acquirers with anti-sticky costs are more vulnerable than sticky-cost acquirers to changes in default risk and competition in the market for corporate control.
Although the usage of the Weiss (2010) model of cost asymmetry reduces the sample size to a large extent due to the calculation requirements of the measure, it is very significant to capture it as it lets cost stickiness to be used as an explanatory variable in the analyses. This research relies on data from M&A
transa-ctions in the U.S. where a competitive takeover market exists and the results provide a new insight to the analysis of post-merger acquirer returns. The study can be extended to cross-border mergers, to reveal how the effects of asymmetric cost behavior on acquirer gains or losses differ in settings with varying degrees of competition in the market for corporate control. Furthermore, integrating target firm characteristics as control variables may add a different perspective that remains to be investigated in further research.
REFERENCES
Alexandridis, G., Petmezas, D., & Travlos, N.G. (2010). Gains from mergers and acquisitions around the world: New evidence, Financial Management,
39, 1671–1695.
https://doi.org/10.1111/j.1755-053X.2010.01126.x
Alexandridis, G., Mavrovitis, C.F., & Travlos, N.G. (2012). How have M&As changed? Evidence from the sixth merger wave, The European Journal of Finance,
18, 663–688. https://doi.org/10.1080/135184
7X.2011.628401
Altman, E. I. (1968). Financial ratios, discriminant anal-ysis and the prediction of corporate bankruptcy,
The Journal of Finance, 23, 589–609. https://doi.
org/10.1111/j.1540-6261.1968.tb00843.x
Anderson, M., Banker, R., Huang, R., & Janakiraman, S. (2007). Cost behavior and fundamental analysis of SG&A Costs, Journal of
Account-ing, Auditing & Finance, 22, 1–28. https://doi.
org/10.1177/0148558X0702200103
Anderson, M.C., Banker, R.D., & Janakiraman, S.N. (2003). Are selling, general, and administrative costs “sticky”?, Journal of Accounting Research, 41, 47–63. https://doi.org/10.1111/1475-679X.00095
Asquith, P., Bruner, R.F., & Mullins, D.W. (1983). The gains to bidding firms from merger, Journal of
Financial Economics, 11, 121–139. https://doi.
org/10.1016/0304-405X(83)90007-7
Balakrishnan, R., Petersen, M.J., & Soderstrom, N.S. (2004). Does capacity utilization affect the “stickiness” of cost?, Journal of Accounting,
Auditing & Finance, 19, 283–300. https://doi.
org/10.1177/0148558x0401900303
Banker, R.D., & Byzalov, D. (2014). Asymmetric cost be-havior, Journal of Management Accounting Research,
26, 43–79. https://doi.org/10.2308/jmar-50846
Banker, R.D., Byzalov, D., Ciftci, M., & Mashruwala, R. (2014a). The moderating effect of prior sales chang-es on asymmetric cost behavior, Journal of
Manage-ment Accounting Research, 26, 221–242. https://doi.
org/10.2308/jmar-50726
Banker, R.D., Byzalov, D., & Plehn-Dujowich, J.M. (2014b). Demand uncertainty and cost behavior,
The Accounting Review, 89, 839–865. https://doi.
org/10.2308/accr-50661
Banker, R.D., & Chen, L.T. (2006). Predicting earnings using a model based on cost variability and cost stickiness, The Accounting Review, 81, 285–307. https://doi.org/10.2308/accr.2006.81.2.285
Banker, R.D., Huang, R., & Natarajan, R. (2011). Equity incentives and long-term value created by SG&A expenditure, Contemporary Accounting Research,
28, 794–830.
https://doi.org/10.1111/j.1911-3846.2011.01066.x
Barberis, N., Shleifer, A., & Vishny, R. (1998). A model of investor sentiment, Journal of Financial Economics,
49, 307–343. https://doi.org/10.1016/S0304-405X(98)00027-0
Bargeron, L., Schlingemann, F., Stulz, R., & Zutter, C. (2008). Why Do Private Acquirers Pay So Little Compared to Public Acquirers?, Journal of Financial
Economics, 89, 375–390. https://doi.org/10.1016/j.
jfineco.2007.11.005
Betzer, A., Doumet, M., & Goergen, M. (2015). Disentan-gling the Link Between Stock and Accounting Performance in Acquisitions, The European Journal
of Finance, 21, 755–771. https://doi.org/10.1080/13
51847X.2014.890633.
Bhabra, H.S. & Hossain, A.T. (2017). Impact of SOX on the Returns to Targets and Acquirers in Corporate Ten-der Offers, The North American Journal of Economics
and Finance, 42, 1–19. https://doi.org/10.1016/j.
najef.2017.06.001.
Calleja, K., Steliaros, M., & Thomas, D.C. (2006). A Note on Cost Stickiness: Some International Comparisons,
Management Accounting Research, 17, 127–140.
https://doi.org/10.1016/j.mar.2006.02.001.
Campa, J.M. & Hernando, I. (2004). Shareholder Value Creation in European M&As, European Financial
Management, 10, 47–81, https://doi.org/10.1111/
j.1468-036X.2004.00240.x
Chen, C.X., Gores, T., & Nasev, J. (2013). Managerial Overconfidence and Cost Stickiness, SSRN Scholarly Paper No. ID 2208622, Social Science Research
Net-work, Rochester, NY.
Chen, C.X., Lu, H., & Sougiannis, T. (2012). The Agency Problem, Corporate Governance, and the Asym-metrical Behavior of Selling, General, and Adminis-trative Costs: The Agency Problem and SG&A Costs,
Contemporary Accounting Research, 29, 252–282.
https://doi.org/10.1111/j.1911-3846.2011.01094.x. Daniel, K., Hirshleifer, D., & Subrahmanyam, A. (1998).
In-vestor Psychology and Security Market Under- and Overreactions, The Journal of Finance, 53, 1839–1885. https://doi.org/10.1111/0022-1082.00077.
Dierkens, N. (1991). Information Asymmetry and Equity Issues, The Journal of Financial and Quantitative
Analysis, 26, 181. https://doi.org/10.2307/2331264.
Dierynck, B., Landsman, W.R., & Renders, A. (2012). Do Managerial Incentives Drive Cost Behavior? Evidence about the Role of the Zero Earnings Benchmark for Labor Cost Behavior in Private Bel-gian Firms, The Accounting Review, 87, 1219–1246. https://doi.org/10.2308/accr-50153.
Furfine, C.H., & Rosen, R.J. (2011). Mergers Increase De-fault Risk, Journal of Corporate Finance, 17, 832–849. https://doi.org/10.1016/j.jcorpfin.2011.03.003. Jang, Y., Yehuda, N., & Radhakrishnan, S. (2017).
Asymmetric Cost Behavior and Value Creation in M&A Deals, SSRN Electronic Journal. https://doi. org/10.2139/ssrn.2824132.
Kama, I., & Weiss D. (2013). Do Earnings Targets and Managerial Incentives Affect Sticky Costs?: Earn-ings Targets and Managerial Incentives, Journal
of Accounting Research, 51, 201–224. https://doi.
org/10.1111/j.1475-679X.2012.00471.x
Kuang, Y.F., Mohan, A., & Qin, B. (2015). CEO Overcon-fidence and Cost Stickiness, Management Control &
Accounting, 2, 26-32.
Lant, T.K., & Hurley, A.E. (1999). A contingency model of response to performance feedback: Escalation of commitment and incremental adaptation in resource investment decisions, Group &
Organ-ization Management, 24, 421–437. https://doi.
org/10.1177/1059601199244002
Lee, D. (2017). Cross-border mergers and acquisitions with heterogeneous firms: Technology vs. market motives, The North American Journal of Economics
and Finance, 42, 20–37. https://doi.org/10.1016/j.
najef.2017.06.003
Meglio, O., & Risberg, A. (2011). The (mis)measurement of M&A performance—A systematic narrative literature review, Scandinavian Journal of
Man-agement, 27, 418–433. https://doi.org/10.1016/j.
scaman.2011.09.002
Moeller, S.B., Schlingemann, F.P., & Stulz, R.M. (2004). Firm size and the gains from acquisitions, Journal
of Financial Economics, 73, 201–228. https://doi.
org/10.1016/j.jfineco.2003.07.002
Moeller, S.B., Schlingemann, F.P., & Stulz, R.M. (2005). Wealth destruction on a massive scale? A study of acquiring-firm returns in the recent merger wave,
The Journal of Finance, 60, 757–782. https://doi.
org/10.1111/j.1540-6261.2005.00745.x
Moeller, S.B., Schlingemann, F.P , & Stulz R.M. (2007). How do diversity of opinion and information asym-metry affect acquirer returns?, Review of Financial
Studies, 20, 2047–2078. https://doi.org/10.1093/rfs/
hhm040
Petersen, M.A. (2009). Estimating standard errors in finance panel data sets: Comparing approaches,
Review of Financial Studies, 22, 435–480. https://doi.
org/10.1093/rfs/hhn053
Rosen, R.J. (2006). Merger momentum and investor sentiment: The stock market reaction to merger an-nouncements, The Journal of Business, 79, 987–1017. https://doi.org/10.1086/499146
Shleifer, A, &. Vishny, R.W. (2003). Stock market driv-en acquisitions, Journal of Financial Economics,
70, 295–311. https://doi.org/10.1016/S0304-405X(03)00211-3
Wang, D., & Moini, H. (2012). Performance assessment
of mergers and acquisitions: Evidence from Denmark,
E-Leader, Berlin. http://www.gcasa.com/conferenc-es/berlin/ppt/Wang.pdf.
Weiss, D. (2010). Cost behavior and analysts’ earnings forecasts, The Accounting Review, 85, 1441–1471. https://doi.org/10.2308/accr.2010.85.4.1441
Yasukata, K. (2011). Are “Sticky Costs” the result of delib-erate decision of managers? SSRN Electronic Journal. https://doi.org/10.2139/ssrn.1444746
Appendix
Table A1: Industry breakdown
Industries N total% of NoDur 251 5% Dur 80 2% Manuf 598 12% Enrgy 375 8% Hitec 1444 30% Telcm 223 5% Shops 363 7% Hlth 663 14% Utils 148 3% Other 739 15% Total 4884
Table A.2. T-tests
Panel A: Comparison of sticky cost vs antisticky cost acquirers
Antisticky Sticky Diff. t-stat
Size 13.412 13.633 -0.220 -2.4298**
Leverage 0.364 0.235 0.128 3.0168**
Zscore 0.868 1.483 -0.614 -7.4551***
Relative deal size 0.328 0.239 0.089 3.8975**
Profit margin 0.049 0.124 -0.075 -8.311**
CAR_1year
window 0.0048 0.0029 0.0018 3.573***
N 507 4376
Panel B: Comparison of large vs small acquirers
Small Large Diff. t-stat
Leverage 0.208 0.288 -0.080 -3.094***
Zscore 1.214 1.599 -0.385 -7.4747***
Relative deal size 0.356 0.146 0.210 15.4009***
Profit margin 0.095 0.136 -0.042 -7.569***
CAR_1year
window 0.0044 0.0019 0.0025 7.961***
N 2386 2492
***, **, and * indicates statistically significant levels of 1%, 5% and 10%, respectively. All variables except dependent variables are calculated at time t-1.