PUBLIC SPENDING ON HUMAN CAPITAL IN MAJOR
INDUSTRIALIZED COUNTRIES
ENDÜSTR LE MEN N EN YÜKSEK OLDU U ÜLKELERDE BE ER SERMAYEYE YÖNEL K KAMU HARCAMALARI
Meriç Suba ı ERTEK N
*Anadolu Üniversitesi, . .B.F, ktisat Bölümü
ABSTRACT: Human capital is important for firms and nations in the knowledge
based economy that needs skills. Thus, investment in education is a public policy to support human capital formation and offset the magnitude of capital looses. Policies and reforms designed to foster early learning which are determined as a high quality of education, early intervention and job training programs and promote skill formation. The public sector plays an important role in the funding of all education in major industrialized countries. Public spending on primary, secondary, post-secondary and tertiary educational institutions is higher than private spending.
Keywords: Human capital, investment in education, G-7 countries, economic growth ÖZET: Be eri sermaye, becerilerin gerekli oldu u bilgi temelli ekonomilerde firma ve ülkeler açısından önemlidir. Bu yüzden, e itim yatırımları be eri sermaye birikiminin sa lanmasında ve olası sermaye kayıplarının önlenmesinde bir kamu politikası olarak ele alınır. Politikalar ve reformlar, yüksek kaliteli e itim, ilk formasyon ve i e itim programları olarak belirlenen ilk ö renmeyi hızlandırmak ve beceri birikimini sa lamak amacıyla düzenlenmi tir. Kamu sektörü endüstrile menin en yüksek oldu u ülkelerde bütün e itimin finansmanında önemli bir rol oynamaktadır. lk, orta, lise ve yüksek e itim kurumlarına yönelik kamu harcamaları bu alandaki özel harcamalardan daha yüksektir.
Anahtar Kelimeler: Be eri sermaye, e itim yatırımları, G-7 ülkeleri, ekonomik büyüme
1. Introduction
Human capital includes knowledge, skills and derives from education, training and experience. Investment in education and training, and thus in human capital provides an economic return, causing an increase in employment rates and earnings, and therefore, education seems to be an important factor for economic growth. Barro and Sala-i-Martin (1995), Krueger and Lindahl (2001) and OECD (2001a) have empirically confirmed the importance of education in economic growth. Thus, investment in education is a public policy to support human capital formation and economic growth.
Most studies show that dependence or independence of the education system from the economy is a determiner in economic growth. High levels of economic growth depend on producing high levels of educational achievements and, the education
* This paper is prepared at Dalhousie University, Halifax, Canada. I would like to thank them for their research opportunities they provided me during my visiting scholarship there.
system is close to the requirements of the economy (Ashton and Green, 1997). In this process, government involvement is needed to ensure education services for the requirements of economic and social progress.
The purpose of this study is to present the public spending role on education and training in industrialized countries. This paper first presents the link between human capital and economic growth. It then examines public spending, incentives and job training programs on education and training.
2. Theoretical Links between Human Capital and Economic Growth
The role of human capital in economic growth and development has been an important issue in the theoretical and applied literature. These literatures take human capital up as a key contributor for economic growth and development and emphasize that its social rate of return is likely to exceed its private rate of return (Pissarides, 2000).
In empirical studies, physical capital has an influence on growth of aggregate output, but human capital is sometimes found to be insignificant. It isn’t defined which education and training contribute to growth and development (Pissarides, 2000: 1). Neoclassical growth theory developed by Robert Solow and Irevor Swan in 1950s and, Solow (1956), Cass (1965), Koopmans (1965), Ramsey (1928) and Barro and Sala-i Martin (1995) emphasized that the accumulation of physical capital and spending on education and health were seen as a drain on the accumulation of the productive assets. Within this theory, “acknowledgement of the importance of human capital has been one of the main vehicles for bringing the model into line with the stylized facts” (Ahn and Hemmings, 2000: 26). Neoclassical growth models show that as the capital stock increases, growth of the economy slows down. Only technological process keeps the economy growing and, it is exogenous to the system. In the neoclassical models, the effects of an increased investment in human capital are conceptually only temporary. It is the dynamic equilibrium that is driven by the exogenous influences of population and technology. As the theory explains the long-run rate of growth, whether effects are permanent may be of little significance in practical terms (Ahn and Hemmings, 2000: 26) while the determinants of long-term economic growth were the problem.
The more recent endogenous growth models were developed in the mid 1980s, mostly due to Paul Romer (1986). In the early 1990’s, growth models improved using cross-country and cross-regional data. In fact “the framework used in recent empirical studies combines basic futures of the neoclassical model with extensions that emphasize government policies and institutions and the accumulation of human capital” (Barro, 2001: 2 ; Barro, 1997). In those models, the long term rate of growth was determined within the models. One major contributor, Romer shows the result that the steady growth rate partly depends on the level of human capital. In Romer’s model, the underlying assumption is that human capital is a key in the production of new ideas. Therefore an increase in human capital will raise the growth rate indefinitely (Temple, 2001: 4). These models emphasize the importance of ideas, no rivalry, and imperfect competition for understanding the engine of economic growth (Galor and Weill, 1998: 1). In these models, knowledge as a form of capital is used as a motivation in growth and it seems to be a form of human capital (Ahn and
Hemmings, 2000: 26). Sustainable growth consists as a result of positive externalities generated by education, an important form of human capital (Birdsall, 2001: 14). “ It is clear that all countries which have managed persistent growth in income have also had large increases in the education and training of their labour forces” (Becker, 1993: 24). According to this theory educated, skilled and healthy workers will be more productive and also be able to use the capital and technology more efficiently. It means that, technology and human capital are endogenous to the system (UNESCAP, 2002: 4).
However, Mankiw (1995) defines knowledge and human capital in a different concept. Knowledge is to understand how the world works. Human capital refers to the resources expended in transmitting this understanding to the workforce (Ahn and Hemmings, 2000: 26). Thus, the non-rival and relatively non-excludable character of knowledge causes less to encounter diminishing return that provides a mechanism for the type of permanent effects (Romer 1990, 1993).
Barro explains that ;
“the recent endogenous growth models are useful for understanding why advanced economies can continue to grow in the long run despite the workings of diminishing returns in the accumulation of physical and human capital. In contrast, the extended neoclassical framework does well as a vehicle for understanding relative growth rates across countries, for example, for assessing why South Korea grew much faster than the United States” (Barro, 2001: 2).
Indeed, endogenous growth models with human capital make easier understanding of rapid and long sustainable high growth performance of East Asian economies (Unescap, 2002: 4). In most endogenous models based on researches and developments (R&D), the stock of human capital is taken to be exogenously determined. Afterwards, more papers, Acemoglu (1997), Redding (1996) and Rustichini and Schmitz (1991) considered individuals’ investment in education and Romer (2000) has pointed out that the models of growth are determined by the quantity of inputs are used in researches and developments.
3. Public Spending on Human Capital
Human capital can be seen in many social settings like family, workplace and volunteer groups (OECD, 2001a: 3). Therefore, the arena for policy intervention is wide. Human capital is also an important factor for economic growth and economic wellbeing because; it has been a production factor like physical capital. Today, these two factors include improved technology, organizations and trained skilled labour forces. This process causes an increased concern among policy makers about human capital.
OECD summarizes human capital policy implications from research studies and policy development work:
Human capital investments generate significant private and social benefits (OECD, 2001a: 66). Human capital is important for firms and nations in the knowledge – based economy that needs skills. Most countries want the young people to enter the workforce with a minimum amount of human capital that acquired during the years of compulsory education (Blöndal, 2002: 3). Thus, investment in education is a public policy to support human capital formation (OECD, 2001a: 66), and offset the
magnitude of capital losses. Policy that related to investments on children may give an effective result in higher level of skills. Policies and reforms designed to foster early learning and promote skill formation (HECKMAN, 2000a: 1). Heckman emphasizes that “young individuals are better equipped to enter the job market and subsequently reap the benefits of the investments made in earlier years”. These early investments are determined as high quality education, early intervention and job training programs. Heckman indicates the trends in the American labour market that demonstrate a decrease in wages and an increase in unemployment for individuals with low job skills (HECKMAN, 2000a: 1); thus, governments involvement in the financing and servicing of post compulsory education- upper secondary and tertiary-. Such spending is a part of human capital investment.
3.1 Expenditure on Educational Institutions
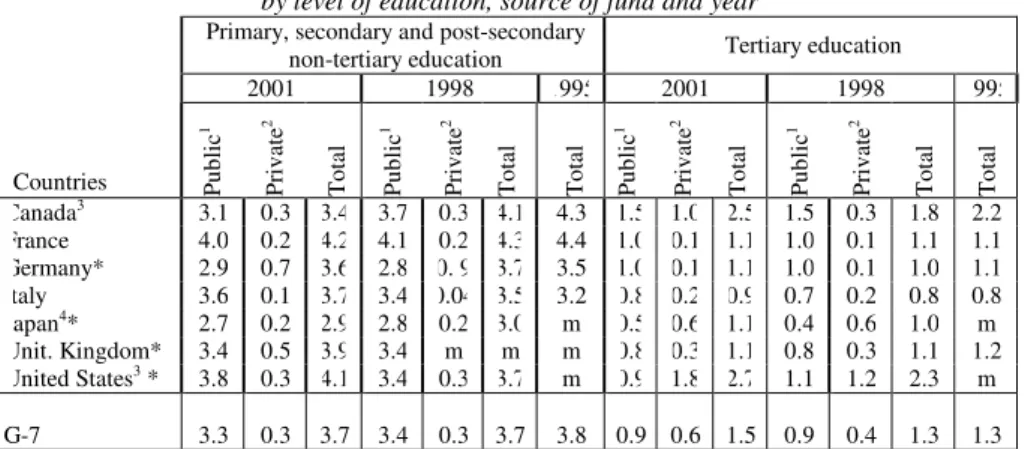
Private and public spending on primary, secondary and post-secondary and tertiary educational institutions relative to GDP is taken part in Table 1. In table, total public and private spending on primary, secondary and post-secondary educational institutions is higher with 4.2 percent of GDP in France and 4.1 percent of GDP in the United States than in other G-7 countries in 2001. The public sector plays an important role in the funding of all education in G-7 countries. Public spending on primary, secondary, post-secondary and tertiary educational institutions is higher than private spending. Spending on tertiary education is higher in the United States and Canada with 2.7 percent and 2.5 percent of GDP than in other G-7 countries in 2001. Tertiary and upper secondary spending generally exceeds spending on primary and lower secondary education (OECD, 2001b and 2002a).
Table 1. Expenditure on educational institutions as a percentage of GDP Direct and indirect expenditure on educational institutions from public and private sources,
by level of education, source of fund and year
Primary, secondary and post-secondary
non-tertiary education Tertiary education
2001 1998 1995 2001 1998 1995 Countries Publ ic 1 Pr iv at e 2 T ot al Pu bl ic 1 Pr iv at e 2 T ot al T ot al Pu bl ic 1 Pr iv at e 2 T ot al Pu bl ic 1 Pr iv at e 2 T ot al T ot al Canada3 3.1 0.3 3.4 3.7 0.3 4.1 4.3 1.5 1.0 2.5 1.5 0.3 1.8 2.2 France 4.0 0.2 4.2 4.1 0.2 4.3 4.4 1.0 0.1 1.1 1.0 0.1 1.1 1.1 Germany* 2.9 0.7 3.6 2.8 0. 9 3.7 3.5 1.0 0.1 1.1 1.0 0.1 1.0 1.1 Italy 3.6 0.1 3.7 3.4 0.04 3.5 3.2 0.8 0.2 0.9 0.7 0.2 0.8 0.8 Japan4* 2.7 0.2 2.9 2.8 0.2 3.0 m 0.5 0.6 1.1 0.4 0.6 1.0 m Unit. Kingdom* 3.4 0.5 3.9 3.4 m m m 0.8 0.3 1.1 0.8 0.3 1.1 1.2 United States3 * 3.8 0.3 4.1 3.4 0.3 3.7 m 0.9 1.8 2.7 1.1 1.2 2.3 m G-7 3.3 0.3 3.7 3.4 0.3 3.7 3.8 0.9 0.6 1.5 0.9 0.4 1.3 1.3 1. Including public subsidies to households attributable for educational institutions. Including direct expenditure on educational institutions from international sources.
2. Net of public subsidies attributable for educational institutions. 3. Post-secondary non-tertiary included in tertiary education.
4. Post-secondary non-tertiary included in both upper secondary and tertiary education.
* See Annex 3 for notes, http://www.oecd.org/pdf/M00022000/M00022163.pdf and
(www.oecd.org/edu/eag2004).
Source: OECD (2001b), Education at a Glance, Available from < http://www.oecd.org/
dataoecd/26/45/2672042.xls > [Accessed March 25, 2005]; OECD (2004), Education at a Glance, Available from < http://www.oecd.org/dataoecd/62/21/33670978.xls > [Accessed March 30, 2005].
At the primary, secondary and post secondary non-tertiary education level, the general stream is mainly funded by government. At the tertiary level, there is more variety across the G-7 countries. In the United States and Japan, half or more spending on tertiary education is made by the private sector (Table 1).
3.2 Internal Rates of Return to Education
Governments have an impact on the incentives to invest in human capital. Financial incentives are summarized in the private rate of return associated with completing different level of education. “The internal rate is the discount rate that equalizes the real costs of education during the period of study to the real gains from education thereafter” (Blöndal, 2002: 7) as seen in Box 1.
The real gains of education depend on earnings during education, earning advantage conferred by education, the reduced risk of unemployment, and the degree of progressivism in the tax system.
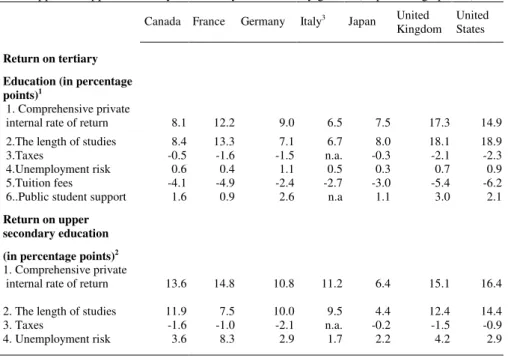
Internal rates of return are confined to human capital investment following compulsory schooling (Blöndal, and Girouard, 2002: 60). Comprehensive internal rates of return for tertiary education seem to be very high in the United States, the United Kingdom and France. Italy has the lowest rates of return. For upper-secondary education, comprehensive internal rates of return are high at the all G-7 countries with the exception of Japan.
As seen in Table 2, the length of studies is important in determining of the internal rate. The highest length of education in tertiary education is naturally belongs to the United States, the United Kingdom and France which is determined the highest internal rates in those countries.
The other factors in the table do not have more influences on internal rate. Taxes on the earnings of tertiary graduated are higher than upper secondary educated in the United States, the United Kingdom, Japan and France. While the tax rate on the earnings of upper secondary is high in Canada and Japan, it is high for tertiary graduates in the United States and the United Kingdom.
Unemployment risk in upper-secondary education is higher than tertiary education in G-7 countries. The impact of unemployment risk for the internal rates of return to upper secondary education is significant in France.
Private tuition fees reduce the internal rates of return to tertiary education. Public support to students raises the internal rates of return to tertiary education. Tuition subsidies and public support to students provide private financial incentives for continuing education (Blöndal, 2002: 13). However, it is remarked that student supports in each of the G-7 countries are differently applied. The highest student supports are in the United States and the United Kingdom.
Table 2. Private internal rates of return to education for males, 1999-2000 The impact of length of studies, taxes, unemployment risk, tuition fees and public student
support in upper secondary and tertiary education, by gender (in percentage points)
Canada France Germany Italy3 Japan United
Kingdom United States
Return on tertiary Education (in percentage points)1
1. Comprehensive private
internal rate of return 8.1 12.2 9.0 6.5 7.5 17.3 14.9
2.The length of studies 8.4 13.3 7.1 6.7 8.0 18.1 18.9
3.Taxes -0.5 -1.6 -1.5 n.a. -0.3 -2.1 -2.3
4.Unemployment risk 0.6 0.4 1.1 0.5 0.3 0.7 0.9
5.Tuition fees -4.1 -4.9 -2.4 -2.7 -3.0 -5.4 -6.2
6..Public student support 1.6 0.9 2.6 n.a 1.1 3.0 2.1
Return on upper secondary education (in percentage points)2
1. Comprehensive private
internal rate of return 13.6 14.8 10.8 11.2 6.4 15.1 16.4
2. The length of studies 11.9 7.5 10.0 9.5 4.4 12.4 14.4
3. Taxes -1.6 -1.0 -2.1 n.a. -0.2 -1.5 -0.9
4. Unemployment risk 3.6 8.3 2.9 1.7 2.2 4.2 2.9
1. The rate of return to tertiary education is calculated by comparing the benefits and costs with those of upper secondary education.
2. The rate of return to upper secondary education is calculated by comparing the benefits and costs with those of lower secondary education.
3. Data for males derive from 1998 post-tax earnings data. Source: OECD (2003), Education at a Glance, Available from:
<http://www.oecd.org/dataoecd/0/40/14165184.xls > [Accessed March 31, 2005]. Box 1. The calculation of private internal rates of return
The internal rate of return in real terms is the discount rate (δ) that equalises the future flows of real benefits (B) and real costs (C) associated with investment in upper-secondary (s) or tertiary (u) education, i.e.
(
)
C
( )
t
(
)
( )B
su( )
t
a t l a t u s a t l a a t , 64 1 , ) (1
1
+
×
=
+
×
− − + + = − − + =δ
δ
where t is age, a is the typical age at the start of upper-secondary (tertiary) education and l is the standard length of upper-secondary (tertiary) education. The benefits are assumed to last until the age of 64.
The costs of tertiary education are defined as
( )
t
[
( )
E
( )
t
]
[
ur
( )
t
]
E
( ) (
t
g
)
( )F
( ) (
t
g
)
( )S
( )
t
C
u=
1
−
τ
s×
1
−
s×
s×
1
+
t−a+
u×
1
+
t−a−
where τ is the average tax rate for base-year earnings of a single person with upper-secondary education at age t (Es(t)), urs(t) is the unemployment rate for people with upper-secondary education at age t, g is
Source: BLÖNDAL, S. (2002) Investment in Human Capital through Post-Compulsory Education: The Impact of Government Financing, OECD Headquarters, Meeting of National Economic Research Organizations, July 1, Paris, p.8, < http://www.oecd.org/dataoecd/22/42/34949912.pdf >, [Accessed March 31, 2005].
3.3 Job Training Programs
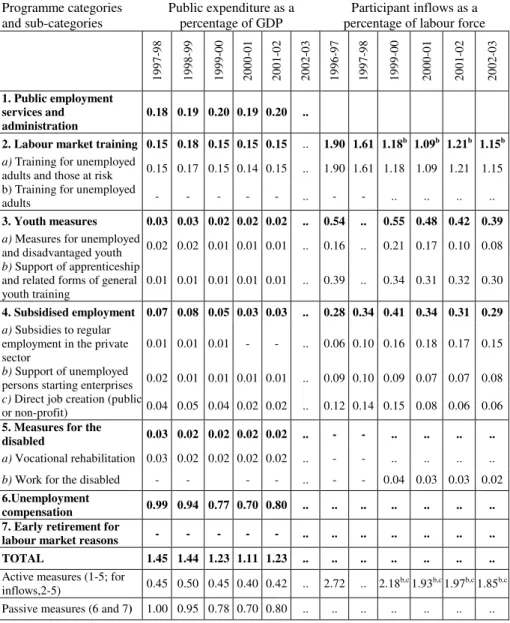
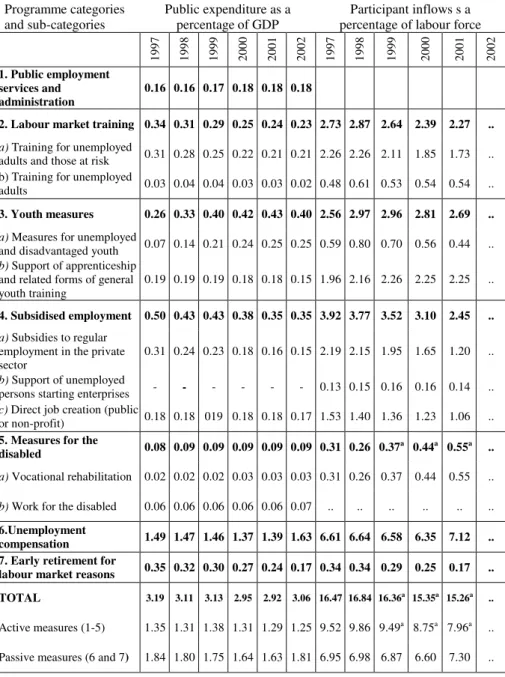
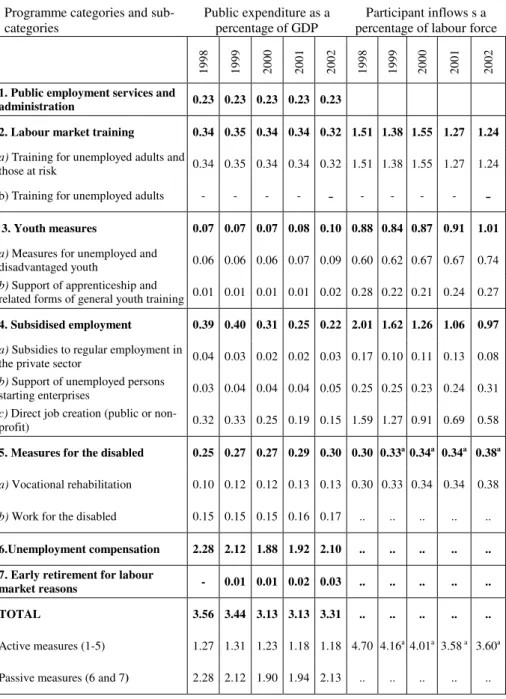
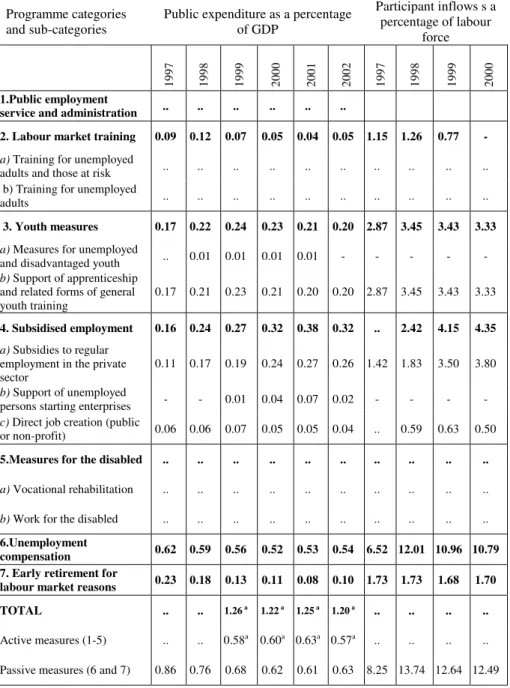
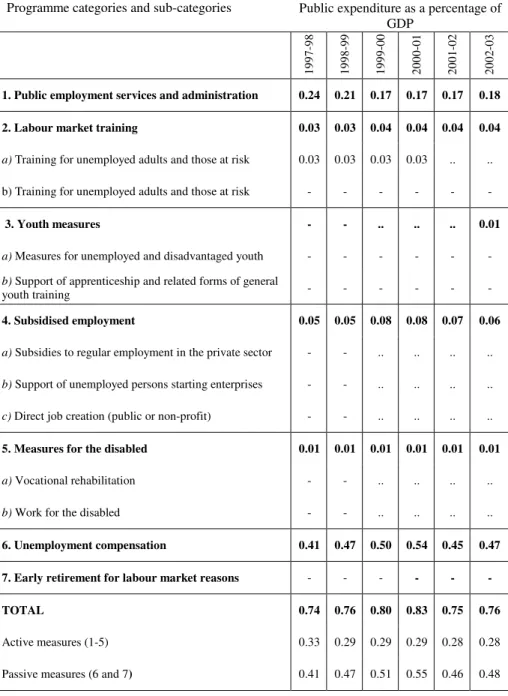
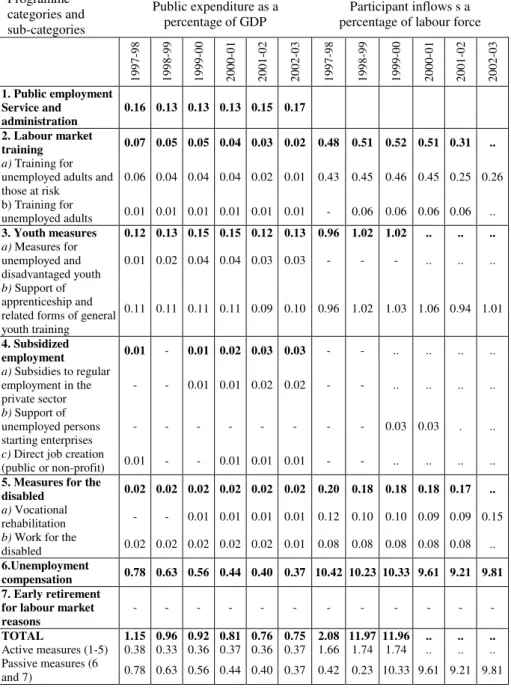
Public sector and private sector job training programs improve skills and are integrated within the local labour market. Private sector programs are prepared to meet the higher quality and market needs than public sector programs. Public sector programs are generally based on the low level of earning (Heckman, 2000b: 2). Public expenditure and participant inflows in labour market programs for each country of G-7 are shown in Table 3. Public expenditure as a percentage of GDP in public employment services and administration is 0.19 as an average in Canada and Japan, 0.17 in France and 0.23 in Germany. In the United States, it is low with 0.04. Germany and France have a significant share in labour market training as a percentage of GDP and France, Canada and Germany in participant inflows as a percentage of the labour force. The highest youth measures account constitutes an average value of 0.37 as a percentage of GDP in France. In subsidized employment expenditure, France, Germany and Italy have more shares as a percentage of GDP and participant inflows as a percentage of the labour force.
In Table 3, total labour market program expenditure and participant inflows are the highest in Germany and then in France with 3.31 and 3.06 average values as a percentage of GDP in G-7 countries. Total spending in active labour market measure is the highest in Germany and then in France as a percentage of GDP. Total spending in passive labour market measure is the highest in Germany with an average of 2.07 as a percentage of GDP. This measure in participant inflows as a percentage of labour force is high in turn in Italy, France and the United Kingdom.
tertiary education, and S(t) is student grants and loans at age t. The scaling factor at the end of the first term of the right-hand side of the equation is there to project future earnings by the scaling up of base-year earnings with the productivity growth rate for the economy as a whole. The costs of upper-secondary education are similarly defined.
The benefits of tertiary education are defined as
( )
(
)
(
E
ut
) (
ur
u)
E
u( ) (
t
g
)
( )t at
B
(
)
=
1
−
τ
×
1
−
×
×
1
+
−( )
( )
(
−
E
st
) (
×
−
ur
s)
×
E
s( ) (
t
×
+
g
)
( )t a−
R
( )
t
−
−1
1
1
τ
where R(t) is the repayment of loans, if any. According to this equation, the benefits are equal to the difference between post-tax earnings adjusted for the unemployment risk for tertiary and upper-secondary educated persons minus the repayment of student support. The benefits of upper-secondary education are similarly defined.
These estimations have several important limitations. They assume stability in the wage premia through the life cycle and are based on average earnings and costs. In practice, there can be considerable variation in rates of return for different fields of study or particular social groups. The rate-of-return calculations do not incorporate unemployment benefits or other social and personal benefits. Differences in retirement incomes for different educational groups are not included in the estimates and they do not take into account broader social benefits flowing from investment in education such as better health or lower crime. Finally, there are no private tuition costs included in upper-secondary education.
Table 3. Public expenditure and participant inflows* in labour market
programme in G-7 Countries (Canada a)
Programme categories
and sub-categories Public expenditure as a percentage of GDP percentage of labour forceParticipant inflows as a
19 97 -9 8 19 98 -9 9 19 99 -0 0 20 00 -0 1 20 01 -0 2 20 02 -0 3 19 96 -9 7 19 97 -9 8 19 99 -0 0 20 00 -0 1 20 01 -0 2 20 02 -0 3 1. Public employment services and administration 0.18 0.19 0.20 0.19 0.20 ..
2. Labour market training 0.15 0.18 0.15 0.15 0.15 .. 1.90 1.61 1.18b 1.09b 1.21b 1.15b
a) Training for unemployed
adults and those at risk 0.15 0.17 0.15 0.14 0.15 .. 1.90 1.61 1.18 1.09 1.21 1.15 b) Training for unemployed
adults - - - .. - - .. .. .. ..
3. Youth measures 0.03 0.03 0.02 0.02 0.02 .. 0.54 .. 0.55 0.48 0.42 0.39
a) Measures for unemployed
and disadvantaged youth 0.02 0.02 0.01 0.01 0.01 .. 0.16 .. 0.21 0.17 0.10 0.08 b) Support of apprenticeship
and related forms of general
youth training 0.01 0.01 0.01 0.01 0.01 .. 0.39 .. 0.34 0.31 0.32 0.30
4. Subsidised employment 0.07 0.08 0.05 0.03 0.03 .. 0.28 0.34 0.41 0.34 0.31 0.29
a) Subsidies to regular employment in the private
sector 0.01 0.01 0.01 - - .. 0.06 0.10 0.16 0.18 0.17 0.15 b) Support of unemployed
persons starting enterprises 0.02 0.01 0.01 0.01 0.01 .. 0.09 0.10 0.09 0.07 0.07 0.08
c) Direct job creation (public
or non-profit) 0.04 0.05 0.04 0.02 0.02 .. 0.12 0.14 0.15 0.08 0.06 0.06
5. Measures for the
disabled 0.03 0.02 0.02 0.02 0.02 .. - - .. .. .. ..
a) Vocational rehabilitation 0.03 0.02 0.02 0.02 0.02 .. - - .. .. .. .. b) Work for the disabled - - - - .. - - 0.04 0.03 0.03 0.02 6.Unemployment
compensation 0.99 0.94 0.77 0.70 0.80 .. .. .. .. .. .. .. 7. Early retirement for
labour market reasons - - - - - .. .. .. .. .. .. .. TOTAL 1.45 1.44 1.23 1.11 1.23 .. .. .. .. .. .. ..
Active measures (1-5; for
inflows,2-5) 0.45 0.50 0.45 0.40 0.42 .. 2.72 .. 2.18b,c 1.93b,c 1.97b,c 1.85b,c Passive measures (6 and 7) 1.00 0.95 0.78 0.70 0.80 .. .. .. .. .. .. ..
.. Data not available.
- Nil or less than half of the last digit used.
* Data for participant inflows are reported only for categories 2 to 7 since data for category 1 "Public employment services and administration" are commonly incomplete and
noncomparable. Totals shown in the table must be interpreted with caution. a) Fiscal years starting on April 1.
b) Participant inflows for category 2b "Training for employed adults" are not included. c) Participant inflows for category 5a "Vocational rehabilitation" are not included.
Table 3. Public expenditure and participant inflows*in labour market programme in G-7 countries (cont.) (France)
Programme categories
and sub-categories Public expenditure as a percentageof GDP percentage of labour forceParticipant inflows s a
19 97 19 98 19 99 20 00 20 01 20 02 19 97 19 98 19 99 20 00 20 01 20 02 1. Public employment services and administration 0.16 0.16 0.17 0.18 0.18 0.18
2. Labour market training 0.34 0.31 0.29 0.25 0.24 0.23 2.73 2.87 2.64 2.39 2.27 ..
a) Training for unemployed
adults and those at risk 0.31 0.28 0.25 0.22 0.21 0.21 2.26 2.26 2.11 1.85 1.73 .. b) Training for unemployed
adults 0.03 0.04 0.04 0.03 0.03 0.02 0.48 0.61 0.53 0.54 0.54 ..
3. Youth measures 0.26 0.33 0.40 0.42 0.43 0.40 2.56 2.97 2.96 2.81 2.69 ..
a) Measures for unemployed
and disadvantaged youth 0.07 0.14 0.21 0.24 0.25 0.25 0.59 0.80 0.70 0.56 0.44 .. b) Support of apprenticeship
and related forms of general
youth training 0.19 0.19 0.19 0.18 0.18 0.15 1.96 2.16 2.26 2.25 2.25 ..
4. Subsidised employment 0.50 0.43 0.43 0.38 0.35 0.35 3.92 3.77 3.52 3.10 2.45 ..
a) Subsidies to regular employment in the private
sector 0.31 0.24 0.23 0.18 0.16 0.15 2.19 2.15 1.95 1.65 1.20 .. b) Support of unemployed
persons starting enterprises - - - - - - 0.13 0.15 0.16 0.16 0.14 .. c) Direct job creation (public
or non-profit) 0.18 0.18 019 0.18 0.18 0.17 1.53 1.40 1.36 1.23 1.06 ..
5. Measures for the
disabled 0.08 0.09 0.09 0.09 0.09 0.09 0.31 0.26 0.37a 0.44a 0.55a ..
a) Vocational rehabilitation 0.02 0.02 0.02 0.03 0.03 0.03 0.31 0.26 0.37 0.44 0.55 ..
b) Work for the disabled 0.06 0.06 0.06 0.06 0.06 0.07 .. .. .. .. .. ..
6.Unemployment
compensation 1.49 1.47 1.46 1.37 1.39 1.63 6.61 6.64 6.58 6.35 7.12 .. 7. Early retirement for
labour market reasons 0.35 0.32 0.30 0.27 0.24 0.17 0.34 0.34 0.29 0.25 0.17 .. TOTAL 3.19 3.11 3.13 2.95 2.92 3.06 16.47 16.84 16.36a 15.35a 15.26a ..
Active measures (1-5) 1.35 1.31 1.38 1.31 1.29 1.25 9.52 9.86 9.49a 8.75a 7.96a ..
Passive measures (6 and 7) 1.84 1.80 1.75 1.64 1.63 1.81 6.95 6.98 6.87 6.60 7.30 .. .. Data not available.
- Nil or less than half of the last digit used.
* Data for participant inflows are reported only for categories 2 to 7 since data for category 1 "Public employment services and administration" are commonly incomplete and
noncomparable. Totals shown must be interpreted with caution.
Table 3. Public expenditure and participant inflows*in labour market programme in G-7 countries (cont.) (Germany)
Programme categories and
sub-categories Public expenditure as a percentageof GDP percentage of labour forceParticipant inflows s a
19 98 19 99 20 00 20 01 20 02 19 98 19 99 20 00 20 01 20 02
1. Public employment services and
administration 0.23 0.23 0.23 0.23 0.23
2. Labour market training 0.34 0.35 0.34 0.34 0.32 1.51 1.38 1.55 1.27 1.24
a) Training for unemployed adults and
those at risk 0.34 0.35 0.34 0.34 0.32 1.51 1.38 1.55 1.27 1.24
b) Training for unemployed adults - - - -
-
- - - --
3. Youth measures 0.07 0.07 0.07 0.08 0.10 0.88 0.84 0.87 0.91 1.01
a) Measures for unemployed and
disadvantaged youth 0.06 0.06 0.06 0.07 0.09 0.60 0.62 0.67 0.67 0.74 b) Support of apprenticeship and
related forms of general youth training 0.01 0.01 0.01 0.01 0.02 0.28 0.22 0.21 0.24 0.27 4. Subsidised employment 0.39 0.40 0.31 0.25 0.22 2.01 1.62 1.26 1.06 0.97
a) Subsidies to regular employment in
the private sector 0.04 0.03 0.02 0.02 0.03 0.17 0.10 0.11 0.13 0.08 b) Support of unemployed persons
starting enterprises 0.03 0.04 0.04 0.04 0.05 0.25 0.25 0.23 0.24 0.31 c) Direct job creation (public or
non-profit) 0.32 0.33 0.25 0.19 0.15 1.59 1.27 0.91 0.69 0.58
5. Measures for the disabled 0.25 0.27 0.27 0.29 0.30 0.30 0.33a0.34a 0.34a 0.38a
a) Vocational rehabilitation 0.10 0.12 0.12 0.13 0.13 0.30 0.33 0.34 0.34 0.38
b) Work for the disabled 0.15 0.15 0.15 0.16 0.17 .. .. .. .. ..
6.Unemployment compensation 2.28 2.12 1.88 1.92 2.10 .. .. .. .. .. 7. Early retirement for labour
market reasons - 0.01 0.01 0.02 0.03 .. .. .. .. .. TOTAL 3.56 3.44 3.13 3.13 3.31 .. .. .. .. ..
Active measures (1-5) 1.27 1.31 1.23 1.18 1.18 4.70 4.16a 4.01a 3.58 a 3.60a
Passive measures (6 and 7) 2.28 2.12 1.90 1.94 2.13 .. .. .. .. ..
.. Data not available.
- Nil or less than half of the last digit used.
* Data for participant inflows are reported only for categories 2 to 7 since data for category 1 "Public employment services and administration" are commonly incomplete and
noncomparable. Totals shown must be interpreted with caution.
Table 3. Public expenditure and participant inflows*in labour market programme in G-7 countries (cont.) (Italy)
Programme categories
and sub-categories Public expenditure as a percentageof GDP
Participant inflows s a percentage of labour force 19 97 19 98 19 99 20 00 20 01 20 02 19 97 19 98 19 99 20 00 1.Public employment
service and administration .. .. .. .. .. ..
2. Labour market training 0.09 0.12 0.07 0.05 0.04 0.05 1.15 1.26 0.77 -
a) Training for unemployed
adults and those at risk .. .. .. .. .. .. .. .. .. ..
b) Training for unemployed
adults .. .. .. .. .. .. .. .. .. ..
3. Youth measures 0.17 0.22 0.24 0.23 0.21 0.20 2.87 3.45 3.43 3.33
a) Measures for unemployed
and disadvantaged youth .. 0.01 0.01 0.01 0.01 - - - -
-b) Support of apprenticeship and related forms of general
youth training 0.17 0.21 0.23 0.21 0.20 0.20 2.87 3.45 3.43 3.33
4. Subsidised employment 0.16 0.24 0.27 0.32 0.38 0.32 .. 2.42 4.15 4.35
a) Subsidies to regular employment in the private
sector 0.11 0.17 0.19 0.24 0.27 0.26 1.42 1.83 3.50 3.80 b) Support of unemployed
persons starting enterprises - - 0.01 0.04 0.07 0.02 - - - - c) Direct job creation (public
or non-profit) 0.06 0.06 0.07 0.05 0.05 0.04 .. 0.59 0.63 0.50
5.Measures for the disabled .. .. .. .. .. .. .. .. .. ..
a) Vocational rehabilitation .. .. .. .. .. .. .. .. .. .. b) Work for the disabled .. .. .. .. .. .. .. .. .. ..
6.Unemployment
compensation 0.62 0.59 0.56 0.52 0.53 0.54 6.52 12.01 10.96 10.79 7. Early retirement for
labour market reasons 0.23 0.18 0.13 0.11 0.08 0.10 1.73 1.73 1.68 1.70 TOTAL .. .. 1.26 a 1.22 a 1.25 a 1.20 a .. .. .. ..
Active measures (1-5) .. .. 0.58a 0.60a 0.63a 0.57a .. .. .. ..
Passive measures (6 and 7) 0.86 0.76 0.68 0.62 0.61 0.63 8.25 13.74 12.64 12.49
.. Data not available.
- Nil or less than half of the last digit used.
* Data for participant inflows are reported only for categories 2 to 7 since data for category 1 "Public employment services and administration" are commonly incomplete and
noncomparable. Totals shown must be interpreted with caution. a) Only active categories 2-4 are taken into account.
Table 3. Public expenditure and participant inflows*in labour market programme in G-7 countries (cont.) (Japan a)
Programme categories and sub-categories Public expenditure as a percentage of GDP 19 97 -9 8 19 98 -9 9 19 99 -0 0 20 00 -0 1 20 01 -0 2 20 02 -0 3
1. Public employment services and administration 0.24 0.21 0.17 0.17 0.17 0.18 2. Labour market training 0.03 0.03 0.04 0.04 0.04 0.04
a) Training for unemployed adults and those at risk 0.03 0.03 0.03 0.03 .. .. b) Training for unemployed adults and those at risk - - - - - -
3. Youth measures - - .. .. .. 0.01
a) Measures for unemployed and disadvantaged youth - - - -b) Support of apprenticeship and related forms of general
youth training - - - - - -
4. Subsidised employment 0.05 0.05 0.08 0.08 0.07 0.06
a) Subsidies to regular employment in the private sector - - .. .. .. .. b) Support of unemployed persons starting enterprises - - .. .. .. .. c) Direct job creation (public or non-profit) - - .. .. .. ..
5. Measures for the disabled 0.01 0.01 0.01 0.01 0.01 0.01
a) Vocational rehabilitation - - .. .. .. .. b) Work for the disabled - - .. .. .. ..
6. Unemployment compensation 0.41 0.47 0.50 0.54 0.45 0.47 7. Early retirement for labour market reasons - - - - - -
TOTAL 0.74 0.76 0.80 0.83 0.75 0.76
Active measures (1-5) 0.33 0.29 0.29 0.29 0.28 0.28
Passive measures (6 and 7) 0.41 0.47 0.51 0.55 0.46 0.48
.. Data not available.
- Nil or less than half of the last digit used.
* Data for participant inflows are reported only for categories 2 to 7 since data for category 1 "Public employment services and administration" are commonly incomplete and noncomparable. Totals shown must be interpreted with caution.
Table 3. Public expenditure and participant inflows*in labour market programme in G-7 countries (cont.) (United Kingdom a)
Programme categories and sub-categories
Public expenditure as a
percentageof GDP percentage of labour forceParticipant inflows s a
19 97 -9 8 19 98 -9 9 19 99 -0 0 20 00 -0 1 20 01 -0 2 20 02 -0 3 19 97 -9 8 19 98 -9 9 19 99 -0 0 20 00 -0 1 20 01 -0 2 20 02 -0 3 1. Public employment Service and administration 0.16 0.13 0.13 0.13 0.15 0.17 2. Labour market training 0.07 0.05 0.05 0.04 0.03 0.02 0.48 0.51 0.52 0.51 0.31 .. a) Training for unemployed adults and
those at risk 0.06 0.04 0.04 0.04 0.02 0.01 0.43 0.45 0.46 0.45 0.25 0.26 b) Training for unemployed adults 0.01 0.01 0.01 0.01 0.01 0.01 - 0.06 0.06 0.06 0.06 .. 3. Youth measures 0.12 0.13 0.15 0.15 0.12 0.13 0.96 1.02 1.02 .. .. .. a) Measures for unemployed and disadvantaged youth 0.01 0.02 0.04 0.04 0.03 0.03 - - - .. .. .. b) Support of apprenticeship and related forms of general youth training 0.11 0.11 0.11 0.11 0.09 0.10 0.96 1.02 1.03 1.06 0.94 1.01 4. Subsidized employment 0.01 - 0.01 0.02 0.03 0.03 - - .. .. .. .. a) Subsidies to regular employment in the private sector - - 0.01 0.01 0.02 0.02 - - .. .. .. .. b) Support of unemployed persons starting enterprises - - - 0.03 0.03 . ..
c) Direct job creation
(public or non-profit) 0.01 - - 0.01 0.01 0.01 - - .. .. .. ..
5. Measures for the
disabled 0.02 0.02 0.02 0.02 0.02 0.02 0.20 0.18 0.18 0.18 0.17 ..
a) Vocational
rehabilitation - - 0.01 0.01 0.01 0.01 0.12 0.10 0.10 0.09 0.09 0.15 b) Work for the
disabled 0.02 0.02 0.02 0.02 0.02 0.01 0.08 0.08 0.08 0.08 0.08 .. 6.Unemployment
compensation 0.78 0.63 0.56 0.44 0.40 0.37 10.42 10.23 10.33 9.61 9.21 9.81 7. Early retirement
for labour market
reasons - - - - TOTAL 1.15 0.96 0.92 0.81 0.76 0.75 2.08 11.97 11.96 .. .. ..
Active measures (1-5) 0.38 0.33 0.36 0.37 0.36 0.37 1.66 1.74 1.74 .. .. .. Passive measures (6
and 7) 0.78 0.63 0.56 0.44 0.40 0.37 0.42 0.23 10.33 9.61 9.21 9.81 .. Data not available.
- Nil or less than half of the last digit used.
* Data for participant inflows are reported only for categories 2 to 7 since data for category 1 "Public employment services and administration" are commonly incomplete and noncomparable. Totals shown must be interpreted with caution.
Table 3. Public expenditure and participant inflows*in labour market programme in G-7 countries (cont.) (United States a)
Programme categories
and sub-categories Public expenditure as a percentageof GDP percentage of labour forceParticipant inflows s a
19 97 -9 8 19 98 -9 9 19 99 -0 0 20 00 -0 1 20 01 -0 2 20 02 -0 3 19 97 -9 8 19 98 -9 9 19 99 -0 0 20 00 -0 1 20 01 -0 2 20 02 -0 3 1. Public employment services and administration 0.06 0.06 0.04 0.04 0.04 0.04 2. Labour market training 0.04 0.04 0.04 0.04 0.03 0.03 0.78 0.59 .. 0.97 0.94 ..
a) Training for unemployed
adults and those at risk 0.04 0.04 0.04 0.04 0.03 0.03 0.78 0.59 .. 0.97 0.94 .. b) Training for unemployed adults - - - .. - - .. 3. Youth measures 0.03 0.03 0.03 0.03 0.03 0.02 0.59 0.56 .. 0.44 0.44 .. a) Measures for unemployed and disadvantaged youth 0.03 0.03 0.03 0.03 0.03 0.02 0.51 0.48 .. 0.36 0.35 .. b) Support of
apprenticeship and related forms of general youth training
- - - 0.08 0.08 .. 0.09 0.09 ..
4. Subsidised employment 0.01 0.01 0.01 0.01 0.01 0.01 .. .. 0.37 0.38 0.35 ..
a) Subsidies to regular employment in the private
sector - - - .. .. 0.37 0.33 0.29 ..
b) Support of unemployed
persons starting enterprises - - - .. c) Direct job creation
(public or non-profit) 0.01 0.01 0.01 0.01 0.01 0.01 0.07 0.07 .. 0.05 0.06 ..
5. Measures for the
disabled 0.04 0.04 0.03 0.03 0.03 0.03 .. .. .. .. .. ..
a) Vocational rehabilitation 0.04 0.04 0.03 0.03 0.03 0.03 .. .. .. .. .. .. b) Work for the disabled - - - - - - - ..
6. Unemployment
compensation 0.25 0.25 0.23 0.30 0.55 0.57 .. .. .. .. .. .. 7. Early retirement for
Labour market reasons - - - - - - - - - - - .. TOTAL 0.42 0.42 0.38 0.45 0.71 0.71 .. .. .. .. .. .. Active measures (1-5) 0.17 0.17 0.15 0.15 0.15 0.14 .. .. .. 1.80b 1.74b ..
Passive measures (6 and 7) 0.25 0.25 0.23 0.30 0.55 0.57 .. .. .. .. .. .. .. Data not available.
- Nil or less than half of the last digit used.
* Data for participant inflows are reported only for categories 2 to 7 since data for category 1 "Public employment services and administration" are commonly incomplete and noncomparable. Totals shown must be interpreted with caution.
a) Fiscal years starting on October 1.
b) Participant inflows for category 5 “Measures for the disabled” are not included.
Source: OECD (2002b), OECD Employment Outlook, Paris, July, pp. 326, 327, 328, 323,
Available from:<http://oecd.org.>; OECD (2004), OECD Employment Outlook, Paris, July 2004, pp. 320, 321, 323, 327, Available from:< http://www.oecd.org/dataoecd/42/55/32494755.pdf > [Accessed March 26, 2005] ; The data are compiled each year by the OECD on the basis of submissions from member countries. The programs have been classified into standardized categories and sub-categories. For their definitions, see OECD (1992) and (1994), Employment Outlook, Paris.
4
. Conclusion
In this study, it is concluded that the public sector plays an important role in the funding of all education in major industrialized countries. Public spending on primary, secondary, post-secondary and tertiary educational institutions is higher than private spending, while public sector programs generally are based on the low level of earnings, private sector programs are prepared to meet the higher quality and market needs than public sector programs. This shows that the public plays a balance role between education level and economic requirements.
Comprehensive internal rate of return for tertiary education is very high in the United Kingdom, the United States and France. It shows that there are strong incentives for the students in the education activity.
Germany and France has a significant share in labour market training as a percentage of GDP and France, Canada and Germany in participant inflows as a percentage of the labour force. It can be the result of the characteristics of job, working in different fields of workers irrelatively to their majors and desiring to increase the productivity.
References
ACEMOGLU, D. (2001). Human Capital Policies and the Distribution of Income: A Framework for Analysis and Literature Review, Treasury Working Paper, March. Available from: <http://www.treasury.govt.nz/workingpapers/ 2001/ twp01-3.pdf> [Accessed February 18, 2003].
. (1997) Training and Innovation in an Imperfect Labor Market,
Review of Economic Studies, volume 64, July, pp. 445-464.
AHN, S. & HEMMINGS, P. (2000) Policy Influences on Economic Growth in OECD Countries: An Evaluation of the Evidence, OECD Economic Department
Working Papers, 246 (19 June), Available from: <http://www.oecd.org/eco/eco>
[Accessed February 18, 2003].
ASHTON, D. & GREEN, F. (1997) Human Capital and Economic Growth, Options
Politiques, Juillet/Aout, Available from: <http://www.irpp.org/ po/archive/jul97/ashton.pdf> [Accessed January 23, 2003].
BARRO, R., J. & SALA-I -MARTIN X.(1995) Economic Growth, New York,:McGraw-Hill.
BARRO, R. J. (2001) Education and Economic Growth, Available from: <http:// www.oecd.org/pdf/M00008000/M00008442.pdf> [Accessed January 30, 2003]. . (1997) Determinants of Economic Growth: A Cross-Country
Empirical Study, Cambridge, MA: MIT Press.
BECKER, G. Human Capital, The Concise Encyclopaedia of Economics, Available from: <http://www.econlib.org/library/Enc/HumanCapital.html>, [Accessed January 24, 2003].
BECKER, G. S. (1993) Human Capital: A Theoretical and Empirical Analysis, with
Special Reference to Education, Third Edition, The University of Chicago Press,
Chicago and London.
BIRDSALL, N. (2001) Human Capital and the Quality of Growth, Development
Outreach, Winter, World Bank Institute, Available from: <http://www.
ciaonet.org/pbeifrm.html> [Accessed January 24, 2003].
BLÖNDAL, S. (2002) Investment in Human Capital through Post-Compulsory Education: The Impact of Government Financing, OECD Headquarters, Meeting of National Economic Research Organizations, July 1, Paris, Available
from: < http://www.oecd.org/dataoecd/22/42/34949912.pdf > [Accessed March 31, 2005].
BLÖNDAL, S., FIELD, S. & GIROUARD, N. (2002) Investment In Human Capital
Through Upper-Secondary And Tertiary Education, OECD Economic Studies, No. 34, 2002/I, Available from: <http://www.oecd.org/ pdf/M00039000/M00039266pdf> Accessed March 03,2003.
CASS, D. (1965) Optimum Growth in an Aggregative Model of Capital Accumulation, Review of Economic Studies 32(3), pp. 233-240.
GALOR, O. & WEIL D. N. (1998) Population, Technology, and Growth: From the
Malthusian Regime to the Demographic Transition, (August 19), Available
from: <http://atar.mscc.huji.ac.il/~melchior/conf-7-99/confpdfs/99-01.pdf> [Accessed January 24, 2003].
HECKMAN, J. J. (2000a) Policies to Foster Human Capital, JCPR: Policy Brief, Vol.2, No.1, University of Chicago, Available from: <http://www.jcpr.org/ policybriefs/ Vol2_num1.html> [Accessed February 18, 2003].
. (2000b) Policies to Foster Human Capital, The Harris School
Working Paper Series, Supplement 14, Available from: http://www.
ounceofprevention.org/ publications/pdf/Fostering_Human_Capital.pdf [Accessed January 30,2003].
KOOPMANS, T. C. (1965) On the Concept of Optimal Economic Growth in the
Econometric Approach to Development Planning , Amsterdam: North Holland. Role of Human Capital in Economic Development: Some Myths and Realities,
Available from: <http://www.unescap.org/drpad/publication/ldc6_2174/ chap1.PDF> [Accessed February 18, 2003].
KRUEGER, A. B. & LINDAHL, M. (2001) Education for Growth: Why and for Whom? Journal of Economic Literature, December, 39(4), pp.1101-1136. MANKIW, G. N. (1995) The Growth of Nations, Brookings Papers on Economic
Activity, 1.OECD, (2004), Education at a Glance, OECD Indicators, Available
from: <http://www.oecd.org/dataoecd/62/21/33670978.xls >[Accessed March 30, 2005].
OECD (2004), OECD Employment Outlook, Paris, July 2004, Available from:<
http://www.oecd.org/dataoecd/42/55/32494755.pdf > [Accessed March 26,
2005]
. (2003), Education at a Glance, Available from: < http://www.oecd.org/
dataoecd/0/40/14165184.xls > [Accessed March 31, 2005].
. (2002a) Education at a Glance, OECD Indicators, Paris, Available from:
<http://www.oecd.org/xls/M00035000/M00035132.xls> [ Accessed March 20, 2003].
. (2002b) OECD Employment Outlook, July, Available from: <http://www. oecd.org> [Accessed February 18, 2003].
. (2001a) The Well-Being of Nations: The Role of Human and Social
Capital,Centre for Educational Research and Innovation, Paris, Available from:
<http://www.oecd.org/pdf/M00021000/M00021936.pdf> [Accessed January 30, 2003].
. (2001b) Education at a Glance, OECD Indicators, Paris, Available from: < http://www.oecd.org/dataoecd/26/45/2672042.xls > [Accessed March 25, 2005] . (1998) Human Capital Investment: An International Comparison, Centre for
Educational Research and Innovation, Paris.
PISSARIDES, C. A. (2000) Human Capital and Growth: A Synthesis Report,
from: <http://www.oecd.org/dev/publication/tp1a.htm> [Accessed January 21,2003].
TEMPLE, J. (2001) Growth Effects of Education and Social Capital in the OECD Countries, 19 June, Available from: <http://www.oecd.org/pdf/M00002000/M00002096.pdf> [Accessed January 30, 2003].
RAMSEY, F. (1928) A Mathematical Theory of Saving, Economic Journal, 38, pp.543-559.
REDDING, S. (1996) The Low-skill, Low Quality Trap: Strategic Complementarities between Human Capital and R&D, Economic Journal, 106, pp.458-470.
ROMER, P. M. (2000) Should the Government Subsidize Supply or Demand in the Market for Scientists and Engineers, NBER Working Paper, No. 7723, June. . (1994) The Origins of Endogenous Growth, Journal of Economic
Perspectives, Vol.8, No.1, Winter, pp.3-22.
. (1993) Idea Gaps and Object Gaps in Economic Development,
Journal of Monetary Economics, 32(3), December.
. (1990) Endogenous Technological Change, Journal of Political
Economy, 98(5) Part 2, pp. 71-102.
. (1986) Increasing Returns and Long-Run Growth, Journal of
Political Economy, 94, pp.1002-1037.
RUSTINCHINI, A. & SCHMITZ, J. A. (1991) Research and Imitation in Long-run Growth, Journal of Monetary Economics, 27(2), pp.271-292.
SOLOW, R. M. (1956) A Contribution to the Theory of Economic Growth,
Quarterly Journal of Economics, 70(1), pp. 65-94.
UNESCAP, (2002) Role of Human Capital in Economic Development: Some Myths
and Realities, Available