ECONOMIC AND OPERATIONAL ANALYSIS OF
COMPRESSED AIR ENERGY STORAGE SYSTEMS
ESMA SEDEF KARA
KADIR HAS UNIVERSITY 2011
ECONOMIC AND OPERATIONAL ANALYSIS OF
COMPRESSED AIR ENERGY STORAGE SYSTEMS
ESMA SEDEF KARA
B.S., Industrial Engineering, Kadir Has University, 2009 M.S., Industrial Engineering, Kadir Has University, 2011
Submitted to the Graduate School of Kadir Has University
in partial fulfillment of the requirements for the degree of Master of Engineering
in
Industrial Engineering
KADIR HAS UNIVERSITY 2011
KADIR HAS UNIVERSITY
GRADUATE SCHOOL OF SCIENCE AND ENGINEERING
ECONOMIC AND OPERATIONAL ANALYSIS OF
COMPRESSED AIR ENERGY STORAGE SYSTEMS
ESMA SEDEF KARA
APPROVED BY:
Yrd. Doç. Dr. AHMET DENİZ YÜCEKAYA _________________________ (Thesis Supervisor)
Yrd. Doç. Dr. FUNDA SAMANLIOĞLU __________________________
Yrd. Doç. Dr. RIFAT GÜRCAN ÖZDEMİR __________________________
i
Economic and Operational Analysis of Compressed Air Energy Storage
Systems
Abstract
A Compressed Air Energy Storage System (CAES) is a way to store energy to be used when the demand for energy is high. In this system, the air is pumped into a cavern when the power price is low and the air is used in a natural gas fired turbine to generate power when the price is high aiming to make profit from this price difference. The system can pump or generate or do both. Typically the power price is low at nights and high during the daytime. However, the power and natural gas price along with the heat rate of the turbine should be included to the model to determine when the air should be pumped and when the power should be generated to maximize the revenue. In this research, a mixed integer programming method is developed to determine a pumping-generation schedule for the CAES given that market and natural gas price for each hour can be forecasted. Appropriate forecasting methods are used to simulate the power and natural gas prices for the analysis. The model is coded in General Algebraic Modeling System (GAMS) and a case study is presented to validate the model. In addition to scheduling of the CAES, another important contribution of this research is to develop a framework for investor companies who wish to build a CAES system. We develop 30-years long market price and natural gas price scenarios and we find annual profits through optimum scheduling of the CAES plant given that market price and natural gas prices are variable. Then we use appropriate engineering economics tools to estimate a Net Present Worth value of each different scenario for the decision makers of the investment companies.
ii
Basınçlı Hava Enerji Depolama Sistemlerinin Ekonomik ve Operasyonel
Analizi
Özet
Enerji, basınçlı hava enerji depolama sistemiyle talebin fazla olduğu zamanlarda kullanılmak üzere depolanır. Bu sistem ile hava elektrik fiyatının düşük olduğu zamanlarda depoya pompalanır ve elektrik fiyatının pahalı olduğu zamanlarda doğal gaz ile yakılarak elektrik enerjisine çevrilir. Havanın pompalanması ve elektrik enerjisinin üretimi sırasında elektrik fiyatı farklıdır. Elektrik fiyatındaki bu fark ile kar elde etmek amaçlanır. Basınçlı Hava Enerji Depolama sisteminde havanın pompalanması işlemi ve elektriğin üretimi farklı zamanlarda yapılabileceği gibi her iki işlemde aynı zamanda yapılabilir. Genellikle elektrik fiyatları gece saatlerinde ucuz olurken gün içerisinde pahalı olur. Doğal gaz ve elektrik fiyatlarıyla birlikte türbin ısı oranının modele dahil edilmesi geliri maksimize edebilmek için gerekmektedir. Bu çalışmada tahmin edilen elektrik ve doğal gaz fiyatlarıyla pompalama ve üretim zamanlarını belirleyebilmek için uygun karışık tamsayılı bir programlama yöntemi geliştirildi. Uygun tahmin modelleri elektrik ve doğal gaz fiyatlarını tahmin etmek için kullanılır. Model Genel Cebirsel Modelleme Sistemi (GAMS) programında kodlandı ve modeli doğrulamak için bir örnek çalışması sunuldu. Bu araştırmada CAES planlamasının yanı sıra CAES sistemi kurmak isteyen yatırımcılar için de önemli katkılar sağlandı. Araştırmamızda 30 yıllık elektrik ve doğal gaz senaryoları geliştirildi. Piyasa ve doğal gaz fiyat değişkenlerini göz önüne alarak CAES tesisi için optimum zamanlama ile yıllık kar bulundu. Daha sonra mühendislik ekonomisi araçlarını kullanarak yatırım şirketlerinin karar vericileri için her bir farklı senaryonun Net Bugünkü Değerlerini hesaplandı.
iii
Acknowledgements
In the first place, I would like to express my sincere gratitude to my advisor Yrd. Doç. Dr. Ahmet Deniz YÜCEKAYA. This research project would not have been possible without my advisor. I am heartily thankful him for the continuous support of my study and research, for his patience, motivation, enthusiasm, and immense knowledge who was abundantly helpful and offered invaluable assistance, support and guidance. His guidance helped me in all the time of research and writing of this thesis. I am indebted to him more than he knows. He contributed much to the development of this research starting from the early stages of my dissertation work. I thank him for his insightful suggestions and expertise. Also I would like to thank Mark Wyers for helping me grammar corrections.
Last but not the least; I would like to thank my family for all their love and encouragement. I would like to thank my parents’ İ.Selçuk and Bilsel KARA for giving birth to me at the first place and supporting me throughout my life. I thank my grandfather Fethi KARA, my grandmother Resmiye KARA, my aunt Tanzer KARA, my sister Sezin KARA, and my brother Ogün KARA for their patience and encouragement. Lastly I want to thank my all family for their endless support through this long journey. Thank you.
iv
vii
Table of Contents
Abstract iii
Özet iv
Acknowledgements v
Table of Contents vii
List of Tables ix
List of Figures xi
List of Symbols xiii
List of Abbreviations xvi
1 Introduction 1
2 Overview of Compressed Air Energy Storage 3
2.1 Compressed Air Energy Storage (CAES)...3
2.2 Why do we still need natural gas?...8
2.3 Energy Storage Technologies...9
2.3.1 Pumped-Hydro Storage...10
2.3.2 Compressed Air Energy Storage...11
2.3.3 Regenerative Fuel Cells...12
2.3.4 Batteries...12
2.3.5 Superconducting Magnetic Energy Storage (SMES)...13
2.3.6 Flywheels...14
2.3.7 Thermal...15
2.3.8 Hydrogen...16
2.4 Market Opportunities...16
2.5 What are the Modeling and analysis needs?...17
2.6 What is the Turkey’s Energy Policy?...19
3 Engineering Economics and Analysis 22
4 Problem Formulations and Modeling 25
viii
5.1 The Forecasting System...31
5.2 Electricity Market Price Forecasting Models and Simulation of Turkey…...33
5.3 Market Price Forecasting...34
5.3.1 Locational Market Price Forecasting…...36
5.3.1.1 Worst Locational Market Price Forecast Scenario...37
5.3.1.2 Low Locational Market Price Forecast Scenario...38
5.3.1.3 Current Locational Market Price Forecast Scenario...39
5.3.1.4 High Locational Market Price Forecast Scenario...39
5.3.1.5 Best Locational Market Price Forecast Scenario...41
5.3.1.6 Simulated Locational Market Price Forecast Scenario...42
5.3.2 Gas Price Forecasting...43
5.3.2.1 Worst Gas Price Forecast Scenario...44
5.3.2.2 Low Gas Price Forecast Scenario...45
5.3.2.3 Current Gas Price Forecast Scenario...46
5.3.2.4 High Gas Price Forecast Scenario...47
5.3.2.5 Best Gas Price Forecast Scenario...48
5.3.2.6 Simulated Gas Price Forecast Scenario...49
6 Multi- years Economical Analysis of CAES 51
7 Case Study 54
8 Conclusions 69
References 70
Appendix A: Locational Market Prices between 2012 and 2041 72
Appendix B: Gas Prices between 2012 and 2041 72
Appendix C: Yearly LMP and GP 72
Appendix D: Net Present Value between 2012 and 2041 73
Appendix E: The Payback Period for all Scenarios 74
E.1 Payback Period for Worst Price Scenario………..…………...………74
E.2 Payback Period for Low Price Scenario……..………...…………...75
E.3 Payback Period for Current Price Scenario……..……….…………76
E.4 Payback Period for High Price Scenario……..………...………..77
E.5 Payback Period for Best Price Scenario……..………...……...78
E.6 Payback Period for Simulated Price Scenario…..………...…..79
ix
List of Tables
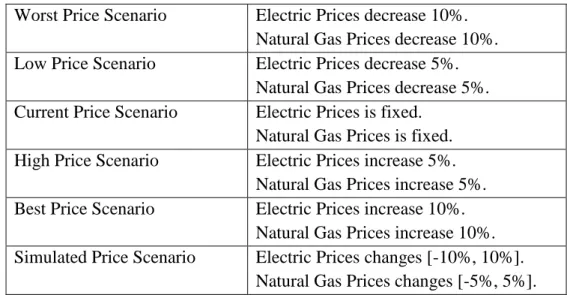
Table 5.1 Forecasting Scenarios of estimations…….……….35
Table 5.2 An example of Excel formulation about Worst LMP Forecast Scenario...38
Table 5.3 An example of Excel formulation about Low LMP Forecast Scenario…..39
Table 5.4 An example of Excel formulation about Current LMP Forecast Scenario.40 Table 5.5 An example of Excel formulation about High LMP Forecast Scenario….41 Table 5.6 An example of Excel formulation about Best LMP Forecast Scenario…..42
Table 5.7 LMP simulation rates for each year………43
Table 5.8 An example of Excel formulation about “Simulated LMP Forecast Scenario”……….43
Table 5.9 An example of Excel formulation about Worst GP Forecast Scenario…..44
Table 5.10 An example of Excel formulation about Low GP Forecast Scenario…...45
Table 5.11 An example of Excel formulation about Current GP Forecast Scenario..46
Table 5.12 An example of Excel formulation about High GP Forecast Scenario…..47
Table 5.13 An example of Excel formulation about Best GP Forecast Scenario…...48
Table 5.14 GP Simulation rates for ecah year………50
Table 5.15 An example of Excel formulation about “Simulated GP Forecast Scenario”……….50
Table 6.1 Technical and economical data of the CAES plant………53
Table 6.2 Technical and economical data of CAES plant………..53
x
Table 7.2 An example of NPV for “Simulated 2020” Scenario……….60
Table 7.3 NPV of Price Scenarios which includes next 30 years data………...61
Table 7.4 Payback Graph for the Worst Scenario………...62
Table 7.5 Payback Graph for the Low Scenario……….63
Table 7.6 Payback Graph for the Current Scenario………64
Table 7.7 Payback Graph for the High Scenario………65
Table 7.8 Payback Graph for the Best Scenario……….66
xi
List of Figures
Figure 2.1 Conceptual representations of CAES………..3
Figure 2.2 Conventional gas turbine with two-stage compressor and expander……..9
Figure 2.3 Benefits of Energy Storage along the Electricity Value Chain………….10
Figure 2.4 Schematic of a pumped-hydro storage plant……….11
Figure 2.5 Schematic of a Regenerative Fuel Cells plant………...12
Figure 2.6 Schematic of Battery technologies………13
Figure 2.7 Schematic of SMES technologies……….14
Figure 2.8 Schematic of Flywheel Technology………..15
Figure 2.9 Schematic of a Thermal Energy Storage System ………..15
Figure 2.10 Schematic of Hydrogen Energy Storage System……….16
Figure 2.11 CAES System Process……….18
Figure 4.1: CAES schematic………...26
Figure 5.1 Designing a Forecasting System………...31
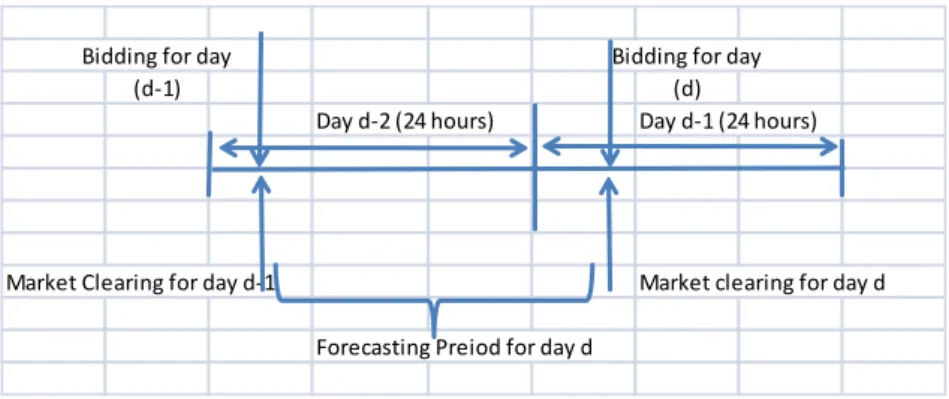
Figure 5.2 Time to Forecast Market Prices for day d……….33
Figure 5.3 The based data of LMP………..35
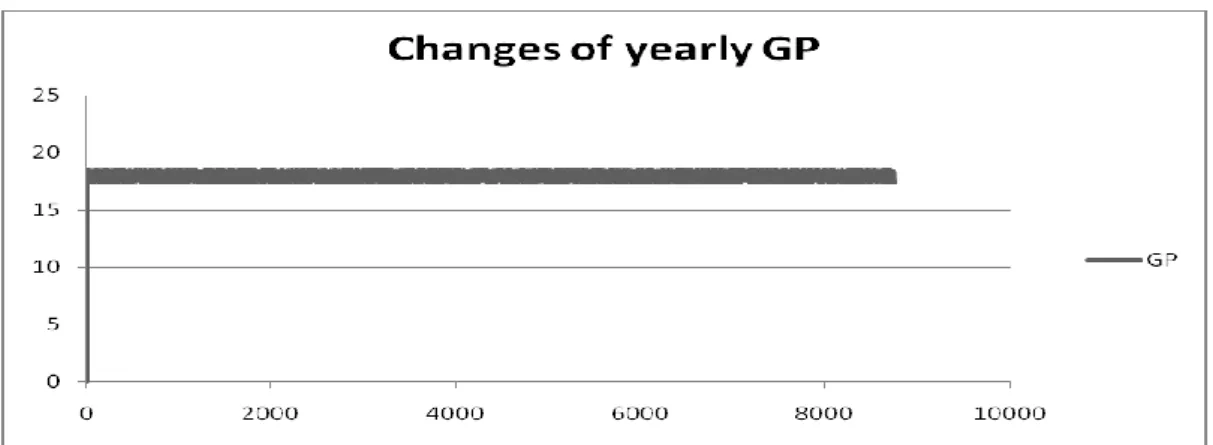
Figure 5.4 The based data of GP……….36
Figure 5.5 Weekly changes of GP for each hour………36
Figure 6.1 Procedure for multi-year scheduling of CAES………..51
Figure 7.1 An example of Wordpad document of “Simulated 2020”……….56
Figure 7.2 An example of CAES model at Gams ide tool description………...56
Figure 7.3 An example of Gams ide tool after running the model with “Simulated 2020” data………...57
xii
Figure 7.4 Gams ide tool solution for “Simulated 2020” data………57 Figure 7.5 Examples of weekly Generating Graph for “Simulated 2020” data……..58 Figure 7.6 Examples of weekly Pumping Graph for “Simulated 2020” data……….58 Figure 7.7: Examples of weekly relation between generating and pumping graphs for Simulated 2020………..……….58 Figure 7.8 Examples of weekly Inventory Graph for “Simulated 2020” data………59 Figure 7.9: The Payback Period Graph for all Scenarios………68 Figure 7.10: The Payback Year for all Scenarios………...68
xiii
List of Symbols
NOx: mono-nitrogen oxides CO: Carbon monoksit CO2: Carbon dioksit
PMIO: Perilenmanoimidoksit SOx: mono-sulfur oxides ZnBr: Zinc Bromide NaBr: Sodium Bromide NaS: Sodium Sulfur
Xt: is 1 if the power generated in hour t, 0 otherwise, Yt: is 1 if the pumping unit pumps in hour t, 0 otherwise,
It: is the compressed air inventory, in hours of generation available, in hour t, Ifirst: is the inventory of compressed air in the first hour,
Ilast: is the inventory of compressed air in the last hour, LMP: Locational Market Price,
GP: Gas Price,
PCAES: is the MW rating of the generating unit,
LMPt: is the load/gen LMP at the pumped air station bus, MPGAS: is the gas price in hour t,
PPUMPING: the MW Rating of the pumping unit, TLAST (T): last period,
Gen_cap: Generation Capacity, Gas_CT: The Mw rating of gas Ct, pump_cap: Pumping capacity of the unit, HRGAS: the heat rate of the gas CT,
VOM: Variable operating maintenance cost, VOM gen: the VOM generation cost,
xiv
NPH: Number of pumping hours consumed by each generating hours, NGH: Number of generating hours possible for each pumping hours, pump_stpcost: pump startup cost,
gen_stpcost: generator startup cost, Cef: Compressor Efficiency, Tsef: Turbine Efficiency, VOMcm: VOM compressor, X (T): Generation,
P (T): Pumping,
I (T): Compressed Air Inventory, Ps (T): Pump Startup time, Gs (T): Generator Startup time, Z: Total Cost,
NETREV: Total Cost
INV (T): Inventory Constraint UPPERX (T): Upper bound x UPPERP (T): Upper bound p UPPERI (T): Upper bound I GEN (T): Generation contraint IFIRST: Initial inventory TC (T): Terminal condition
PSE (T): Pumping startup equation GSE (T): Generator startup equation UPPER gs (T): Upper on gs
UPPER ps (T): Upper on ps LOWER ps (T): Lower on ps LOWER gs (T): Lower on gs; UPPERP 1(T): Upper bound p
Utc: If compressor started up at hour t, Utg: If generator is started up at hour t, Stc: Started- up cost of the compressor, Stg: Started- up cost of the generator, Pcomp: the MW Rating of the pumping unit,
xv
β: the number of generating hours possible for each pumping hour, μ: the assumed capacity of the facility in total pumping hours, ηc: Efficiency of the compressor.
xvi
List of Abbreviations
CAES: Compressed Air Energy Storage MW: Megawatts
EU: European Union
USA: united States of America
AEC: Alabama’s Electric Cooperative ESC: Energy Storage Council
FERC: Federal Energy Regulatory Commission RTO: Regional Transmission Organization
SMES: Superconducting Magnetic Energy Storage UWIG: Utility Wind Integration Group
AFS: American Flywheel Systems EÜAŞ: Elektrik Üretim Anonim Şirketi T.A.O: Türkiye Anonim Ortaklığı
US EPA: United State Environmental Protection Agency
NY DEC: New York State Department of Environmental Conservation DSİ: Devlet Su İşleri
ISO: International Organization for Standardization
NY ISO: New York State International Organization for Standardization ISEP: Iowa Stored Energy Park
VAR: Value at Risk
PHS: Pumped-hydro storage RFC: Regenerative Fuel Cells FES: Flywheel Energy Storage TVA: Tennessee Valley Authority
MARR: Minimum Acceptable Rate of Return VOM: Variable Operation Maintence
xvii
GP: Gas Price CT: Cycle Turbine GT: Gas Turbine
CCGT: Combined Cycle Gas Turbine ROR: Rate of Return
NPV: Net Present Value
SDF: System Imbalance Price (Sistem Dengesizlik Fiyatı) SMF: System Marginal Price (Sistem Marjinal Fiyatı) BEP: Break even Point
1
Chapter 1
Introduction
Renewable energy sources are necessary for energy efficiency. The world is focused on energy to increase efficiency. Energy security, climate change, fluctuating and rising oil prices are substantiated issues. The introduction of integrated storage technologies is a future sustainable energy system. CAES is an integrated storage techonology. CAES is a low cost technology for storing large quantities of electric energy with high pressure air. With this technology, air is injected at high pressure into natural caverns. This compressed air assists the operation of natural gas-fired turbines at the times when there is an increased need for electricity. For generating electricity, the compressed air makes it possible for to use less natural gas. In this system, the air is usually pumped into large storage tanks or natural caverns. This system stores the low-cost off-peak power. During the sale period, the electricity will be sold when it is more valuable. This report is intended to examine Economic and Operational Analysis of Compressed Air Energy Storage Systems.
The rest of the thesis is organized as follows. Chapter 2 presents an overwiew of Compressed Air Energy Storage System. In this chapter, descriptions of the system are detailed. The other energy storage techonologies, importance of natural gas, opportunities of the market, the necessity of modeling, the necessity of analysis and Turkey’s energy policy are explained in detail. Chapter 3 presents the engineering economics and analysis. I explain economical terms and I show the economical equations which I used to calculate NPV and PP. The problem formulation and the model of our problem are presented in Chapter 4. In this chapter the model is given and explained. Chapter 5 indented the forecasting system of LMP and GP, in which I developed the GP and LMP estimations with six different scenarios. Chapter 6 presents the economical analysis of CAES system for N years. The revenue and cost of the system is calculated in this
2
chapter and the technical and economical data of the CAES plant is also given. Chapter 7 presents a numerical analysis to validate our model. This chapter is based on the analysis of the CAES which is given in Chapter 6. The last chapter presents the conclusion of our report. In this chapter, I evaluate the financial results which are obtained in Chapter 7.
3
Chapter 2
Overview of Compressed Air Energy Storage
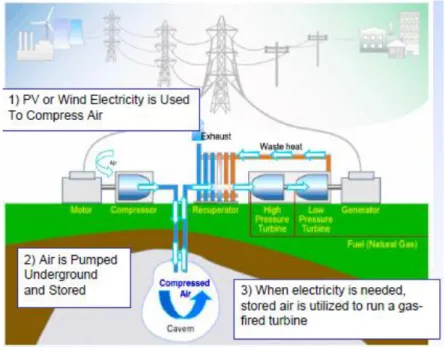
2.1 Compressed Air Energy Storage (CAES)
Compressed air energy storage (CAES) is a hybrid generation or storage technology. With this technology, air is injected at high pressure into natural caverns. This compressed air assists the operation of natural gas-fired turbines at times there is an increased need for electricity. For generating electricity; the compressed air permits the turbines by using less natural gas. Load-leveling is adopted via CAES because CAES is created in capacities of a few hundred MW and clearance over long (4-24 hours) periods of time. The potential energy of pressurized gas has a technique of storing energy which named as Compressed Air Energy Storage (CAES). In this system, the air is usually pumped into large storage tanks or natural caverns. Figure 2.1 shows a schematic of the approach.1
Figure 2.1: Conceptual representation of CAES
4
In CAES systems, if the energy is available, the air will run the air compressors. Then the compressors will pump the air into the storage cavern. When the electricity is demanded, it is expanded via conventional gas turbine expanders.
Huntorf Plant is the world’s first compressed air storage power station. In 1978, the Huntorf Plant has been ready for use. Huntorf is located in Bremen, Germany. The capacity of the plant was 290 MW. Providing peak shaving, spinning reserves and VAR support is done at Huntorf plant. Total volume of the plant is 11 million cubic feet. This plant has two underground salt caverns which is pressures up to 1000 psi inside and also situated 2100-2600 feet below the surface. The system is fully recharging 12 hours of off-peak power, and the delivering full output capacity of the system is up to 4 hours. 2
Alabama’s Electric Cooperative (AEC) is the world’s second CAES facility. AEC has been ready for use since 1991. It is called the McIntosh project. AEC is 110 MW units. Storing off-peak power, generating peak power and providing spinning reserve is using for commercial inference. The volume of the plant is 19 million cubic feet. The pressure of the system is up to 1080 psi and the deep of the system is up to 2500 feet. Full power output of the system is 26 hours. This system recovers waste heat. Fuel consumption is reduced via the waste heat. The waste heat is 25% less than the Huntorf Plant.2 http://www.caes.net/mcintosh.html
The Iowa Association of Municipal Utilities and the Department of Energy associated for creating the Iowa Stored Energy Park. They announced their decision in January of 2007. Their plan is integrating wind farm with underground CAES. The wind farm capacity is defined as a 75 to 150 MW and the capacity of CAES is defined as 3000 ft below the surface.2http://www.isepa.com
The world’s first wind turbine-air compressor is produced by Technology which is a compressor company in the Boston area. The capacity of these new wind turbines are nearly 1.5 MW.
5
Each wind turbine will pump air into CAES instead of generating electricity. With this approach; elimination of the intermediate and needless electrical generation between the turbine and the air compressor improve overall efficiency. And it also has the potential for saving money. http://generalcompression.com
According to research entitled CAES Scoping Workshop; there are several components for developing a successful CAES facility. First of all you need to have a Suitable Storage site. It has two types like above ground or below ground. Then the availability of transmission, fuel source and environmental and permitting issues are also very important for developing successful CAES system. For a successful CAES, there should be some several Permits. Air permits created by US EPA or NYS DEC. Some permits should be created such as; Water discharge (brine) permits, electric and gas sitting licenses and environmental permits, well drilling and testing permits, electric interconnect application process at NY ISO, Archaeological surveys for developing successful CAES facility. 3
The CAES value proposition and the best aspects is the other important subject for CAES system. More flexible generating alternatives are provided to Regional Transmission Organization (RTO) by CAES system. In generation, there is intrinsic value which can be rapidly rising and failing. There are fast ramping rates at CAES. Another result of the CAES Scoping Workshop research shows that; the valued capacity of CAES system can be operated among to 20% and 100%. Transmission constrains flexibility provides the RTO with means to maintain system security. The ability to store clean and off-peak generation until the peak hours are important advantages of CAES for the complete system. CAES has benefits in terms of cost and environment. Again, as we see in the research; the basic CAES internal value proposition items are providing energy at a thermal efficiency equal or higher to a combined cycle gas turbine with less than half the fuel and emissions of the former, capacity, and ancillary services. The external value proposition comes from the ability to dispatch lower cost or sustainable and renewable energy resources to meet hourly loads on demand. The ancillary and arbitrage benefits of adding the system in the grid is an advantage of the economical benefits of CAES. Optimizing the new build requirements for transmission is also advantage of the economical benefits of CAES. In cost analysis, the current production of RTO systems is necessary to make
6
model. Determining the cost benefits of the CAES system is possible via determining total system cost, and again with strategically situated CAES. A model using a specific RTO's set of circumstances is more effective than a generic model. The value of CAES is affected by the current load patterns and generation blend on the system. The CAES type is important for implementation of maximum CAES benefits to non carbon discharge generation. For instance, CAES has direct benefit with wind resources. If the system absorbed the much wind energy, CAES should reduce the transmission constraints. Energy stored off-peak and distributed on-peak is an advantage for all electric users. It decreases the on-peak prices.3
According to research entitled CAES Scoping Workshop ; the best ways for improving the capital cost and operational performance of CAES components and an integration to overall CAES plant via cut into 3 different parts.3
Near term: In Huntorf and MCLntosh, at the operational existing first generation CAES plants, the cost and performance of CAES equipment are well studied and at the second generation CAES design, the cost and performance of CAES equipment have been improved from the application of industry standard components. In the US, the CAES plants are supported by first generation or second generation CAES for improving cost and operation in the near-term. The CAES plants also based on improving the productivity of construction and consolidating operating experience and expertise.
Mid Term: a) an air driven turbine is necessary for the industry. Few suppliers are ready to supply larger than 85 MW air turbines. They give guarantees for performance. Operational flexibility is necessary for high pressure fired expanders b) Incorporating low emission or renewable energy heat sources for expanding the compressed air could minimize the use of fossil fuels.
c) The industry needs to develop semi-adiabatic systems. The new design’s compression discharge temperatures should be higher than current designs. The use of fuel is reduced via enabling efficient heat storage and recuperation.
Long Term: Advanced adiabatic systems can eliminate the use of fuel. High heat production needs compressors, heat capture and transfer media systems for studying.
7
Another result of the CAES Scoping Workshop shows that; there are some specific action items. These items would be very beneficial for a clear presentation of the CAES technology, CAES concepts, benefits and the operation of the two existing first Generation CAES plants. The items are: 3
An industry report will published on the subject.
The different concepts of the studies are direct through at journals and they are published in industry journals.
The items are current at RTO market participant workshops.
RTO planners have a come across discretely relationship with items.
UWIG organization is an example for identification of synergy. Working together is necessary to promote beneficial market rules.
Some several environmental advantages are defined in the introduction of CAES: 3
The amount of wind curtailment is decreased by strategically sited CAES. Otherwise that would occur their surplus generations without the ability of store.
Operating at a somewhat higher capacity level in off-peak hours with less clean technologies is permitted by CAES. Because, if we run the system, it will be more productive and clean range as a result of this permit.
Clean technologies and enable it to be delivered during peak hours increase the percentage of power generation in CAES system.
According to research entitled CAES Scoping Workshop ; If CAES produce less NOx, CO, CO2, PM10, SOx and other toxic emissions; CAES could be “greener” over its life cycle. Designing or choosing of fuel, considering the best available technology in term of low emissions and higher efficiencies, Controlling systems for better grid management, Using less water, Dry cooling, Preventing any direct environmental impact, and using pre-existing underground storage are all important issues for creating a greener CAES.3
As can be seen CAES system has several advantages and disadvantages. According to research of Boise State University is about the advantages of the CAES system. The advantages of CAES systems are; First of all, Ancillary services which are
8
provided to the grid have important advantage for implementing a CAES. Peak shaving; spinning reserve; VAR support; and arbitrage are included in Applications3.This system is enable to stored the energy for later time. In this system the energy can stored to use better time. Perhaps, it is an advantage to use energy when it is more valuable. If the CAES coupled with an irregular source such as wind energy, the benefits of CAES will especially compelling.1
Another result of the Boise State University research shows that CAES systems have several disadvantages. According to this research; there will be sure losses with any energy conversion. CAES system is a similar system with storage. Some of these losses are reduced in the procedure used by using the wind turbine to compress the air directly. The requirement for additional heating in the expansion process is the most important disadvantage of CAES. Generating should be 3 times to natural gas. For every 3 kWh generations from a CAES system; 1 kWh worth of natural gas is necessary. If the natural gas prices increase, the marginal economics of present CAES could fail.1
2.2 Why do we still need natural gas?
The requirements for additional fuel in the expansion process are one of the confusing aspects of the CAES. Gas compression and expansion are the reasons of the fundamental physics. Air compressors have cooling fins because when a gas is compressed, it gets warmer. Conversely, frost builds up on the shuttle fueling lines because when it expands, it gets cold.
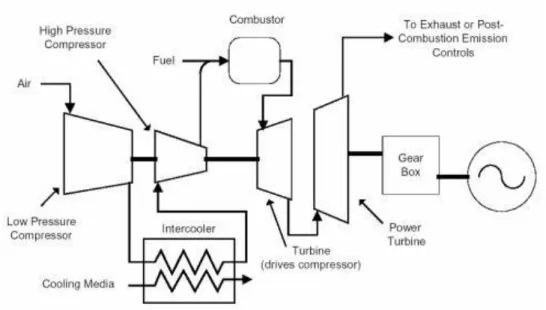
In the CAES expander systems, exist of the turbine would be nearly cryogenic in nature. A conventional gas turbine is a compressor-turbine combination, as seen in Figure 2.2. 1
9
Figure 2.2: Conventional gas turbine with two-stage compressor and expander. (http://www.energysolutionscenter.org)
Conventional gas turbine has a two-stage expander section. In the first expander section stage is committed to running the two-stage compressor and all of the energy goes to generating electricity. The mechanical energy generated in a conventional gas turbine. The quantity of the mechanical energy which used to run the compressor sections of the turbine is nearly 2/3. The expander does not drive the compressor when CAES system is used the air is already compressed.
According to this result, the net yield of the expander is increased by 3 times. Decreasing of the amount of gas required during expansion is proposed by different concepts. Waste heat from the compression cycles is recovered in the McIntosh Plant. The McIntosh Plant is reducing natural gas more than the Huntorf Plant. Decreasing gas consumption, eliminating fuel all over by capturing, storing and re- using heat are some of the hypothesis.3
2.3. Energy Storage Technologies
Energy storage is an economic decision. In the new power market, energy storage has vitally important role. The direct storage of electricity is very expensive so the electricity is stored in other forms. If the system needs electricity, the system will
10
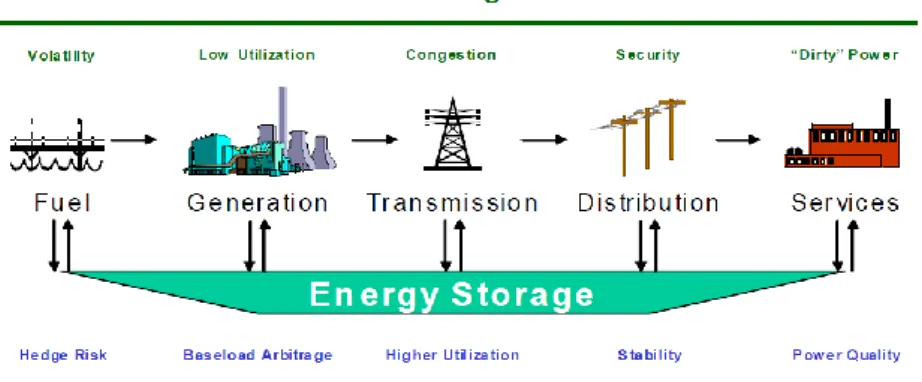
transform the electricity. The storing of power production is cheap at night so the system is storing power at night. There is five parts of the electric power market. Fuel/energy source, Generation, Transmission and marketing, Distribution, and Energy services are five base parts of the electric power market. Energy storage is very important issue and it is the “sixth dimension” of the electric power market. Integrating the existing segments and creating a more responsive market is the critical issues for Electric power market. Storage will improve the reliability of electricity supply. Increasing the productivity of existing power plant and transmission facilities can be done with storage. Storage also necessary to reduce the investment necessary in these facilities.4 there are also some basic benefits of Energy
Storages. We can show the challenges and benefits of the Energy Storage in Figure 2.3. In this figure we can see the benefits of the energy Storage with the challenges. 4
Figure 2.3 Benefits of Energy Storage along the Electricity Value Chain
Technologies are used commercially. Energy storage technologies are Pumped-Hydro Storage, Compressed Air Energy Storage, Regenerative Fuel Cells, Batteries, Superconducting Magnetic Energy Storage, Flywheels, Thermal and Hydrogen. 4
2.3.1 Pumped-Hydro Storage:
The oldest and largest technology of all the commercially available energy storage technologies is Pumped-hydro storage (PHS). The capacity of the storage is size up to 1,000 MW. Conventional pumped hydro facilities have two large reservoirs. One
11
of the reservoirs is located at a low level and the other of the reservoir is situated at a higher elevation. Water is stored at reservoir. The water is pumped from the lower to the upper reservoir, during off-peak hours. At electricity generation; the water is released back down to the lower reservoir, passed through hydraulic turbines and generate an electricity power. Generally, Pumped-hydro storage facilities operate on a daily schedule. There are only a few facilities because of the high construction costs, long construction times, and the requirement of large amounts of land.4
Figure 2.4 Schematic of a pumped-hydro storage plant (http://www.tva.gov/power/hydro.htm )
2.3.2 Compressed Air Energy Storage (CAES):
Pressing air into an underground reservoir via using off- peak power is defined as Compressed air energy storage (CAES) systems. The underground reservoirs can be salt cavern, abandoned hard rock mine, or aquifer. Then for power production, the system releases during peak daytime hours to power a turbine or generator. In this technology, the low-cost power from an off-peak base load facility is replaced for the more expensive gas turbine-produced power to compress the air for combustion. Nearly two thirds of the energy produced is used to pressurize the air, in a gas turbine. The only other commercially available technology is Compressed air energy storage. The great system energy storage ability is provided via CAES. The commodity storage or other large- scale setting is delivered ability by the great system energy storage. 4
12 2.3.3 Regenerative Fuel Cells:
Regenerative fuel cells are capable of storing and releasing energy. It is also known as redox flow-cell batteries. This is an energy which is through a reversible electrochemical reaction between two salt solutions (electrolytes).
There are some different designs exist. The electrolytes of the around exists are; zinc bromide (ZnBr), and sodium bromide (NaBr). In this system; the electrical energy is transformed to potential chemical energy. Then an electrochemical cell is created the release of the potential energy. An ion-exchange membrane is physically separated to each electrolyte. There is no discharge of the regenerative electrolyte solutions from the facility because the technology is a closed loop cycle. The size of the electrolytic tanks is defined in the scale of facility. Joining into CAES is promised via this technology and in this technology, hydro is pumped as large-scale energy storage options. 4
Figure 2.5 Schematic of a RFC plant (http://www.zestenergy.com/technology.php )
2.3.4 Batteries:
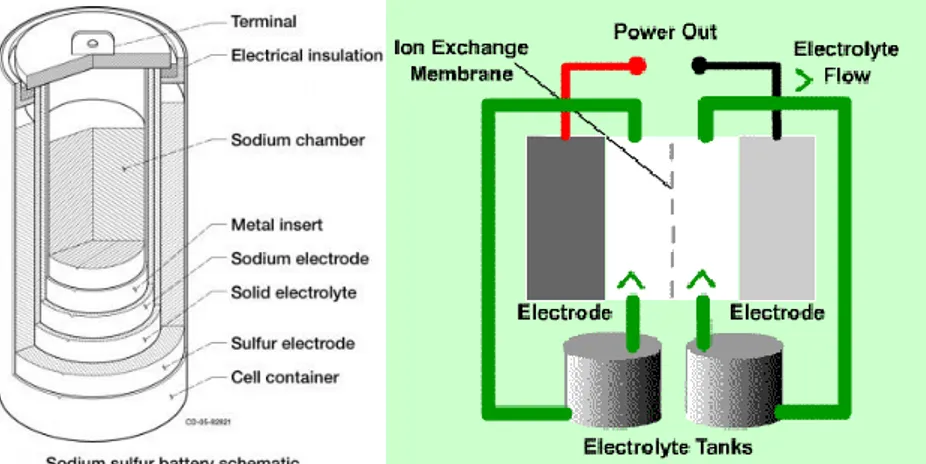
Battery technologies are using like utility-scale energy storage facilities. First of all, these installations have been lead-acid. Sodium sulfur (NaS) and Lithium ion are the other battery technologies. These technologies are conversional to commercially available. All batteries are electrochemical cells. Two electrodes are composed electrochemical cells. Electrolyte is separated the electrodes. Anode is the first electrode and cathode is the second electrode. During discharge, ions from the anode
13
are released into the solution and deposit oxides on the cathode. The system recharges the battery is reversing the electrical charge. This information is given at the ESC white paper research. “When the cell is being recharged, the chemical reactions are reversed, restoring the battery to its original condition” 4
Figure 2.6 Schematic of Battery technologies
( http://willyyanto.wordpress.com/2010/07/09/energy-storage-technologies-for-electricity-grid-infrastructure )
2.3.5 Superconducting Magnetic Energy Storage (SMES):
Superconducting Magnetic Energy Storage (SMES) is an emerging technology. In this technology systems store energy in the magnetic field. The flow of direct current creates energy in a coil of cryogenically cooled, superconducting material. Superconducting coil, power conditioning system, cryogenic refrigerator, and cryostat or vacuum vessel are parts of SMES system. The coil at the low temperature required can be keep with these components and maintaining of the coil in a superconducting state is possible with these components. SMES are greater than 95% efficient at storing electricity but the operating cost is very high because the construction of the system is very expensive. Just becasue of this, they are best suited to provide constant. SMES has deep discharges and constant activity. The size of facilities is around to 3 MW units.
Generally, the grid stability in a distribution system and the power quality at manufacturing facilities requiring ultra-clean power such a chip fabrication facility are providing via these facilities. 4
14
Figure 2.7 Schematic of SMES
2.3.6 Flywheels:
A flywheel energy storage system (FES) works by accelerating a rotor (flywheel) to a very high speed. Then the flywheel maintained the energy in the system as rotational energy. The advantages of the flywheel stores energy are high power output, long life, Unaffected by ambient temperature extremes. The challenges of the system are; Reduce cost of flywheel rotor and advanced magnetic bearing, mass produce with quantity, develop lightweight vacuum containment vessel, and reduce overall system weight. The battery systems are incompact and have upper maintenance costs and requirements than this system. The power quality and reliability market are the base issues for developing this technology. Active Power, AFS Trinity, Beacon Power, and Pentadyne Power Corporation are parts of the development.4
15
Figure 2.8 Schematic of Flywheel Technology
(http://www.pe.eee.ntu.edu.sg/Research/ResearchAreas/Pages/IEDS.aspx )
2.3.7 Thermal:
Thermal energy storage system is a high-tech energy storage technology. Ice-based for peak shaving commercial and industrial cooling are kind of thermal systems. Ices during off-peak hours are created by the ice systems. During the day, for large commercial buildings, the ice systems are used to supplement the cooling load. Operating costs of peak demand charges is allowed for smaller chillers and substantially lower air conditioning by the ice systems. The period of the sun’s daylight hours is important for Thermal energy storage technique. 4
16 2.3.8 Hydrogen:
Hydrogen energy storage will be an integral component of any post-fossil energy market. The hydrogen can be stored different forms like a gas, liquid, metal hydride, or carbon-based form. Then hydrogen is released through a chemical reaction to power a fuel cell. Chemical hydrides are the preferred method for long-term stationary storage.4
Figure 2.10 Schematic of Hydrogen Energy Storage System (http://www.oilempire.us/hydrogen.html )
2.4 Market Opportunities
Different business models have developed to take advantage of changing economic and technical market place realities according to the electric power industry evolves. The transformation will take place inside of the energy storage market. The business model is not sufficed so the system needs a functional operation to operate the system. There are four areas for multifunctional energy storage facility. They are base load arbitrage, transmission support, energy services, and renewable energy storage. First two exist is in the wholesale side of the market. The third exist is in the retail segment, and the fourth exist is depending upon the size of the renewable resource being developed in both the wholesale and retail market.4
Base load Arbitrage: The largest possible revenue generating market opportunity for large-scale storage facilities is represented to arbitraging base load nuclear and coal-fired generation between off-peak and on-peak hours. The number of factors which rested on is created by the quantity of revenue.
17
The difference between day and night prices will be the determining factor. Reaping the additional benefits from a better performing base load facility is possible with the storage facility which is owned by the same entity that owns the coal facility that will supply the power. 4
Transmission Support: Long time ago, FERC has brought to light as the deregulation of the industry’s center stage is transmission issues. The problem is added to simplification of additional power facilities and chronic transmission constraints for some regions. Putting off facilities and improving utilization abilities are interest to owners of transmission assets. Providing ancillary services, maintaining the grid’s stability, supporting a growing power trading market and relieving of congestion are related to RTO operators in storage facilities.4
Energy Services: Most of manufacturing and commercial companies installed protective gear. Their goal was minimizing impacts of outages during processes. The main reasons were avoiding from bad power quality and reliability. Enterprise energy management systems suppliers such as battery, flywheels, SMES and thermal systems producers began including storage facilities into their rollouts. 4
Renewables Energy Storage: Increasing renewable energy’s competitiveness by selling energy and selling capacity in market by the help of contingency services. Value could be added to electricity services by prepearing contacts for storage and discharge of energy. In addition to this capacity could be sold after dispatching power’s ability was sustained. 4
2.5 What are the modeling and analysis needs?
The first generation CAES plants are necessary to quantify the emissions profile. The reserve capacities of spinning and synchronizing according to Nox, CO, and CO2 emissions are over the operating range. Providing accurate emission estimation is necessary for comprehensive life cycle analysis of first generation CAES systems. And there should be balance comparisons between other energy generation, storage
18
options and first generation CAES systems. For CAES storage, Brine disposal has significant effect on the improving of salt formations. If it is using in the marketable products, safe disposal alternatives and options should be investigated.
Natural gas storage is completed into the CAES storage. The natural gas reservoir which is depleted is suitable for CAES. In the reservoir, the presence of natural gas should be safety. The detail analysis is necessary for this issue. Modeling of wind and solar resources activities at collaboration national labs and universities would be beneficial for integrating CAES. The CAES experiences of the European CAES community could be provided via this collaboration.
The other collaborative research is adiabatic CAES plants. The technical infrastructure is ready for adiabatic CAES. The theoretical efficiencies of this plant are not calculated. Designing of heat storage systems compression pressure, high end temperature design, selection of heat capture and selection of storage technology are some basic problems of Adiabatic CAES plants.4
19 2.6 What is the Turkey’s Energy Policy?
Turkey is a natural bridge between the energy producer Asian countries and energy consumer European countries. Turkey’s neighboring regions the Caucasus, Middle East and Central Asia are situated %70 of the known oil and gas reserves of the world. Although Turkey has the potential to play an important role over energy policies owing to its position as a transit country but it is not an energy producer country. In recent years, Turkey joins the pipeline projects and it has taken significant steps in order to have the transit country position.
On the other hand, Russia, the EU, and USA as global powers have different interests and try to benefit from the energy resources in these regions in line with their energy policy objectives. Economic and social factors affect the electrical energy demand. The demand of the Energy is impressed to the developments and growths in the industry sector.5
In 2008, our electricity has been realized as 198,1 billion kWh. In 2009, Turkey's gross electricity consumption decreased by 2,42%, regressing to 193,3 billion kWh.6
Compared to the previous year (198,4 billion kWh), our country's electricity generation also decreased this year by 2,02%,regressing to 194,1 billion kWh. Our electricity generation is expected by 2020 to reach 499 TWh with an annual increase of around 8% according to the higher demand scenario, or 406 TWh with an annual increase of 6,1% according to the lower demand scenario. As of 21 July 2010, our installed power has now reached 46.126 MW after the deployment of a new power plant of 1.479 MW. This information is given from the official site of the Republic of Turkey ministry of energy and natural resources. 6
Our electricity generation came from three main sources in 2009. The sources are natural gas by 48,6%, coal by 28,3%, hydroelectric by 18,5%, liquid fuels by 3,4%, and renewable resources by 1,1%. 6 Out of Turkey's total installed power 54,2% is in
EÜAġ, 16,4% in production companies, 13,7% in build-operate power plants, 8,1% in auto producers, 5,5% in build-operate-transfer power plants, 1,5% in transferred power plants, and 0,6% in mobile power plants as of the end of 2009.6
20
Private sector provides to Law No. 4628 for new production investments In line with the target of liberating the electricity market. Our country's installed power capacity went up from 31.750 MW to 44.600 MW between 2002 and 2009. During that period an additional capacity of 12.850 MW was deployed around 7000 MW. The privately invested power plants generate the additional capacity. 6
A new power plant of 3.002 MW was introduced to the system in 2009. In the privately invested power plants generate the additional capacity deployed 2.810 MW. For creating a transparent and competition-driven market in the electricity sector these initiatives are necessary and thus help to improve the investment environment.6
In 2010, our Ministry was temporarily agreement and gave license to 64 privately owned power plants for operation. Total installed power of these power plants were 1479 MW. Of all the power plants deployed,
2% is Geothermal (17 MW)
13% is Wind Power (330 MW)
29% is Hydraulic (486 MW)
2% is Landfill gas and Bio-gas (7 MW)
18% is Thermal (639)
60 MW of the thermal power comes from cogeneration power plants. By the end of 2010 year, privately owned installed power is expected to exceed 2400 MW. This information is also given from the official site of the republic of Turkey ministry of energy and natural resources 6
We can divide the policy of Turkey into terms like; between 1902 and 1923, between 1923-1933, between 1933-1950, between 1950-1960, between 1960 and 1980, between 1980 and 2001 and between 2001 to day time. The first electricity production was in Anatolia, at Tarsus. In 1902, on the Berdan River was carried out. The electricity was produced with the 2 KW power shaft belts which are connected to water mill. Then with this production a few residential and streets are illuminated. In 1913, Silahtarağa Thermal power plant is established in Istanbul by Macar Ganz
21
Company. This power plant has started production by 15 megawatts (MW) of power. This power plant was the first city-scale electric power plant between 1914 and 1983. In 1923, the government decided to meet the need of energy from the coal.
Kayseri and civan electric power plants are established in 11 October 1926. Then Zonguldak Çatalağzı power plant established and connected to Istanbul via power transmission line with 154kv energy. This line is the beginning of the international interconnected system. Seyhan dam and Hes, Sarıyer dam and Hes, Tunceli thermal power plant, Hirfanlı dam and HES are some of the power plants which are established between 1950- 1960.
Kuzeybatı Anadolu Elektriklendirme T.A.O., Ege Elektrik T.A.O. Çukurova Elektrik A.ġ. ve Kepez Elektrik A.ġ. are also established between 1950 and 1960. In 1974, AfĢin Elbistan thermal power plant is established and in 1984 it produced the energy. And in 1974, Keban dam and the four turbines are started to produce energy at Elazığ on the Fırat River. 7
Atatürk Dam is established in 1980-2001 at ġanlıurfa. Atatürk Dam is the biggest hydro electricity power plant in Turkey. 7 Altınkaya Dam is established in 1988 at Samsun, Oymapınar Dam is established in 1984 at Antalya, Hasanuğurlu Dam is established in 1981 at Samsun, Karakaya Dam is established in 1987 at Diyarbakır, Gökçekaya Dam is established in 1972 at EskiĢehir, Mezelet Dam is established in 1989 at KahramanmaraĢ, Adıgüzel Dam is established in 1992 at Denizli, Özlüce Dam is established in 2000 at Bingöl. All of those Dams are very important dams for our Energy requirements. 6
22
Chapter 3
Engineering Economics and Analysis
Justification and selection of projects are important parts of engineering economy. Many engineers work on a specified activity or a problem projects. Justification of any decision about the project is important. In business environments “profit” is the most important criterion. In manufacturing environment, decisions are made at the managerial level then many engineers become managers in manufacturing environment. Methods and tools used in evaluation of projects should known by all engineers, regardless of their employment. 8
The tools and methods which are used by individuals and non-profit organizations such as government, hospitals, and charitable entities, etc. are the sections of projects in business environment at engineering economy. Tools which used in engineering economy is aided many real life decisions. There are two criteria like monetary and nonmonetary criteria. In non-profit organizations, decisions are based on both of these criteria. If the two types of criteria are combining into one single measure, this poses will be an additional problem for evaluation of projects.
The methods which are used in evaluation of the projects are used according to engineering economy. Determining the “best” project or projects is the main objective. However, one method is discussing the benefit-cost analysis which is used for evaluation of projects in the non-profit sector. The tool is developed to know the needed variables which are named as costs, revenues, etc. 8
usually; there is a lot of possible alternatives.9
Each analysis must be considered, and always there should be an alternative. Both
choices of the opportunity costs must be considered. 9 Color, style, public image, etc.
23
In Engineering Economics; there are some terms we will often use in our project. The terms definitions are defined following; 10
Cash-Flow Concepts The inputs of the project is defined as monetary and the outputs of the project are defined as project investment.
Time value of money is defined as a relationship between time and dependent value of money. 10
Cash-Flow Diagrams; Drawing a picture for showing the economical analysis is the easiest way. Three things are important at these diagrams. Firstly, a time interval should divided into an equal periods. The deposits, expenditures, etc which are defined as all cash outflows should be in each period and the withdrawals, income, etc. which are defined as all cash inflows should be in each period. If there is not any extra information, all cash flows will be considered at the end of their respective periods. 10
Notation; Economic analysis are simplified by Notation. The types of cash flows and interest factors are represented via introduced symbols.
Interest Calculations; The use of borrowed money or the return on invested capital is defined as interest that means the money paid.The economic cost of money includes a factor. This factor can correctly establish the economic cost of construction, installation, ownership, or operation. 10
Simple interest principal amount is charging via interest rate.
F= P + i*P N
where
P=Principal amount
Ġ =Simple interest rate
N=Number of interest periods
F= Total amount accumulated at the end of period N
Discounting The present amount is defined as inverse of compounding. This amount will yield a specified future sum. This process is named as discounting.
Compound interest: Principal amount and any previously accumulated interest which has not been withdrawn is charging via interest rate. 10
24
1 2 2 = 1 N n=0: P n=1:F =P 1+i n=2: F F 1+i = P 1+i . . n=N: F = P 1+i Present worth: At the present or base time, future cash flows are discounting via this values. A present sum of money is converting the costs which are associated with each alternative investment and the best alternative is representing least of these values. The annual costs, future payments, and gradients should be included the present. Discounting is converting all cash flows to present worth.10
Annual Cost: All cash flows are changed to a series of uniform payments. This is necessary to compare alternatives by annual cost. Annual cost should cover current expenditures, future costs or receipts, and gradients. The lump-sum cash flow should be converted in a two-step process when a lump-lump-sum cash flow occurs at some time other than the beginning or end of the economic life. The first process is moving it to the present and the second process is spreading it uniformly over the life of the project. 10
Payback Period Analysis; A financial metric. This metric is an answer of “How long does it take for an investment to pay for itself?” Timing is not necessary to calculating all costs and profits. Payback period is the only result of the economic consequence. 10
Rate of return: The interest rate of the present worth of the net cash flow is zero.
Minimum acceptable rate of return; The project manager or company wishes the minimum rate of return acception on before starting a project. 10
The costs of Project / Investment
Payback Period
AnnualCashInflows
25
Chapter 4
Problem Formulation and Modeling for CAES
Compressed Air Energy Storage has a fairly low capital cost compared to other energy storage technologies. In a CAES facility, the natural gas is burned then the storage is heated with this energy. Then producing the electricity is happening according to expanded the combustion products in the turbine.11The air is added into
the storage by the compressor until full capacity reached. Then the generator expands the air to produce electricity until the empty level of storage reservoir is reached. This system is shown at the Figure 4.111The CAES unit can pump or generate in any
hour. CAES systems operate compression and expansion operations independently and same times. 12 As can be shown at the figure, the compressor injects the air to
storage from the compression operation. In the air storage, the pressure is high and the temperature is also high. Intercoolers are necessary to decrease or increase the temperature of the storage air. Then the Generation withdrawns air from the storage. In the pressurized air,natural gas is combusted.12
In the CAES analysis the most important issue is to decide which time is the best time for pumping the air or generating the electricity. One should know the market prices or at least can forecast the possible market prices in order to schedule a CAES system. Another important issue is the price of natural gas that is used in CAES system. That directly affects the profit and cost so it becomes an issue for scheduling. The CAES system has an air inventory that is filled while pumping and emptied while generating electricity as the air is used in turbine to generate electricity. The hourly profit is the revenue which is gained when the power is sold to the market, minus the cost which is the variable and operating cost, natural gas cost, and sum of startup costs. The sum of hourly profits over the year can give us the total profit of the corresponding year.
26
Figure 4.1: CAES schematic11
If the market prices and natural gas prices can be estimated for the future years, a scheduling based analysis can be provided for investors to help their decision. For this analysis, we calculated the Locational Market Prices and Gas prices for the next 30 years. The hourly data will show us which time is the best for generating or pumping. Our aim is to maximize the profit in our CAES analysis. The model is implemented at Gams and the solutions are found. Gams will solve the best generation or pumping hours for the maximum profit then will calculate the total cost for our system and the results of the data will show the investors how wise is their decision.The investors can decide to do or not to do their investment.
The capacity of the compressed air storage facility is important for CAES analysis. The capacity of the compressed air storage has different value for pumping and generating. The facility comes with a full inventory of compressed air and finishes with a full inventory of compressed air. So in our model we need to take into consideration of the capacity and inventory. The schedule of pumping and generation depends only on the relative prices and the capacity of the storage facility. The storage facility also has a system. The facility system is like that; if economics allows, the inventory of compressed air can be carried forward from one time period to another. In the CAES analysis model no fixed costs are considered.
27
The main objective of the model is maximization of the profit in the CAES analysis. The optimal annual operation is the other basic principle of the model. The proposed model is a mixed-integer linear programming model and formulated by the following notations.
Decision variables
Xt: is 1 if the power generated in hour t, 0 otherwise, Pt: is 1 if the pumping unit pumps in hour t, 0 otherwise,
It: is the compressed air inventory, in hours of generation available, in hour t, Utc: If compressor started up at hour t, (TL/Start-up)
Utg: If generator is started up at hour t, (TL/Start-up)
Parameters
Ifirst: is the inventory of compressed air in the first hour, (generation hours) Ilast: is the inventory of compressed air in the last hour, (generation hours) PCAES: is the MW rating of the generating unit, (MWh)
LMPt: is the load/gen Locational market price at the pumped air station bus, (TL/MWh)
PGAS: the MW rating of the gas cycle turbine, (MWh) HRGAS: the heat rate of the gas CT, (mmBTU/MWh) MPGAS: is the gas price in hour t, (TL/mmBTU)
VOM gen: the Variable operation maintenance generation cost, (TL/MWh) Stc: Start- up cost of compressor, (MWh)
Stg: Start- up cost of generator, (Hours)
Pcomp: the MW Rating of the pumping unit, (Hours)
¥: the number of pumping hours consumed by each generating hour, (Hours) β: the number of generating hours possible for each pumping hour, (Hours) μ: the assumed capacity of the facility in total pumping hours, (Hours) ηc: Efficiency of compressor.
28
The model is given as follows:
t CAES t GAS GAS GAS
t 1 X P ( LMP ) P * HR * MP Max (LMP ) * P – *P * * Gen T Comp Comp c c g g t t t t t t t c VOM VOM S U S U
(1) The problem is subject to the following constraints;(t 1) t (t 1) (t 1)
I
– I
¥ * X
P
0
(2) (t 1) tX
* I
(3)
tX
0,1
(Binary) (4)
t0,1
P
(Binary) (5) t0
I
(6) firstI
(7) lastI
(8) 1 c t t tU
P
P
(9) 1 g t t tU
X
X
(10)
,
0,1
c g t tU
U
(Binary) (11)The objective function is the revenue minus cost of natural gas, variable operating cost and startup cost. The first parenthesis equation represents the differences between the locational market price at the pumped air station bus and the variable operational maintenance generation cost at hour t. In the first part of the equation; the net market price at hour t is multiplied with the MW rating of the generating unit. The revenue at hour t is calculated with this equation. In the next equation, we need to calculate the cost of gas at hour t. In this part the rating of the gas cycle turbine is multiplied with the heat rate of the gas CT and it is multiplied with the gas price in hour t. In this part the system calculates the gas turbine’s cost at hour t. Then in the last parenthesis equation the function calculates the total pumping cost of the system.
29
The locational market price at hour t plus the variable operational maintenance pumping cost at hour t gives us the total cost of the pumping station. The efficiency of the compressor and turbine efficiency are also included. Then the pumping cost at hour t is multiplied with the MW Rating of the pumping unit for total pumping cost. The last part of our objective function has two binary equations. The explanation of the first binary equation is, if the compressor is started up at hour t, the started up cost of the compressor will affect the function at hour t. If the compressor is not started up at hour t, the started up cost of the compressor will not affect the function at hour t. The explanation of the next binary equation is, if the generator is started up at hour t, the startedup cost of the generator will affect the function at hour t. If the generator is not started up at hour t, the started up cost of the generator will not affect the function at hour t. The detailed GAMS formulation can be found in Appendix F.
Equation (2) represents the inventory. The differences between the inventory at (t+1) and at t should be equal to the differences between the unit pumping in hour (t+1) and the unit generation in hour (t+1).
Equation (3) represents the relation between the inventory and generation hour. The power generated in hour (t+1) should be less and equal to possible number of generating hours for each pumping hour times inventory at t.
Equation (4) represents the binary for a generating hour. This equation means, if the system generates, Xt will be 1. If the system does not generate, Xt will be zero.
Equation (5) represents the binary for a pumping hour. This equation means, if the system pumps, Pt will be 1. If the system does not pump, Pt will be zero.
Equation (6) represents for inventory. The inventory cannot be less than zero and more than. In the equations (7) and (8), the first and last inventory is equal to.
Equation (9) represents the compressor’s start up time. The differences between pumping hour at (t) and (t-1) should be less than the compressor’s start up time at hour t.
30
Equation (10) represents the generator’s start up time. The differences between generating hour at (t) and (t-1) should be less than the generator’s start up time at hour t.
Equation (11) represents the binary equations for the compressor’s and generator’s start up time. If the compressor or generator starts up at hour t, the Utc and Utg will be 1; ifthe compressor or generator does not start up at hour t, the Utc and Utg will be zero.
To optimize the scheduling of the facility, we need to know the forward market prices, forward natural gas prices and the value of the CAES air inventory. In the next section, we provide an analysis on how to determine the market prices and natural gas prices.
31
Chapter 5
Market Price and Gas Price Forecasting
5.1 The Forecasting System
Forecasting is a method for estimating the value of unknown parameters with using the value of known parameters under the described conditions. Forecasts provide information to make better decisions. The designing procedure of a forecasting system is shown at Figure 5.1. 13
Figure 5.1: Designing a forecasting system.14
NO YES YES NO NO YES NO YES Forecast Need Data Available Analyze Data Quantit ative ? Causal Factors? Collect Data Qualiative Approach Choose Method Validation Causal Approach Select Model Choose Method Estimate Parameters Model Validation Time series Approach Select Model Choose Method Estimate Parameters Model Validation