HİSSE SENEDİ PİYASASINDA YATIRIMCI DUYARLILIĞI
IMKB’da İşlem Gören Banka Hisse Senetleri Örneği
SENEM ÖZDOĞAN
105625010
İSTANBUL BİLGİ ÜNİVERSİTESİ
SOSYAL BİLİMLER ENSTİTÜSÜ
FİNANSAL EKONOMİ YÜKSEK LİSANS PROGRAMI
SİNA ERDAL
2009
İSTANBUL BİLGİ UNIVERSITY
FACULTY OF ECONOMICS AND ADMINISTRATIVE
SCIENCES
Investor Behavior in a Stock Market:
The Case of Bank Stocks in the Istanbul Stock Exchange
Senem Özdoğan
Istanbul May 2009
Investor Behavior in a Stock Market:
The Case of Bank Stocks in the Istanbul Stock Exchange Hisse Senedi Piyasasında Yatırımcı Duyarlılığı IMKB’da İşlem Gören Banka Hisse Senetleri Örneği
Senem ÖZDOĞAN 105625010
Tez Danışmanı : Sina Erdal, MA
Jüri Üyelesi : Asst. Prof. Dr. Orhan Erdem Jüri Üyelesi : Asst. Prof. Dr. Koray Akay Tezin Onaylandığı Tarih : 06.05.2009 Toplam Sayfa Sayısı: 35
Anahtar Kelimeler Key Words
1) Yatırımcı Duyarlılığı 1) Investment Behavior
2) Sürü Psikolojisi 2) Herd Behavior
3) Rasyonel Yatırımcı 3) Rational Investor
Abstract
This thesis aims at providing evidence on whether financial investors in the Istanbul Stock Exchange Market follow herd behavior or not. The hypothesis tested is: Stock investors in the Istanbul Stock Exchange Market investing on banking sector stocks do follow herd behavior. Before testing our hypothesis for our preliminary study we test the rationality of investors using a panel data model and find out that publicly available information plays no significant role in explaining stock returns. Based on these findings we move on our hypothesis to test whether they exhibit herd behavior by using the well known the Christie and Huang (1995) model. For our hypothesis of herd behavior, results from Christie and Huang model indicate that daily returns over the most recent 503 days show no evidence of herd behavior in the stock market of the banking sector in Turkey, contrary to their interpretation.
Acknowledgments
I am deeply thankful to my undergraduate years’ Assistant Professor Dr. Nazmi Demir that he inspired me to write this dissertation, also shared his acknowledgments, ideas and time with me to improve my research.
Özet
Bu tezin amacı; hisse senedi piyasalarında işlem yapan finansal yatırımcıların yatırım kararlarını sürü psikolojisi ile hareket ederek verip vermedikleri hakkında kanıt bulmaktır. Hipotez test edilmeden önce ön çalışma olarak, İstanbul Menkul Kıymetler Borsası’nda işlem gören banka hisse senetlerine yatırım yapan yatırımcıların, bankaların finansal performans bilgisini takip ederek yatırım kararlarını veren rasyonel yatırımcılar olup olmadıkları araştırılmıştır. Regresyon analizleri ile yapılan bu araştırmanın sonucunda, yatırımcıların rasyonel olduklarına dair kanıt bulunamamıştır. Elde edilen bu verilerin ışığında sürü psikolojisi hipotezi Christie and Huang (1995) modeli kullanılarak test edilmiştir. Banka hisse sentlerinin 503 günlük getirisi ile kurulan Christie and Huang modelinin sonucunda; yatırımcıların Türkiye’de işlem gören banka hisse senetlerine, sürü psikolojisi ile yatırım yaptıklarına dair kanıt elde edilememiştir.
Table of Contents
1. Introduction...1
2. Literature Review Regarding ‘Herd Behavior’...3
3. Data Description...6
4. Methodology and Results...8
5. Discussion of Findings and Policy Implications... 15
6. Conclusion... 18 7. Bibliography... 20 8. Table A... 21 9. Table B...22 10. Table C...23 11. Table C-Expressions...24 12. Table D... 25 13. Table E... 26 14. Appendix A...27 15. Appendix B...28
Introduction
Understanding the investment behavior of market participants and its ensuing impact on security prices have been subject to a great volume of academic research. Investment behavior of participants in the stock market is generally associated with factors such as investment horizons, the performance of equities, return volatility and the behavior of other investors (Chang, Cheng and Khorana, 2000). This paper aims to examine the investor behavior in the Istanbul Stock Exchange Market, focusing specifically on 11 publicly traded bank stocks.
The tendency for investors to imitate the behavior of others in capital markets is called ‘herding’. This term is examined by Nofsinger and Sias as ‘a group of investors trading in the same direction over a period of time’ while, Banerjee (1992) proposes a herd involves ‘everybody doing what everyone else is doing even when their private information suggests doing something else.’ Thus, ‘herd behavior’ is associated with the concept of free riding at zero-cost information.
We test the null hypothesis that the investors in bank stocks are irrational and specifically, follow herd behavior.
Before testing our hypothesis, we aim to check if the investors of banking stocks are rational who make their decisions objectively using market information to take the advantage of the opportunities available to them. We assume that rational investors can easily access banks’ balance sheet and income statement information and form their investment decisions mainly based on these. We compute accounting ratios used in CAMEL rating computations, by using publicly available balance sheet and income statement data and estimate multiple regression equations associating quarterly bank stocks’ returns with these ratios. The aim of these regressions is to carry out
preliminary investigations to try to see if a relationship between bank performance and investor behavior is associated.
Our regression results indicate that there is no evidence for significant relationship between banks’ financial performance and stock investor behavior. Hence, we move on to testing our hypothesis that makes a specific claim regarding the form of irrationality.
We test our hypothesis using Christie and Huang’s (1995) cross sectional standard deviation (CSSD) model. With using this model, we try to find out if there is a herd behavior in the ISE market particularly in bank stocks. By utilizing the Christie and Huang (1995) model we argue that, when a market move can be categorized as an extreme gains and/or loss, the banking sector stock investors base their investment decisions on aggregate market behavior so that, the returns of the banking stocks will not deviate too far from the market return. Our results for our hypothesis indicate that there is no herd behavior in ISE banking sector stocks based on Christie and Huang (1995) model.
Literature Review Regarding ‘Herd Behavior’
The existence of herd behavior among specific participants in speculative markets is the subject of a number of studies in behavioral finance. One of the earliest studies that attempt to detect empirically herding behavior in financial markets comes from Christie and Huang (1995). A difficulty encountered in many of studies is distinguishing between irrational herding behavior and homogeneous expectations, both of which can lead an investor to make the same trades as another. Traditional asset pricing theory predicts that the dispersion of returns increases with the aggregate market return due to varying stock sensitivities to market returns. Since dispersion measures the average proximity of individual returns to the mean, when all stock returns move in perfect unison with the market, dispersion is zero. When individual returns differ from the market return, however, the level of dispersion increases. Christie and Huang (1995) contend that, if investors ignore the idiosyncratic features of stocks, security returns will ‘be swept along’ with the market, resulting in a lower than average level of dispersion during periods characterized by large market movements. In short, if individuals ignore their beliefs and base their decisions solely on the market consensus during periods of relatively large price movements, the stock returns will not deviate too far from the market return. So that, if herding behavior occurs in an equity market during period of stress or high volatility, the dispersion should increase at a decreasing rate or simply as a negative function of price movements in the case of severe herding. They measure the market impact of herding by considering the dispersion or the cross-sectional standard deviation (CSSD) of returns using daily and monthly returns on U.S. equities and find a higher level of dispersion around the market return during large price movements, which is evidence against herding.
Chang, Cheng and Khorana (2000) modify the Christie and Huang’s (1995) approach. In place of CSSD, they use the cross-sectional absolute standard
deviation (CSAD) of returns as a measure of dispersion to find herding in the U.S., Hong Kong, Japanese, South Korean and Taiwanese markets. They contend that their model is less stringent though it is premised on similar intuition. Their alternative empirical model is based on the emphasis that capital asset pricing models predict not only that the dispersions are an increasing function of the market return, but is also linear. Thus, in the presence of herding behaviour, the linear and increasing relation between dispersion and market return will no longer be true. They find no evidence of herding on the part of market participants in the U.S. and Hong Kong and find partial evidence of herding in Japan. However, for South Korea and Taiwan, the two emerging markets in their sample, they document significant evidence of herding.
In Hwang and Salmon’s (2001) working paper, the herd measure is simply the cross-sectional dispersion of betas and evidence of herding is indicated by a reduction in this quantity. They apply the test to an analysis of the US, UK, and South Korean stock markets. This study proposes a new measure and test of herding which is based on the crosssectional dispersion of factor sensitivity of assets within a given market. They find statistically significant evidence of herding towards ”the market portfolio” during relatively quiet periods rather than when the market is under stress.
In a recent study, Gleason, Mathur and Peterson (2003) use intraday data to examine whether traders herd during periods of extreme market movements using sector Exchange Traded Funds (ETFs). Two procedures, one based on identifying extreme up market and down market periods (Christie and Huang (1995)) and the other based on incorporating a nonlinear term in a regression specification (Chang, Cheng and Khorana (2000)), are used to identify the possibility of the existence of herd behavior in nine sector ETFs traded on the American Stock Exchange. They find no evidance of herding during periods of extreme market movements using ETFs.
More recently, Sharma, Easterwood and Kumar (2004) argue that herding would be more likely within industry sectors than across the entire market. Moskowitz and Grinblatt (1999) provide evidence of a strong industry momentum effect in the industry components of stock returns, supporting the idea of herding at an industry level. However, aside from Christie and Huang’s (1995) study, Sharma, Easterwood and Kumar’s (2004) investigation of herding in new economy stocks during the period 1998 to 2000, literature considering the tendency for investors to herd within specific industries is scant.
In our emprical work inspired by the Christie and Huang (1995) studies, we try to find some evidence of herd behaviour in Istanbul Stock Exchange Market focusing on banking sector stocks.
Data Description
Our data consists of balance sheet, income statement, daily prices at ISE and quarterly prices at ISE information on 11 publicly traded Turkish banks. These are; Akbank, Alternatifbank, Finansbank, Fortisbank (Dısbank), Garanti Bank, Isbank, Sekerbank, Tekstilbank, Yapı Kredi Bank, Development Bank of Turkey and Industrial Development Bank of Turkey.
The balance sheet and income statement data and their release dates are obtained from the web site of the Istanbul Stock Exchange Market and the web sites of the chosen banks. The web site addresses are listed below.
www.imkb.gov.tr www.akbank.com.tr www.abank.com.tr www.finansbank.com.tr www.fortis.com.tr www.garanti.com.tr www.isbank.com.tr www.sekerbank.com.tr www.tekstilbank.com.tr www.yapikredi.com.tr www.tkb.com.tr www.tskb.com.tr
As seen in Table A; Returns per quarter are between 14 % for Finansbank and 2 % for Yapı Kredi Bank. The high standard deviations show that returns on bank stocks demonstrate considerable volatility. In fact, as can be seen from the coefficient of variations the most relatively risky stock for the sample period appears to be Yapı Kredi Bank (with CV=18.52) and the most relatively stable stock is Finansbank (with CV=2.26). To interpret these results one can say that for every 1 % return the total risk expressed in standard deviation was 18.52 % for Yapı Kredi Bank and only 2.26 % for Finansbank. On the other hand, bank performance criteria (the ratios) differ from one another
asset quality; Industrial Development Bank of Turkey are the leading banks. In terms of non-performing loans the best ratio is for Akbank, on the other hand Finansbank leads in profitability and finally Fortisbank is the leading bank for liquidity.
The data for testing our hypothesis are the daily returns of the 11 banks between December 14, 2006 and December 15, 2008. (503 Days) The daily closings prices of the selected 11 bank stocks are obtained from the Matrix Terminal and the daily returns of the stocks are calculated from these closing prices. In Table B, we report statistics of means, maxima and minima for the daily returns of the chosen 11 banks and XU100, for 503 days. As it is seen on the Table B, the means of the stock returns except Finansbank, Garantibank and Yapı Kredi Bank are all negative. The standard deviations of the daily stock returns are between 0.0230 (Istanbul Stock Exchance National 100 Index) and 0.0398 (Tekstilbank). On the other hand Finansbank stock return on 21.07.2008 with 25.63 % is the maksimum of the returns and Tekstilbank stock return on 10.06.2008 is the minimum of the entire data.
Methodology and Results
In this dissertation before testing our herd behavior hypothesis, we carry out some preliminary work to investigate whether investors make investment decisions based on publicly available information, CAMEL ratings in this case.
We assume that the ISE obeys the semi-strong form of the efficient market hypothesis (EMH) which states that financial investors use all of the available market information before they make their investment decisions. This means that prices of securities fully reflect publicly available information. Investors will have incentives to spend extra time and resources to uncover new information only if these efforts will bring out extra returns. We believe that in emerging markets such as the Turkish Market, not all of market information is available to public and investors are not as conscious of the market information as in developed markets such as those of the USA. The EMH is generally classified into three versions: The weak form EMH, the semi-strong form EMH and strong form EMH. The weak form asserts that stock prices already reflect all market information pertaining to past trading. The semi-strong form states that prices already reflect all publicly available information on fundamental data on the firms’ outputs, quality of management, balance sheet compositions, earnings etc. The strong form EMH asserts that stock prices do not only reflect all market information but also inside information (Bodie, Kane and Marcus 1998).
For preliminary investigations, multiple regression equations associating quarterly bank stocks’ returns with key performance ratings regarding CAMEL-bank performance criteria are calculated. The aim of these regressions is to define a relationship between the banks’ performance and the act of financial investors.
The CAMEL is a supervisory rating system for evaluating banks’ overall financial condition. The components of the CAMEL criteria are; Capital adequacy, Asset quality, Management, Earnings and Liquidity.
As evaluating the solidity of Capital, the effect of credit, market, and other risks on the banks’ financial condition should be considered.
The Asset quality rating reflects the quantity of existing and potential credit risk associated with the loan and investment portfolios and other assets, as well as off-balance sheet transactions.
The capability of the board of directors and management, in their respective roles, to identify, measure, monitor, and control the risks of an institution’s activities in compliance with applicable laws and regulations is reflected in
Management rating.
The Earnings rating reflects the quantity and trend of earnings and also the factors that may affect the sustainability or quality of earnings.
In evaluating the adequacy of a financial institution’s Liquidity position, consideration should be given to the current level and prospective sources of liquidity compared to funding needs. The funds management practices should ensure that the bank is able to maintain a level of liquidity sufficient to meet its financial obligations in a timely manner.
One ratio is chosen for each rating for the regressions; shareholders’ equity/total assets is for capital adequacy, total loans/total assets is for asset quality, percentage of non-performing loans in total loans as a proxy for management, return on equity (ROE) is for earnings and liquid assets/total assets is for liquidity rating. The ratios are calculated from the quarterly balance sheets and income statements between 2000 and 2007 of the chosen banks.
Our model specification, to reflect this study, is simply a multiple regression model of the following form:
Ri = α + ßc Ci +ßL Li + ßB Bi + ßAAi + ßE ROEi + ui. (1)
Where ui is assumed to be N ~ (0, σ2).
Omitting the time subscript, the right-hand exogenous variables are roughly the ratings inspired by CAMEL criteria by which banks are rated. i stands for bank i, C for capital adequacy, L for liquidity, B for non-performing loans as a proxy for management quality, A for asset quality and ROE is the proxy for shareholders equity all for bank i. If the null hypothesis is correct then one expects that ßC>0, ßL>0, ßB<0, ßA>0 and ßE>0 and all significant at least at
α =0.05 probability level. On the other hand, one concludes that investors do not follow the market information if none of the conditions predicted by the model is observed. This would mean that bank stock investors invest irrespective of the bank performance criteria from this view of regression results.
In empirical work, five versions of regressions are applied to the data. i.; Regression of quarterly stock returns with banks’ performance ratios without lags; ii.; Regression of quarterly stock returns with banks’ performance ratios with one quarter-lag, on the assumption that investors do not have access to publicly announced performance criteria information immediately when needed. Banks are allowed by authorities to report their financial statements quarterly by certain dates with deadlines. As we observe the financial statement announcement days of banks, we find out that banks do submit their financial statements quarterly by the deadlines or even with some delays. For example, the balance sheets for the quarter January-March are submitted some time late in May. This would suggest that if investors are conscious of bank performance criteria they could have access to the required information at the
knowledge at the time the investors make their decisions. With this reasoning, regression models are also ran with one quarter-lag of the performance criteria listed above. iii.; Additional regressions are also ran with residual returns obtained through the Capital Asset Pricing Model (CAPM) after accounting for market systematic effects as follows:
Uit = Rit – αˆi −βˆi Rmt (2)
Where Uit are residual returns (errors from the CAPM), Rit are observed
returns from stock i in time t, and αˆi −βˆiRmt is the return accounted by the market.
It is known that residuals (Uit) are the random effects after we account for the
market effect. They are that part of the returns that are not associated with the market Istanbul Stock Exchange (ISE) but are linked with the bank management in question. These residuals represent that part of the returns commonly known as bank-specific unsystematic residual rates of return, whose variance (or standard deviation) stands for unsystematic risk that is related to bank management. iv.; Hence as another model specification we have employed these residual returns as the endogenous variable in the regression with five performance ratings listed above. The motivation for this version is that investors are aware that the market systematic risk effect on returns is beyond the control of banks and banks cannot do anything to prevent these effects. Hence, banks’ stocks returns may be better represented by the residual returns that are outcomes of the banks’ performance criteria. Thus, the new version of the regression model becomes as follows.
Ui = α + ßC Ci + ßL Li + ßB Bi + ßAAi + ßE ROEi + ei (3)
Where ei is assumed to be N ~ (0, σ2). Ui are the residuals obtained from the
If the null hypothesis is correct then one expects that ßC>0, ßL>0, ßB<0, ßA>0
and ßE>0 and all significant at least at α =0.05 probability level.
Empirically this model is also run without lag and with one-lag.
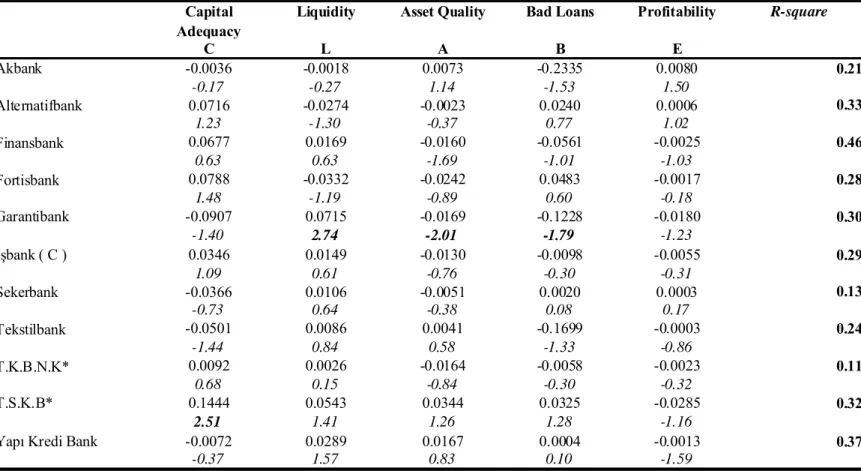
In short for each of the eleven banks five version and in total 55 regressions are ran in order to get some evidence that investors are rational. The regression results based on returns with criteria of one-lag are reported on Table C.
As shown on the Table C, and explained in the Discussion of Findings and Policy Implications Section, regression results do not provide any evidence that investors act in line with bank performance criteria.Thus, regarding to our regression results, we could say that the stock investors do not follow information on fiscal performance in the banking sector of ISE.
As we have seen that we have no evidence that the stock investors are rational, in the sense that they do not follow market information and not invest in accordance with information made publicly available, we embark on our main hypothesis empirically to see whether they exhibit herd behavior.
Our hypothesis, -the herd behavior hypothesis- is tested with the Christie and Huang (1995) model. The reasoning underlying this model is that if the investors ignore their beliefs and instead decide in relation to the decisions of others (imitate others) during periods of relatively large price movements and therefore extreme gains or losses, the stock returns will not deviate too far from the market return. In other words, the dispersion in returns is expected to decrease during periods of extreme price movements when there is herd behavior as everyone imitates everyone. This reasoning runs against the capital asset pricing models (CAPM) which predicts that the dispersion which stands for risk (standard deviation) should increase with the market return. Accordingly, the dispersion measured as the cross-sectional standard deviation
CSSDt =sqrt[∑(Rit-Rmt)2/(N-1)] (4)
Where Rit and Rmt are, respectively, the observed daily return of stock i and
the market on day t, and N is the number of stocks in the portfolio. Let DL is equal to 1 if the market return on day t lies in the extreme lower tail of the distribution, and equal to 0 otherwise; and DUis equal to 1 if the market return on day t lies in the extreme upper tail of the distribution, and equal to 0, otherwise. These dummy variables arerelated with CSSD in order to capture differences in investor behavior in extreme up or down against relatively normal market rates:
CSSDt = α + β1 DtU + β2 DtL + εt (5)
In econometrics, it is known that the use of non-stationary data can lead to spurious regression (Brooks, Chris 2002). In other words, regression estimates based on non-stationary time series are not consistent and they cannot be relied upon because of the ordinary least square estimates would not have the required properties. In short, the R2 and the t-statistics may look good but the relationship cannot carry any meaningful message (Griffiths Hill and Judge 1993). Hence, time series, closed prices for this study, must be cleaned from the non-stationary process. Unit root tests are applied to bank stock prices in the sample and on ISE-100 index using the Augmented Dickey Fuller test based on the following equation:
Δ yt = ψ yt-1 + ∑pi αi Δyt-i + ut (6)
The null hypothesis is Ho: ψ = 0 and if accepted there is unit root (random
walk) and by first differencing, the series will be generally cleaned from the unit root. The results of the ADF are reported in the Table D.
As it is observed from the table, only four of the variables have no unit root and therefore they appear to be stationary. However, the rest of the variables have unit roots meaning that they are generated by random walk. Given that, the majority of the banks’ stocks are involved with unit roots, we obtain our beta coefficients for 11 banks using the first differences of time series in order to be on the safe side.
In CSSD test, market stress is associated with the condition when the market returns lie in the upper and lower of the market return distribution. If there is herd behavior, the coefficients of β1 and β2 in the above regression should
carry negative signs and be significantly different from zero based on t-test. On the other hand, if both of the coefficients of these dummy variables are significant and carry positive signs, then it is empirically concluded that herding behavior is not detected. To see the sensitivity of CSSD in response to the dummies DU and DL regressions are ran for alpha=1 %, 5 % and 10 % of upper and lower market returns. However the dummy coefficients are found to be all positive and highly significant in all cases.
Discussion of Findings and Policy Implications
In this section, we present our findings for the hypothesis. For our pre study results The Table C shows the regression results where returns are assumed to be determined by bank performance criteria set one lag behind. Of the 55 partial regression coefficients only 4 appear to be significant at least 5 % alpha level. Some limited effect on bank stock returns comes from non-performing loans (B) in the sense that coefficients carry negative signs as expected in general and some are significant at least at
α
=10%. The significant regression coefficients of non-performing loans belong to Akbank and Garantibank. Moreover, the coefficients of multiple determinations (R2) range are between0.11 and 0.46. It is clear, based on these findings; that financial investors do not seem to invest in line with bank performance criteria. Nor are the findings from the regressions (3) where the endogenous variable is defined as the errors i.e., residual returns after accounting for the market effects, supportive of the return-bank performance association. This is indeed what we expect prior to our analysis. The ISE market is relatively a recent market and the depth in terms of volume and number of transactions is not at the levels comparable with the advanced markets. Particularly, small and medium size investors and those investing below lot are suspected to behave in different manners than an efficient market. On the other hand, the institutional investors and foreigners might have been more rational than others might. Nevertheless, in this case, it could be thought that big investors and foreigners may have manipulated the market. In which case returns on stocks would be again not associated with bank performance criteria. However, this line of reasoning and analysis are beyond the scope of this thesis and are left out. All one can conclude is that results do not support that returns on the banking stocks’ are effected by bank performance criteria and hence there does not seem to have an efficient market structure where investors make use of all the information available to them.
The findings from the Christie and Huang (1995) model on our herd behavior hypothesis are included in Table E. Based on the sample data of the most recent period of 503 daily returns all for eleven banks’ stocks; the t-ratios carry positive signs and are highly significant. According to Christie and Huang (1995), the results reject the hypothesis of herd behavior because both βU and
βL coefficients carry positive signs. This implies that when the market enters the extreme boundaries in terms of gains or losses, the collective dispersions of bank stocks returns are not converging, but just the contrary they are spreading apart from one to another. This in turn indicates that groups of investors are not acting in cohesion but moving in different directions when they are making their decisions.
According to the literature, the herd behavior is also nicknamed as information cascades arising from differences in market information (Sushil Bikhchandani and Sunil Sharma 2001). If investors are not conscious of market information for rational decisions then several other investors are likely follow the act of a minority group, which may be very wrong in their assessment. If investors are wrong and invest in a wrong stock or a set of stocks in herds then because of their unfortunate experience or the losses they occur will soon change their minds and perhaps lead to another herding investment. This type of herd behavior, if realized, is likely to increase volatility of prices and returns. Secondly, there is another type of herd behavior known as intentional herding that is likely to bring about increased volatility in prices and stocks (Grinblatt, Titman and Wermers 1995). The reasoning is as follows; investors invest with regard to recent past outcomes of returns in the market. This is known as the momentum-investment strategy where investors buy the recent winners and sell the recent losers. Considered as irrational, this type of herd behavior tends to increase price and return volatility. If the above discussions are taken into account, the regression results from CSSD presented in Table E point out to a higher dispersion in CSSD since the βU and βL are both positive and highly significant. This would mean that as the market ISE is running in the extreme
banking stocks are herding in different directions so as to result in higher volatility in prices and returns relative to the over-all market performance.
Conclusion
In this paper, we examine the behavior of stock investors in Istanbul Stock Exchange Market, specifically investments on banking sector stocks. The empirical analysis is focused on eleven publicly offered banks’ in ISE. For our pre study before testing our hypothesis, we assume that the investors are rational and Istanbul Stock Exchange Market has the semi-strong form of Efficient Market Hypothesis. Multiple regression equations, associating quarterly bank stocks’ returns with respect to CAMEL-bank performance criteria are ran to argue. We assume that the stock investors should have fiscal performance information of banks delayed that the banks performances criteria in the regressions are set one lag behind. However, only the eight of fifty-five regression results for the first model have been significant at least 10% alpha level and only consistent effect on bank stock returns come from non-performing loans of three banks with negative signs as expected. With regard to the regression results, it is obvious that the stock investors of banking sector in ISE are not rational. In other words, they do not follow the banks’ fiscal performance criteria while they are investing in banks’ stocks. As we, all know that ISE market is an emerging and relatively young market that stock investors should behave different from the investors in efficient markets. So that, we move on to our hypothesis that the investors follow a herd-behavior process.
We assume that investors are buying and selling stocks in accordance with others’ decisions as Christie and Huang (1995) studies. We use two dummy variables; DL and DU to find out the extreme upper and lower tails of the CSSD. According to the Christie and Huang (1995) model, the dummy variables must be significantly negative; however, in our empirical test the dummy variables carry significantly positive signs. Thus, our work seems to suggest that there is no evidence of herding at ISE, when we use the
and Huang study is not the only empirical study of herd behavior in stock markets; there are other notable works on herd behavior in the finance literature. These alternative herd behavior models can be used for future research. Using stock return data from industries other than banking is also an avenue for further research on this topic.
Bibliography
Banerjee, A., 1992,‘A Simple Model of Herd Behavior’, Quarterly Journal of Economics 107.
Bodie Z., Kane A. and A.J.Marcus, 1998, ‘Essential of Investments’, 3rd Ed. Mc Graw Hill.
Brooks, Chris, 2002, ‘Introductory Econometrics for Finance’, Cambridge University Press.
Christie, W.G. and R.D. Huang, 1995, ‘Following the Pied Piper: Do
Individual Returns Herd Around the Market?’ Financial Analysts Journal 51. Gleason, K.C., I. Mathur and M.A. Peterson, 2004, Analysis of Intraday Herding Behavior Among the Sector ETFs, Journal of Empirical Finance 11, 681-694.
Griffiths, W.E., R. C. Hill and G.G. Judge, 1993, ‘Learning and Practicing Econometrics’, John Wiley & Sons Inc.
Grinblatt, M., S. Titman and R. Wermers, 1995, ‘Momentum Investment Strategies, Portfolio Performance and Herding: A Study of Mutual Fund Behavior’, American Economic Review 85.
Hwang S. and M. Salmon, 2001, ‘A New Measure of Herding and Empirical Evidence’, Working Paper (City University Business School, London). Lakonishok, J., A. Shleifer and R.W. Vishny, 1992, ‘The Impact of Institutional Trading on Stock Prices’, Journal of Financial Economics. Nofsinger, J.R., and R.W. Sias, 1999, ‘Herding and Feedback Trading by Institutional and
Individual Investors’, Journal of Finance 54.
O’Hara Maureen, 2000, ‘Market Microstructure Theory’, Blackwell Publishers.
Sushil Bikhchandani and Sunil Sharma, 2001, ‘Herd Behavior in Financial Markets’, IMF Staff Papers V.47.
TABLE A
Coefficient of Variation
Capital-Adequacy Asset-quality Management Earnings Liquidity
Bank Name Statistics
Returns per Quarter St.Dev./Mean Shareholder's Equity/Total Assets Loans/Assets Percentage of bad loans in t.loans Returns on Equity (ROE) Liquid Assets/T.Assets Akbank Mean 0.07 13.62 37.43 0.02 18.41 47.15 St.Dev. 0.19 2.74 2.82 9.71 0.06 8.43 9.39
Alternatif Bank mean 0.03 6.34 42.42 7.74 12.01 27.01
St.Dev 0.25 7.06 4.83 20.69 7.94 10.93 7.69
Finansbank Mean 0.14 10.69 47.99 2.22 51.31 28.21
St.Dev 0.32 2.26 2.3 16.77 3.04 15.22 3.02
Fortisbank Mean 0.09 13.69 39.65 1.26 4.86 47.32
St.Dev 0.31 3.58 2.65 13.78 1.14 1.28 12.58
Garanti Bank Mean 0.08 9.76 37.96 3.4 5.22 31.88
St.Dev. 0.25 3.1 1.21 13 2.87 3.5 2.9 Isbank Mean 0.04 16.62 32.11 7.91 13.04 42.59 St.Dev. 0.26 7.02 2.37 6.79 11.67 11.86 7.81 Sekerbank Mean 0.08 8.28 33.95 9.43 16.22 30.67 St.Dev. 0.34 4.15 3.02 15.33 12.35 11.1 8.45 Tekstilbank Mean 0.07 8.45 42.57 1.45 1.68 32.81 St.Dev. 0.28 3.79 3.41 22.76 1.51 1.65 7.18 TKBNK* Mean 0.04 66.89 38.72 10.42 23.4 33.43 St.Dev. 0.27 6 6.69 6.53 11.74 9.53 14.47 TSKB* Mean 0.13 15.1 49.16 2.33 5.22 27.45 St.Dev. 0.37 2.87 1.48 4.48 3.17 3.52 9.12 YKB* Mean 0.02 11.7 37.82 23.36 25.19 26.45 St.Dev. 0.28 18.52 4.35 13.59 37.48 41.88 9.22
Returns on Stocks and Selected Performance Ratios of the Chosen Banks by Quarters, for the period 2001-Q1 to 2007-Q4
TABLE B
XU100* AKBNK* ALNTF* FINBN* FORTS* GARAN* ISCTR* SKBNK* TEKST* YKBNK* TKBNK* TSKB* Mean (%) -0.0006 -0.0002 -0.0016 0.0004 -0.0012 0.0002 -0.0003 -0.0005 -0.0011 0.0003 -0.0019 -0.001 Standart Deviation (%) 0.023 0.0336 0.0318 0.0318 0.0327 0.0359 0.033 0.038 0.0398 0.0326 0.032 0.0278 Maximum (%) 0.1289 0.2087 0.1467 0.2563 0.1744 0.1724 0.1739 0.1832 0.2481 0.1167 0.1417 0.0928 Maximum Date 19.09.2008 19.09.2008 27.11.2008 21.07.2008 14.10.2008 19.09.2008 19.09.2008 14.02.2007 27.03.2008 30.07.2008 22.11.2007 10.09.2008 Minimum (%) -0.0862 -0.1138 -0.134 -0.1392 -0.0992 -0.1055 -0.1061 -0.1181 -0.1967 -0.1484 -0.157 -0.098 Minimum Date 10.06.2008 10.06.2008 10.06.2008 10.06.2008 15.09.2008 19.11.2008 17.10.2008 17.10.2008 10.06.2008 10.06.2008 05.06.2008 10.10.2008 *See Appendix B
TABLE C C L A B E -0.0036 -0.0018 0.0073 -0.2335 0.0080 0.21 -0.17 -0.27 1.14 -1.53 1.50 0.0716 -0.0274 -0.0023 0.0240 0.0006 0.33 1.23 -1.30 -0.37 0.77 1.02 0.0677 0.0169 -0.0160 -0.0561 -0.0025 0.46 0.63 0.63 -1.69 -1.01 -1.03 0.0788 -0.0332 -0.0242 0.0483 -0.0017 0.28 1.48 -1.19 -0.89 0.60 -0.18 -0.0907 0.0715 -0.0169 -0.1228 -0.0180 0.30 -1.40 2.74 -2.01 -1.79 -1.23 0.0346 0.0149 -0.0130 -0.0098 -0.0055 0.29 1.09 0.61 -0.76 -0.30 -0.31 -0.0366 0.0106 -0.0051 0.0020 0.0003 0.13 -0.73 0.64 -0.38 0.08 0.17 -0.0501 0.0086 0.0041 -0.1699 -0.0003 0.24 -1.44 0.84 0.58 -1.33 -0.86 0.0092 0.0026 -0.0164 -0.0058 -0.0023 0.11 0.68 0.15 -0.84 -0.30 -0.32 0.1444 0.0543 0.0344 0.0325 -0.0285 0.32 2.51 1.41 1.26 1.28 -1.16 -0.0072 0.0289 0.0167 0.0004 -0.0013 0.37 -0.37 1.57 0.83 0.10 -1.59 Alternatifbank R-square Sekerbank Tekstilbank Finansbank Fortisbank Garantibank İşbank ( C )
Summary of Regression Results with Returns on Bank Stocks (Endogenous) and Ratios of CAMEL Criteria Proxies (Exogenous), with one quarter-lag, Over the Quarters 2001-Q1-2007-Q4
Numbers in italics are t-statistics, bold ones are significant least at alpha = 0.05.
Capital Adequacy
Liquidity Asset Quality Bad Loans Profitability
Yapı Kredi Bank T.K.B.N.K* T.S.K.B* Akbank
Table C-Expressions
C Capital adequacy= Shareholders’ Equity/Assets corrected with credit, market and operational risk,
A Asset quality = Total Loans /Total Assets,
E Earnings proxies by return on equity ROE= Net after tax profit/ Shareholders’ Equity. L Liquidity =Total Liquid assets/ Short term liabilities,
B Bad loans/Total Loans,
The first row of each bank contains partial regression coefficients associated with the five bank performance criteria and the second row shows the t-statistics in parenthesis.
Table D
ISE-100 and Banks UNIT-ROOT at Level
ISE-100 INDEX No AKBANK No ALTERNATIFBANK Yes* FINANSBANK Yes* FORTISBANK Yes* GARANTI BANK No ISBANK ( C ) No SEKERBANK Yes* TEKSTILBANK Yes*
YAPI-KREDI BANK Yes*
DEVELOPMENT BANK OF TURKEY Yes*
INDUSTRIAL DEVELOPMENT BANK OF
TURKEY Yes*
Results of Augmented Dickey-Fuller unit-Root tests for Quarterly Bank Stock Price Data
Source: Tests based on Augmented Dickey-Fuller With intercept. No trend was detected in all series. *We use the first differences for regressions.
Table E
Based on 1% of the top (DU=1) and 1% of the bottom (DL=1) of Market Returns
Variables Coefficients t-ratios
Intercept 0.0331 46.091 Adjusted R-square =0.22
DU 0.0474 6.614 F-statistic =71.3
DL 0.0717 10.009 Number of Observations=503 daily returns
Based on 5% of the top (DU=1) and 5% of the bottom (DL=1) of Market Returns
Variables Coefficients t-ratios
Intercept 0.0309 46.535 Adjusted R-square =0.39
DU 0.0172 5.933 F-statistic =157.2
DL
0.0494 16.998 Number of Observations=503 daily returns
Based on 10% of the top (DU=1) and 10% of the bottom (DL=1) of Market Returns
Variables Coefficients t-ratios
Intercept 0.0295 43.071 Adjusted R-square =0.43
DU 0.0071 3.537 F-statistic =187.0
DL 0.0389 19.297 Number of Observations=503 daily returns
Appendix A
Expression 2 has been carried from the Capital Asset Pricing Model; E(Ri)=Systematic risk+unsystematic risk
As;
E(Ri)=Rf+Bi(Rm-Rf)+Ui,
By rearranging the equation;
Appendix B
XU100...Istanbul Stock Exchange National 100 Index AKBNK...Akbank ALNTF...Alternatifbank FINBN...Finansbank FORTS...Fortisbank GARAN...Garanti Bank ISCTR...Isbank C SKBNK...Sekerbank TEKST...Tekstilbank YKBNK...Yapı Kredi Bank
TKBNK...………...Development Bank of Turkey