IS S N 1 3 0 3 –5 9 9 1
PARAMETER ESTIMATION IN MULTIPLE LINEAR REGRESSION MODELS USING RANKED SET SAMPLING
YAPRAK ARZU ÖZDEM ·IR, A. ALPTEKIN ES·IN
Abstract. In statistical surveys, if the measurements of sampling units ac-cording to the variable under consideration is expensive in all sense, and if it is possible to rank sampling units according to the same variable by means of a method which is not expensive at all, in those cases, Ranked Set Sampling (RSS) is a more e¢ cient sampling method than the Simple Random Sampling (SRS) to estimate the population mean. In this study, the e¤ects of using RSS in multiple linear regression analysis are considered in terms of estimation of model parameters. Firstly, according to RSS and SRS the estimates of multiple regression model parameters are obtained and then the e¤ects concerning the variances of the estimators are investigated by Monte Carlo simulation study based on Relative E¢ ciency (RE) measure. It is shown that the estimators obtained based on RSS are more e¢ cient than the estimators based on SRS when the sample size is small.
1. Introduction
Recently, especially in the studies relating to areas of ecology, agriculture and medicine, it is a widely encountered situation that the measurement of the variable under consideration is too costly or too di¢ cult in aspects of time and labor. So, in such areas, it is needed to prefer a sampling method in which the population is represented by the smallest sample size in a best way possible. Such a sam-pling method aiming at this is initially suggested by McIntyre [7] with the name of Ranked Set Sampling (RSS). McIntyre indicates that RSS is a more e¢ cient sampling method than Simple Random Sampling (SRS) method for estimation of the population mean.
In RSS, the sample selection is composed of two stages. At the …rst stage of sample selection, m simple random samples of size m are selected from an in…nite population and each sample is called as set. Equivalently, m2units may be drawn
from the population and randomly partitioned into m equal samples. Then, each Received by the editors Nov. 3, 2006; Rev: Feb.3, 2007; Accepted: Feb. 26, 2007.
2000 Mathematics Subject Classi…cation. Primary 62DO5; Secondary 62J05.
Key words and phrases. Simple Random Sampling, Ranked Set Sampling, Order Statistics, Relative E¢ ciency, Regression Analysis.
c 2 0 0 7 A n ka ra U n ive rsity
of observations are ranked from the smallest to the largest according to variable of interest, say Y , in each set. This measurement is such a low level measurement which does not cost too much and the ranking of the units can be done by the help of previous experiences, a visual ranking or by the help of a concomitant variable. At the second stage, the …rst observation unit from the …rst set, the second observation unit from the second set and going on like this mth observation unit from the
mth set are taken and measured according to the variable Y with a high level of
measurement satisfying the desired sensitivity. To provide necessary measurements for inference, the entire process (or cycle) can be replicated r times, thus yielding n = mr measured units out of m2r selected units. Under the assumption that there
is no ranking error, these n measured units constitute the ranked set sample which is denoted by Y(i)j; i = 1; 2; :::; m; j = 1; 2; :::; r . So, the unbiased estimator of
the population mean is de…ned as YRSS = 1 mr m X i=1 r X j=1 Y(i)j
[7]. Dell and Clutter [6] showed that, even if there are an errors in ranking, YRSS
is an unbiased estimator of the population mean and furthermore that, V ar(YSRS)
V ar(YRSS)
1
where YSRS is the SRS sample mean with size n and equality occurs only if the
ranking is so poor as to yield a random sample.
RSS is preferred for obtaining e¢ cient parameter estimations in many statisti-cal analyses. The use of RSS in the linear regression model for the …rst time is introduced by Stokes [12]. Stokes estimated the population mean by modeling the relation between concomitant variable and variable of interest. Muttlak [8, 9] con-sidered RSS for simple and multiple regression models. For both cases, he adopted the unequal variance assumption for the regression errors. However; he did the parameter estimation by using the Least Squares Estimation (LSE) method. So, under his model assumptions there is no improvement in estimating the model pa-rameters. Barnett and Barreto [1] considers simple linear regression model with replicated observations obtained from RSS. Optimal-L estimators of model para-meters are obtained under the assumption that dependent variable has normal dis-tribution and the ranking is perfect. They showed that the RE gains can be high for the simple lineer regression coe¢ cients. Samawi and Ababneh [11] examined RSS method in simple linear regression model and they assume that variables in the model (X; Y ) have a bivariate normal distribution. Also, parameter estimation is done with LSE method under the assumption that the error term of the model is constant variance like SRS. They conclude that, RSS provides a more e¢ cient way to do regression analysis. Chen and Wang [5] considered optimal sampling schemes
with di¤erent optimality criteria in the application of RSS for e¢ cient regression analysis.
In this study, the study of Samawi and Ababneh [11] is bene…ted and multiple linear regression model is considered in case that units are selected by RSS with ranking according to one of independent variables. Estimators of model parameters (regression coe¢ cients) and their variances are examined under the assumption that error terms have constant variance based on the Lemma given by Bhattacharya [2]. Then, for the comparision of the e¢ ciency of the estimated model parameters obtained by using RSS with those obtained by using SRS, we use RE measure. Also, a Monte Carlo simulation study is realized to obtain RE values for di¤erent sample size and correlation coe¢ cients under the assumption that the dependent variable and independent variables have multivariate normal distribution.
2. Estimation of Model Parameters Using RSS in a Multiple Regression Model
In regression analysis, since the variation of dependent variable is tried to be explained with the help of independent variables, in the application phase, such situations can be faced as that the measurement of dependent variable can be quite costly or so di¢ cult in aspects of time and labor. In those cases, RSS can be used for obtaining the sample units; however, the method used in ranking process of the units according to dependent variable is important. Chen [3] suggested the adaptive RSS method in derivation of the regression estimator of population mean by ranking with multiple concomitant variables. However, the method needs a ranking criterion function for using all independent variables in ranking. Ranking of the units can be done according to dependent variable, for instance visual ranking, however model assumptions can be violated and also the obligation of expressing the regression model in terms of order statistics can arise. On the other hand, the most appropriate ranking related to dependent variable can be done by using one of the independent variables. For example; the ages of animals need to be determined in animal growth studies but aging an animal is usually time consuming and costly. However, variables on the physical size of an animal, which are closely related to age, can be measured easily and cheaply [5]. So, independent variable which will be used in ranking will also take as a concomitant variable. If sensitive measurement of the units associated with the independent variable is cheap and easy, the units are ranked according to independent variable X with sensitive measurement techniques and if not, with low-level measurement techniques are used which do not bring about ranking error. Here, the primary aim is to reach the most e¤ective information about the dependent variable of which the measurement is the most di¢ cult and expensive, by the help of the independent variable of which measurement is the easiest and cheapest one among independent variables in the regression model and to estimate the more e¢ cient estimators of model parameters.
The regression model between dependent variable Y and independent variables (X1; X2; :::; Xp) can be written as;
E(Y=X) = XB (2.1)
where B and X are p-dimensional parameters and random independent variables vectors, respectively.
If sample selection is done with RSS method for the model 2.1, let Xk be the
in-dependent variable which will be used as a concomitant variable for ranking. At the …rst stage of the sample selection, random sample of size m2are selected from the
population as (Y; X1; X2; :::; Xk; :::; Xp) and each unit is partitioned randomly into
m sets. Then, sample units in each set are ranked according to Xk variable. Thus,
dependent variable Y which is still not measured sensitively and remaining inde-pendent variables (X1; X2; :::; Xk 1; Xk+1; :::; Xp) will have been ranked according
to Xk. At the second stage, the unit which has the smallest Xk value from the
…rst set, the unit which has the second smallest Xk value from the second set and
going on like this the unit which has the mthlargest X
k value from the mthset are
selected and measured sensitively according both to independent variables included in the model and dependent variable Y . This cycle can be replicated r times un-til the desired sample size is obtained. Thus, multiple linear regression model for ranked set sample of size n = mr is de…ned as
YR= XR + R where, YR= 2 6 6 6 6 6 6 6 6 6 6 6 6 6 6 6 4 Y[1]1 Y[2]1 .. . Y[m]1 .. . Y[1]r Y[2]r .. . Y[m]r 3 7 7 7 7 7 7 7 7 7 7 7 7 7 7 7 5 ; XR= 2 6 6 6 6 6 6 6 6 6 6 6 6 6 6 6 4 1 X1[1]1 Xk(1)1 Xp[1]1 1 X1[2]1 Xk(2)1 Xp[2]1 .. . ... . .. ... . .. ... 1 X1[m]1 Xk(m)1 Xp[m]1 .. . ... . .. ... . .. ... 1 X1[1]r Xk(1)r Xp[1]r 1 X1[2]r Xk(2)r Xp[2]r .. . ... . .. ... . .. ... 1 X1[m]r Xk(m)r Xp[m]r 3 7 7 7 7 7 7 7 7 7 7 7 7 7 7 7 5 ;
= 2 6 6 6 4 0 1 .. . p 3 7 7 7 5; R= 2 6 6 6 6 6 6 6 6 6 6 6 6 6 6 6 4 [1]1 [2]1 .. . [m]1 .. . [1]r [2]r .. . [m]r 3 7 7 7 7 7 7 7 7 7 7 7 7 7 7 7 5
In this model; XR is a nx(p + 1)-dimensional independent variables matrix the
elements of which are (1; X1[i]j; :::; Xk(i)j; :::; Xp[i]j)(i = 1; 2; :::; m; j = 1; 2; :::; r).
Xk(i)j denotes ith order statistic of Xk in the ith set and jth cycle and Xp[i]j is
the Xk- induced ithorder statistic of Xp in the ith set and jth cycle. YR is a
nx1-dimensional dependent variable vector the elements of which are Y[i]j. Y[i]j is the
value of the dependent variable for ithindependent variables
(1; X1[i]j; :::; Xk(i)j; :::; Xp[i]j) in the ithset and jthcycle. is a (p+1)x1-dimensional
parameter vector. R is a nx1-dimensional random error vector with E( R) = 0,
V ar( R) = 2I and Cov( R; XR) = 0. Constant variance assumption related to
error vector can be written from the Lemma about induced order statistics given by Bhatacharya [2]. From this Lemma, denote by fY =X(y=x) the conditional
dis-tribution of Y given X. If (Xi; Yi) independent and identical distributed random
variables then the conditional probability density function of Y given X(i) = x is
written as
fY[i]=X(i)(y=X(i)= x) = fY =X(y=x)
where, X(i)is the ithorder statistic and Y[i] is the X-induced ithorder statistic of
Y . This lemma can be also extended to multivariate case [4]. In this study, this structure is used in the estimation of model parameters.
Under these model assumptions, parameter vector is estimated with RSS by using LSE method as below
bRSS = (X0RXR) 1X0RYR
The variance of this estimator is
V ar(bRSS) = 2(X0RXR) 1 (2.2)
The unbiased estimator of 2 is written as
b2RSS =
Y0
RYR bRSSX0RYR
3. Relative Efficiencies of Estimators
In regression analysis, generally, sample selection is done with SRS. In this study, it is assumed that the units are randomly selected with SRS without any pretermination of independent variables and the measurement of the values of de-pendent variable and indede-pendent variables taken from each observation unit. By taking a simple random sample of size n from a multivariate normal distribution of (Y; X1; X2; :::; Xp), the model 2.1 can be denoted in matrix notation as
YS = XS + S (3.1) where, YS= 2 6 6 6 4 Y1 Y2 .. . Yn 3 7 7 7 5; XS = 2 6 6 6 4 1 X11 X1p 1 X21 X2p .. . ... . .. ... 1 Xn1 Xnp 3 7 7 7 5; = 2 6 6 6 4 0 1 .. . p 3 7 7 7 5; S= 2 6 6 6 4 1 2 .. . n 3 7 7 7 5
In this model; YS is a nx1-dimensional dependent variable vector obtained with
SRS. XS is a nx(p + 1)-dimensional independent variables matrix obtained with
SRS. is a (p+1)x1-dimensional parameter vector. S denoted as nx1-dimensional
random error vector with E( S) = 0, V ar( S) = 2Iand Cov( S; XS) = 0.
When sample selection is done with SRS, parameter vector is estimated with LSE method from the model 3.1, like that
bSRS = (X0SXS) 1X0SYS
The variance of this estimator is written as
V ar(bSRS) = 2(X0SXS) 1 (3.2)
The unbiased estimator of 2 according to SRS is
b2SRS =
Y0
SYS bSRSX0sYS
mr (p + 1)
As it can be seen from equations 2.2 and 3.2, the variances of estimators depend on the expressions (X0
RXR) 1and (X0SXS) 1. So, to compare RSS and SRS method
based on RE measure, it is necessary to consider matrix of independent variables XRand XS as random matrices. Since all possible values of independent variables
are considered in this way, what e¤ects RSS creates in parameter estimation can be explained better. In this condition, the variances of estimators according to SRS
and RSS are respectively can be written as; V ar(bSRS) = EhV ar(bSRS=XS) i + V arhE(bSRS=XS) i = EhE(bSRS )(bSRS )0=XS) i = Eh(X0SXS) 1X0S 2IXS(X0SXS) 1 i = 2E (X0SXS) 1 V ar(bRSS) = EhV ar(bRSS=XR) i + V arhE(bRSS=XR) i = EhE(bRSS )(bRSS )0=XR) i = Eh(X0RXR) 1X0R 2IXR(X0RXR) 1 i = 2E (X0RXR) 1 and RE is de…ned as RE(b(l 1)) = V ar(bSRS)ll V ar(bRSS)ll = 2E (X0 SXS) 1 ll 2E [(X0 RXR) 1]ll l = 1; 2; :::; p + 1 To examine RE values, matrices of Eh(X0
SXS) 1 i and Eh(X0 RXR) 1 i should be obtained theoretically. However, derivation of these expected values seems to be possible with asymptotic theory. Also, it is not appropriate to put forward any opinion by using asymptotic theory due to small sample sizes. Thus, RE values for regression coe¢ cients in multiple linear regression model with two independent variables are observed by the help of the simulation study.
4. Monte Carlo Simulation Study to Estimate the Relative Efficiency Values
The simulation study is done with Matlab package program with the algorithm given below:
Sample selection for RSS;
1. Data of (Y; X1; X2) are generated from a multivariate normal distribution
according to di¤erent R2coe¢ cient of determination values and di¤erent
x1y, x2y
and x1x2 correlation coe¢ cients which satisfy these R2 values. They are given in
Table 1.
2. Sample units with size m2are randomly selected from the generated data.
3. Sample is partitioned randomly into m sets including m sample units. 4. Sample units in each set are ranked according to variable X1 which
rep-resents a concomitant variable in practice. In the process of ranking …rst the unit with the smallest X1 value from the …rst set is taken. Then, the unit with the
second smallest X1 value from the second set is taken and this process continues
until the unit with the largest X1 value is taken from the mthset.
5. When the cycle number is r > 1, relatively 2nd, 3rd and 4th steps of the
program are replicated r times.
6. At the end of r cycles, ranked set sample of size n = mr is obtained. Sample selection for SRS;
7. Sample of size n = mr is selected randomly from the population which is generated in Step 1th. This sample constitute of simple random sample of size
n = mr.
Estimation of model parameters;
8. bRSS vector is obtained by using ranked set sample of size n which is derived in Step 6th.
9. bSRS vector is obtained by using simple random sample of size n which is derived in Step 7th.
10. All steps from 1st one to 10th one are repeated 300000 times and after
300000 replications, means and variances of estimations obtained in 8th and 9th
steps are calculated.
11. The variance values of b0(SRS); b1(SRS); b2(SRS)calculated with SRS are divided by the variance values of b0(RSS); b1(RSS); b2(RSS)calculated with RSS and RE values of estimators are obtained.
12. At the 4thstep, ranking is done according to X2 and remaining steps are
repeated.
In this simulation study, for all possible (m; r) pairs satisfying the sample size n = 5; 6; 10; 16 are taken. Correlation values which will be used in the simulation study are de…ned according to coe¢ cient of determination R2. Di¤erent
x1y, x2y
and x1x2 combinations which have the same value of R
2 are used to explore the
source of the main e¤ect on RE. R2is de…ned as
R2= 2 x1y+ 2 x2y 2 x1y x2y x1x2 1 2 x1x2
x1y, x2yand x1x2 values satisfying 3 di¤erent R
2 values are taken in 15 di¤erent
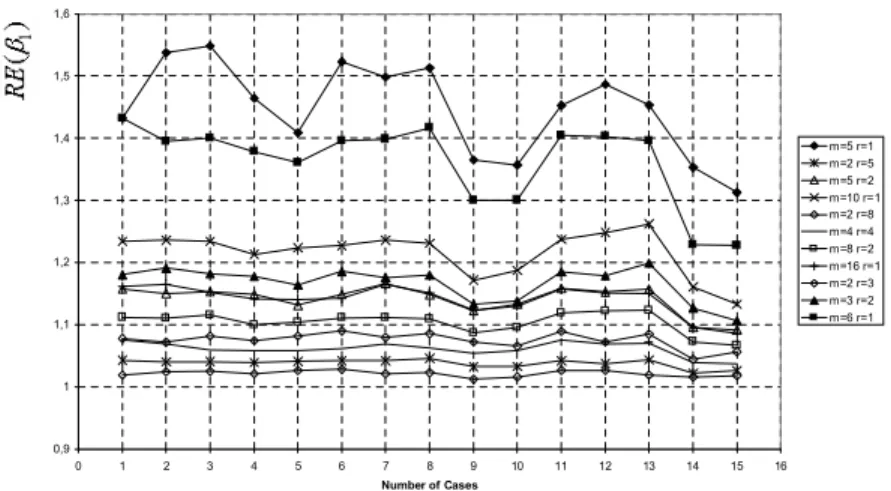
correlation cases. These cases are given in Table 1. The results related to RE values obtained from the simulation study are given at Figure 1-6.
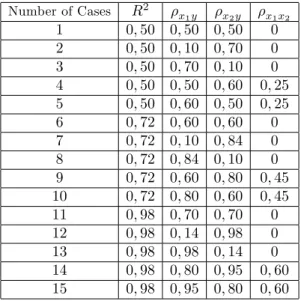
Table 1 Correlation coe¢ cient values which is used in Monte Carlo simulation study for multiple regression model with two independent variables.
Number of Cases R2 x1y x2y x1x2 1 0; 50 0; 50 0; 50 0 2 0; 50 0; 10 0; 70 0 3 0; 50 0; 70 0; 10 0 4 0; 50 0; 50 0; 60 0; 25 5 0; 50 0; 60 0; 50 0; 25 6 0; 72 0; 60 0; 60 0 7 0; 72 0; 10 0; 84 0 8 0; 72 0; 84 0; 10 0 9 0; 72 0; 60 0; 80 0; 45 10 0; 72 0; 80 0; 60 0; 45 11 0; 98 0; 70 0; 70 0 12 0; 98 0; 14 0; 98 0 13 0; 98 0; 98 0; 14 0 14 0; 98 0; 80 0; 95 0; 60 15 0; 98 0; 95 0; 80 0; 60
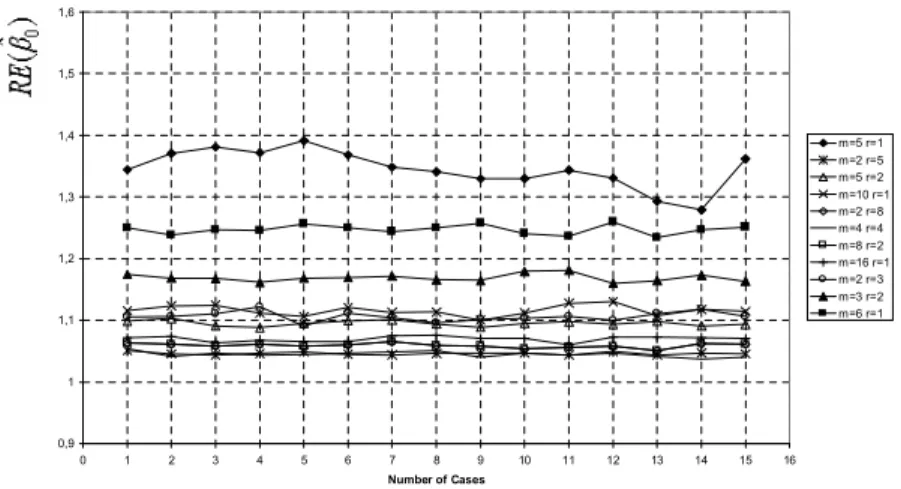
As seen from Figure 1-6, RE(b0), RE(b1) and RE(b2) gets close to 1 as n increases and the highest values of REs are obtained when m = 5 and r = 1 with the desired sample size of n = 5: For the …xed sample size n,
as set size m increases and cycle size r decreases, the RE values of estimated regression coe¢ cient related to independent variable used in ranking and RE(b0) increase (see Figure 1,2,4,6) but the RE values of estimated regression coe¢ cient related to independent variable which was not used in ranking approximates to 1(see Figure 3,5). For the …xed (m; r) values, REs are not a¤ected from the coe¢ cient of determination R2 and correlation coe¢ cients x1y and x2y. However, when
x1x2 > 0; 25 and the sample size is small, RE(b1) and RE(b2) values decrease
when the ranking is done according to X1 and X2 respectively (see Figure 2, 6).
RE(b0) is not a¤ected from whether the ranking is done according either to X1
or X2 and takes similar values for the …xed (m; r) and for di¤erent correlation
coe¢ cient cases taken into consideration (see Figure 1,4). For the …xed (m; r) and all correlation coe¢ cient cases, RE(b1) values obtained from the ranking done according to X1 and RE(b2) values obtained from the ranking done according to
X2 give closer results (see Figure 2 ,6).
As it can be seen in Table 1, in this simulation study just the positive values of correlation coe¢ cients are examined. The reason is that simulation studies done for negative values give the same results with positive ones. For more detail, see Özdemir [10].
5. Conclusion
In this study, regression coe¢ cients of multiple linear regression model are es-timated by using RSS and RE values of these estimations according to SRS are investigated. By the help of simulation study, multiple linear regression model with two independent variables is taken into consideration and ranking is done ac-cording to each independent variable in RSS. Also, di¤erent correlation cases for speci…ed R2are considered. So, the e¤ects of ranking and correlation cases on the
parameter estimation are examined based on RE measure. Based on the simula-tion results, RSS method in the estimasimula-tion of model parameters 0 and 1 when the ranking is done according to X1 and in the estimation of model parameters 0 and 2 when the ranking is done according to X2 is more e¤ective than SRS
method under the small sample size. However, when the sample size increases, RE values approximate to 1. So, it is expected that the di¤erence between RSS and SRS disappears by means of RE. When x1x2 < 0:25 and sample size n is
small, RE will take the highest values. In regression analysis, for the high values of x1x2 the collinearity problem may arise. So, in general, it is desired that just one of the independent variables which have high relationship between each other is included in the model. In this case, ranking can be done by the help of the remaining independent variable. In a regression model at which x1x2 does not have a high value, if the sensitive measurement of both of the independent variables is cheap and easy, the independent variable which has a higher correlation with the dependent variable may be preferred in the ranking process. In this way, RE values of estimated regression coe¢ cient related to independent variable used in ranking process will increase, and so, the signi…cance of the related regression coe¢ cient will be supported since the variance of the estimated regression coe¢ cient related to independent variable which has the highest contribution in explaining the model decreases.
In case when studying with a small sample size is desired due to the budget limitations, estimations of model parameters in regression analysis with RSS are more e¢ cient than the estimations obtained with SRS. However, after the selection of the maximum set size m and the minimum repetition number r according to the method which will be used in the ranking process of the units with RSS to satisfy n sample size needed for the application, the e¢ ciencies relating to parameter estimations will take their highest values.
ÖZET: ·Istatistiksel ara¸st¬rmalarda, örnek birimlerinin ilgilenilen de¼gi¸sken bak¬m¬ndan ölçülmesinin, emek, zaman ve maliyet an-lam¬nda pahal¬ oldu¼gu durumlarda, örnek birimleri e¼ger pahal¬ ölçüm gerektirmeyen baz¬ tekniklerle ayn¬ de¼gi¸sken bak¬m¬ndan s¬ralanabiliyorsa, S¬ral¬ Küme Örneklemesi (SKÖ), y¬¼g¬n ortala-mas¬n¬ tahmin etmede Basit Tesadü… Örneklemeye (BTÖ) göre oldukça etkin bir örnekleme yöntemidir. Bu çal¬¸smada, çoklu linear
regresyon analizinde SKÖ kullan¬m¬n¬n model parametrelerinin tah-mini üzerindeki etkileri ele al¬nmaktad¬r. Çoklu do¼grusal regresyon model parametreleri, hem SKÖ hem de BTÖ’ye göre tahmin edil-erek, tahmin edicilerin varyanslar¬bak¬m¬ndan ortaya ç¬kan etkiler, Göreli Etkinlik (RE) ölçüsüne dayal¬olarak Monte Carlo simülasyon çal¬¸smas¬ile incelenmi¸stir. SKÖ’ne göre elde edilen tahmin edici-lerin örnek çap¬küçük iken BTÖ’ye göre elde edilen tahmin edicil-erden daha etkin oldu¼gu gösterilmi¸stir.
References
[1] Barnett, V., Barreto, M.C.M., Best linear unbiased estimators for the simple linear regression model using ranked set sampling, Environmental and Ecological Statistics. 6 (1999), 119-133. [2] Bhattacharya, P.K., Convergence of sample paths of normalized sums of induced order
sta-tistics, The Annnals of Statistics. 2 (1974), 1034-1039.
[3] Chen, Z., Adaptive ranked-set sampling with multiple concomitant variables, Bernoulli. 8 (2002), 313-322.
[4] Chen, Z., Bai, Z., Sinha, B.K., Ranked Set Sampling Theory and Applications, 2004, New York: Springer-Verlag.
[5] Chen, Z., Wang, Y., E¢ cient regression analysis with ranked-set sampling, Biometrics. 60 (2004), 994-997.
[6] Dell, D.R., Clutter, J.L., Ranked set sampling theory with order statistics background, Bio-metrics. 28 (1972), 545-555.
[7] McIntyre, G.A., A method of unbiased selective sampling using ranked sets, Australian Jour-nal of Agricultural Research. 3 (1952), 385-390.
[8] Muttlak, H.A., Parameters estimation in a simple linear regression using ranked set sampling, Biometrical Journal. 37 (1995), 799-810.
[9] Muttlak, H.A., Estimation of parameters in a multiple regression model using ranked set sampling, Information and Optimization Sciences. 17 (1996), 521-533.
[10] Özdemir, Y.A, Investigation of Parameter Estimation in Linear Regression Models Using Ranked Set Sampling, Gazi Üniversitesi Fen Bilimleri Enstitüsü, unpublished PhD thesis, (2005).
[11] Samawi, H.M., Ababneh, F.M., On regression analysis using ranked set sample, Journal of Statistical Research. 35 (2001), 93-105.
[12] Stokes, L.S., Ranked set sampling with concomitant variables, Commun. Statist. Theor. Meth. A6 (1977), 1207-1211.
Current address : Department of Statistics, Faculty of Science and Arts,University of Gazi, Be¸sevler, 06500, Ankara, Turkey
0,9 1 1,1 1,2 1,3 1,4 1,5 1,6 0 1 2 3 4 5 6 7 8 9 10 11 12 13 14 15 16 Number of Cases m=5 r=1 m=2 r=5 m=5 r=2 m=10 r=1 m=2 r=8 m=4 r=4 m=8 r=2 m=16 r=1 m=2 r=3 m=3 r=2 m=6 r=1
Figure 1. Plots of RE(b0) values for all considered correlation cases and all possible (m; r) values which satisfy n = 5; 6; 10; 16 when the ranking is done according to X1
0,9 1 1,1 1,2 1,3 1,4 1,5 1,6 0 1 2 3 4 5 6 7 8 9 10 11 12 13 14 15 16 Number of Cases m=5 r=1 m=2 r=5 m=5 r=2 m=10 r=1 m=2 r=8 m=4 r=4 m=8 r=2 m=16 r=1 m=2 r=3 m=3 r=2 m=6 r=1
Figure 2. Plots of RE(b1) values for all considered correlation cases and all possible (m; r) values which satisfy n = 5; 6; 10; 16 when the ranking is done according to X1
0,9 1 1,1 1,2 1,3 1,4 1,5 1,6 0 1 2 3 4 5 6 7 8 9 10 11 12 13 14 15 16 Number of Cases m=5 r=1 m=2 r=5 m=5 r=2 m=10 r=1 m=2 r=8 m=4 r=4 m=8 r=2 m=16 r=1 m=2 r=3 m=3 r=2 m=6 r=1
Figure 3. Plots of RE(b2) values for all considered correlation cases and all possible (m; r) values which satisfy n = 5; 6; 10; 16 when the ranking is done according to X1
0,9 1 1,1 1,2 1,3 1,4 1,5 1,6 0 1 2 3 4 5 6 7 8 9 10 11 12 13 14 15 16 Number of Cases m=5 r=1 m=2 r=5 m=5 r=2 m=10 r=1 m=2 r=8 m=4 r=4 m=8 r=2 m=16 r=1 m=2 r=3 m=3 r=2 m=6 r=1
Figure 4. Plots of RE(b0) values for all considered correlation cases and all possible (m; r) values which satisfy n = 5; 6; 10; 16 when the ranking is done according to X2
0,9 1 1,1 1,2 1,3 1,4 1,5 1,6 0 1 2 3 4 5 6 7 8 9 10 11 12 13 14 15 16 Number of Cases m=5 r=1 m=2 r=5 m=5 r=2 m=10 r=1 m=2 r=8 m=4 r=4 m=8 r=2 m=16 r=1 m=2 r=3 m=3 r=2 m=6 r=1
Figure 5. Plots of RE(b1) values for all considered correlation cases and all possible (m; r) values which satisfy n = 5; 6; 10; 16 when the ranking is done according to X2
0,9 1 1,1 1,2 1,3 1,4 1,5 1,6 0 1 2 3 4 5 6 7 8 9 10 11 12 13 14 15 16 Number of Cases m=5 r=1 m=2 r=5 m=5 r=2 m=10 r=1 m=2 r=8 m=4 r=4 m=8 r=2 m=16 r=1 m=2 r=3 m=3 r=2 m=6 r=1
Figure 6. Plots of RE(b2) values for all considered correlation cases and all possible (m; r) values which satisfy n = 5; 6; 10; 16 when the ranking is done according to X2