JHEP10(2013)042
Published for SISSA by SpringerReceived: June 29, 2013 Accepted: September 2, 2013 Published: October 8, 2013
Measurement of the differential cross-section of B
+
meson production in pp collisions at
√
s = 7 TeV at
ATLAS
The ATLAS collaboration
E-mail:
[email protected]
Abstract: The production cross-section of B
+mesons is measured as a function of
transverse momentum p
Tand rapidity y in proton-proton collisions at centre-of-mass
energy
√
s = 7 TeV, using 2.4 fb
−1of data recorded with the ATLAS detector at the
Large Hadron Collider. The differential production cross-sections, determined in the range
9 GeV < p
T< 120 GeV and |y| < 2.25, are compared to next-to-leading-order
theoreti-cal predictions.
JHEP10(2013)042
Contents
1
Introduction
1
2
The ATLAS detector
2
3
Data and Monte Carlo samples
3
4
Event selection and reconstruction
4
5
Cross-section determination
4
6
Systematic uncertainties
8
7
Cross-section results
11
8
Conclusions
15
The ATLAS collaboration
22
1
Introduction
The b-hadron production cross-section has been predicted with next-to-leading-order
(NLO) accuracy for more than twenty years [
1
,
2
] and more recently it has been predicted
with fixed order plus next-to-leading-logarithms (FONLL) calculations [
3
,
4
]. Several
mea-surements were performed with proton-antiproton collisions by the UA1 collaboration at
the Sp¯
pS collider (CERN) at a centre-of-mass energy of
√
s = 630 GeV [
5
,
6
] and by the
CDF and D0 collaborations at the Tevatron collider (Fermilab) at
√
s = 630 GeV, 1.8 TeV
and 1.96 TeV [
7
–
16
]. These measurements made a significant contribution to the
under-standing of heavy-quark production in hadronic collisions [
17
]. However, the dependence of
the theoretical predictions for b-quark production on the factorisation and renormalisation
scales and the b-quark mass m
b[
2
] results in theoretical uncertainties of up to 40% and,
therefore, it is important to perform precise measurements of b-hadron production
cross-sections. In addition, measurements of b-hadron production cross-sections are of theoretical
interest at higher
√
s [
18
] and for B mesons of higher transverse momentum (p
T) [
19
].
Measurements of the b-hadron production cross-section in proton-proton collisions at
the Large Hadron Collider (LHC) provide further tests of QCD calculations for
heavy-quark production at higher centre-of-mass energies and in wider transverse momentum
(p
T) and rapidity (y) ranges, thanks to the extended coverage and excellent performance of
the LHC detectors. Recently the LHCb collaboration measured b-hadron production
JHEP10(2013)042
rapidity region at
√
s = 7 TeV [
20
–
22
]. The CMS collaboration measured the production
cross-sections for B
+, B
0, B
smesons, Λ
bbaryons, and inclusive b-hadron production using
b → J/ψ X decays, semileptonic decays, and b-hadron jets at
√
s = 7 TeV [
23
–
30
]. ATLAS
has measured b-hadron production cross-sections using semileptonic decays [
31
,
32
], b →
J/ψ X decays [
33
] and b-hadron jets [
34
].
This paper presents a measurement of the B
+production cross-section using the decay
channel B
+→ J/ψK
+→ µ
+µ
−K
+in pp collisions at
√
s = 7 TeV, as a function of B
+transverse momentum and rapidity. The ATLAS and CMS detectors provide coverage in
the central rapidity region, so their measurements are complementary to the LHCb
mea-surements. With 2.4 fb
−1of data collected by the ATLAS detector, this analysis extends
the measurement of the B
+cross-section up to p
T
of about 100 GeV, allowing
compar-isons with NLO predictions in four rapidity regions in the range |y| < 2.25 to be made.
The results are reported for B
+meson production, but are derived from both charged
states, under the assumption that in the phase space accessible by this measurement the
B
+and B
−production cross-sections are equal. This assumption is in agreement with
the predictions of NLO Monte Carlo generators and is also valid within the precision of
the measurement.
2
The ATLAS detector
The ATLAS experiment [
35
] uses a general-purpose detector
1consisting of an inner tracker,
a calorimeter and a muon spectrometer. A brief outline of the components that are most
relevant for this analysis is given below. The inner detector (ID) directly surrounds the
interaction point; it includes a silicon pixel detector (Pixel), a silicon microstrip detector
(SCT) and a transition radiation tracker (TRT), and is embedded in an axial 2 T magnetic
field. The ID covers the range |η| < 2.5 and is enclosed by a calorimeter system containing
electromagnetic and hadronic sections. The calorimeter is surrounded by a large muon
spectrometer (MS) inside an air-core toroidal magnet system that contains a combination
of monitored drift tubes (MDTs) and cathode strip chambers (CSCs), designed to provide
precise position measurements in the bending plane in the range |η| < 2.7. In addition,
resistive plate chambers (RPCs) and thin gap chambers (TGCs) with a coarse position
resolution but a fast response time are used primarily to trigger muons in the ranges
|η| < 1.05 and 1.05 < |η| < 2.4, respectively. RPCs and TGCs are also used to provide
position measurements in the non-bending plane and to improve pattern recognition and
track reconstruction. Momentum measurements in the MS are based on track segments
formed in at least two of the three stations of the MDTs and the CSCs.
The ATLAS trigger system [
36
] has three levels: the hardware-based Level-1 trigger
and the two-stage High Level Trigger (HLT), comprising the Level-2 trigger and Event
Fil-ter (EF). At Level-1, the muon trigger searches for patFil-terns of hits satisfying different p
T1ATLAS uses a right-handed coordinate system (x, y, z) with its origin at the nominal interaction point.
The z-axis is along the beam pipe, the x-axis points to the centre of the LHC ring and the y-axis points upward. Cylindrical coordinates (r, φ) are used in the transverse plane, φ being the azimuthal angle around the beam pipe. The pseudorapidity η is defined as η = − ln[tan(θ/2)], where θ is the polar angle.
JHEP10(2013)042
thresholds using the RPCs and TGCs. The region-of-interest (RoI) around these Level-1
hit patterns then serves as a seed for the HLT muon reconstruction, in which dedicated
al-gorithms are used to incorporate information from both the MS and the ID, achieving a
po-sition and momentum resolution close to that provided by the offline muon reconstruction.
3
Data and Monte Carlo samples
The analysis is based on data collected at the LHC during the proton-proton running period
in the early 2011 (April-August) with a dimuon trigger that required the presence of at
least two muon candidates with p
T> 4 GeV. Later run periods are not considered because
this trigger was prescaled. Selected events are required to have occurred during stable LHC
beam conditions and the ID, as well as the MS, must have been fully operational. The
collected data correspond to an integrated luminosity of 2.4 fb
−1with an uncertainty of
1.8% [
37
].
In the analysis two Monte Carlo (MC) samples are used. The first sample simulates
the signal B
±→ J/ψ K
±→ µ
+µ
−K
±, while the second simulates b¯
b production, with
b¯
b → J/ψ X → µ
+µ
−X, including the signal and also the backgrounds which are relevant
for the analysis. Both samples were generated with Pythia 6 [
38
] using the 2011 ATLAS
tune [
39
]. The response of the ATLAS detector was simulated [
40
] using Geant4 [
41
].
Additional pp interactions in the same and nearby bunch crossings (pile-up) were included
in the simulation.
The MC samples are used in several parts of the analysis. The first is the extraction
of the fit models for signal and background. The second is the construction of efficiency
maps for the muon trigger and reconstruction. The third is the estimation of the signal
reconstruction efficiency and the kinematic acceptance of the selection criteria applied to
the final-state particles in each p
Tand rapidity interval used in the analysis. In the MC
samples generated with Pythia, the decay J/ψ → µ
+µ
−is isotropic. In order to take into
account that the J/ψ meson is produced with zero helicity in the B
±rest frame, in the
analysis a weight proportional to sin
2θ
∗is applied to each event, where θ
∗is the µ
+angle
relative to the B
±direction in the J/ψ rest frame.
To compare the cross-section measurements with theoretical predictions, NLO QCD
calculations matched with a leading-logarithmic parton shower MC simulation are used.
Predictions for b¯
b production are evaluated with two packages: Powheg-hvq
(Powheg-Box 1.0) [
42
,
43
] and MC@NLO 4.01 [
44
,
45
]. For the hadronisation process, Powheg is
matched with Pythia, which uses the Lund string model [
46
] with the Bowler
modifica-tion [
47
] of the Lund symmetric fragmentation function [
48
]. MC@NLO is matched with
Herwig [
49
], which uses a cluster model for hadronisation [
50
]. The b-quark production
cross-section is also calculated in the FONLL theoretical framework [
19
], permitting
di-rect comparison with the data assuming the world average of the hadronisation fraction
f
¯b→B+= 0.401 ± 0.008 [
51
]. The theoretical uncertainties associated with the Powheg,
MC@NLO and FONLL predictions are discussed in section
7
where the comparisons to
JHEP10(2013)042
4
Event selection and reconstruction
Events for the analysis were selected with a trigger that requires two muon RoIs at
Level-1. A full track reconstruction of dimuon candidates was performed by the HLT where
both muons are required to have p
T> 4 GeV and fullfill additional requirements, loosely
selecting events compatible with J/ψ meson decays into a muon pair.
Events selected by the trigger are required to have at least one reconstructed primary
vertex with a minimum of three associated tracks. Tracks reconstructed in the ID which
are matched to tracks reconstructed in the MS are selected as muon candidates. Muon
candidates are required to have sufficient numbers of hits in the Pixel, SCT and TRT
detectors to ensure accurate ID measurements. The same selection criteria are applied to
tracks selected as potential K
±candidates.
Events are required to contain at least one pair of reconstructed oppositely signed
muons that fit successfully to a common vertex, using a vertexing algorithm [
52
]. The
momenta of the muons and the dimuon invariant mass are calculated from the refitted
track parameters returned by the vertexing algorithm. Muon pairs with a common vertex
are considered as J/ψ → µ
+µ
−candidates if their invariant mass lies in the mass range 2.7–
3.5 GeV. Because of the trigger requirements on muons, the reconstructed J/ψ candidate
must have rapidity |y| < 2.25 and the reconstructed muons p
T> 4 GeV and |η| < 2.3.
To ensure that the muon pair from the J/ψ candidate is the one that triggered the event,
an (η, φ) match between the trigger muons and those of the J/ψ candidate is required.
If multiple J/ψ candidates are found in the event, all are considered in the formation of
B
±candidates.
The muon tracks of the selected J/ψ candidates are again fitted to a common vertex
with an additional third track with p
Tgreater than 1 GeV. The three-track vertex fit is
performed by constraining the muon tracks to the J/ψ mass [
51
]. The K
±mass is assigned
to the third track and the µ
+µ
−K
±invariant mass is calculated from the refitted track
parameters returned by the vertexing algorithm. Regarding the quality of the three-track
vertex fit, the χ
2per degree of freedom must be χ
2/N
d.o.f.< 6, which is found to select
about 99% of signal events while rejecting background events. We retain B
+and B
−candidates with p
T> 9 GeV and |y| < 2.25 in the mass range 5.040–5.800 GeV. After
this selection, the average candidate multiplicity is 1.3. The multiple B
±candidates result
mainly from random combinations of tracks with selected J/ψ mesons produced promptly
in pp collisions. Such combinations result in non-resonant background and do not affect
the estimation of the signal yield.
5
Cross-section determination
The differential cross-section for B
+meson production in pp collisions times branching
ratio to the final state is given by
d
2σ(pp → B
+X)
dp
Tdy
· B =
N
B+
JHEP10(2013)042
where B is the total branching ratio of the signal decay, which is (6.03 ± 0.21) × 10
−5,
obtained by combining the world-average values of the branching ratios for B
+→ J/ψ K
+and J/ψ → µ
+µ
−[
51
], N
B+is the number of B
+→ J/ψ K
+signal decays produced, L
is the integrated luminosity of the data sample and ∆p
T, ∆y are the widths of p
Tand
y intervals. Assuming that B
+and B
−mesons are produced in equal numbers, N
B+is
derived from the average yield of the two reconstructed charged states in a (p
T, y) interval,
after correcting for detector effects and acceptance,
N
B+=
1
A
N
recoB+ε
B+=
1
A
N
recoB−ε
B−=
1
A
N
recoB±ε
B++ ε
B−,
(5.2)
where N
recoB±is the number of reconstructed signal events, obtained from data with a fit
to the invariant mass distribution of B
±candidates, A is the acceptance of the kinematic
selection of the final-state particles of the signal decay, obtained from MC simulation, and
ε
B+, ε
B−are the reconstruction efficiencies for the B
±signal decays. Separate efficiency
is needed for B
+and B
−signal decays, because the different interaction cross-sections of
K
+and K
−with the detector material result in different reconstruction efficiencies for
the two charged mesons. The reconstruction efficiencies for B
+and B
−are obtained from
MC simulation. In the following, ε
B−is implicitly referred to, together with ε
B+. The
efficiency for B
+events is defined as the product of trigger, muon reconstruction (ID and
MS), kaon reconstruction and vertexing efficiencies,
ε
B+= ε
J/ψtrigger· ε
µ+· ε
µ−· ε
K+ ID· ε
µµK vertex= ε
J/ψ trigger· ε
µ+ MS· ε
µ− MS· (ε
µ ID)
2· ε
K+ ID· ε
µµK vertex.
In the above equation, ε
µMS+and ε
µMS−are the efficiencies for reconstructing µ
+and µ
−in the
MS, which differ for muons of low p
Tand large |η| because of the bending of tracks in the
toroidal magnetic field. This effect is to large extent symmetric for a simultaneous change
of sign in the muon charge and in η. The trigger efficiency, ε
J/ψtrigger, depends on the ability
of the trigger to identify muons of given p
Tand η as decay products of a J/ψ meson. The
trigger efficiency includes independent and correlated terms between the two muons [
53
].
The efficiency ε
B+for a given (p
T, y) interval is obtained from MC-simulated signal events
from the fraction
ε
B+=
N
B+ mc,recoN
B+ mc, gen,
(5.3)
where the denominator is the number of signal events generated in a given interval of the
generated p
Tand y and the numerator is the number of signal events that pass the trigger
and the offline selection requirements in the same (p
T, y) interval of the reconstructed
variables. Bin-to-bin migration effects are included in the efficiency definition of eq. (
5.3
).
The trigger and muon reconstruction efficiencies are measured in the data using auxiliary
single muon and dimuon triggers and tag-and-probe methods [
53
] and the simulation is
corrected with per-event weights to reproduce the efficiencies measured with data. The
JHEP10(2013)042
event, so that N
mc, recoB+in eq. (
5.3
) is now defined as
N
mc, recoB+=
Nevents mcX
i=1(w
µMS+)
i· (w
µ − MS)
i· (w
J/ψ trigger)
i,
(5.4)
where N
mceventsis the number of reconstructed MC-simulated signal events before applying
the weights derived from data. The efficiency for reconstructing muons in the ID, ε
µID,
and the vertexing efficiency, ε
µµKvertex, are found to be equal to 99% and are well reproduced
by the MC simulation. The reconstruction efficiency for hadrons in the ID was verified
in ref. [
54
] for data and simulation; for the kaons used in this analysis, the efficiency is
obtained from simulation.
The number of reconstructed B
±mesons is obtained using a binned maximum
like-lihood fit to the invariant mass distribution of the selected candidates. The probability
density function (pdf) for the signal is defined as the sum of two Gaussians of relative
frac-tion f
1and corresponding widths σ
1, σ
2, both centred at the reconstructed B
±mass. The
pdf for the background consists of three components to model the following three sources
of background:
• B
±→ J/ψ π
±, where the kaon mass is wrongly assigned to the pion; this decay is
Cabibbo suppressed with a relative fraction of 4.9% [
51
] with respect to the signal
decay; it produces a resonant structure in the signal region that is modelled with a
Crystal Ball function (see appendix E of ref. [
55
]).
• B
±/0→ J/ψ K
∗±/0→ J/ψ (Kπ)
±/0and B
±/0→ J/ψ (Kπ)
±/0, where the final-state
pion is not associated to the decay vertex, creating a resonant structure displaced
from the B
±mass by about m
π, where m
πis the mass of the pion; these partially
reconstructed B-decays are modelled with a complementary error function.
• Combinatorial background from random combinations of J/ψ (produced promptly
in pp collisions or in feed-down from B-decays) with a track; it is modelled with an
exponential function. The background from muon pairs not originating from J/ψ
decays is negligible after the full B
±candidate selection.
The extraction of the signal yield is done in two steps. First, the shapes of the signal
and the resonant background pdfs, which depend on the p
Tand y of the B
±meson
can-didate, are obtained by fitting the invariant mass distribution of signal and background
events from MC samples in each (p
T, y) interval. Then the invariant mass distribution of
the data is fitted in the same (p
T, y) interval. The parameters for the shape of the signal
pdf (σ
1, σ
2and f
1) and the resonant backgrounds are fixed to the results of the fits to
MC event samples. The relative normalisation of the B
±→ J/ψ π
±decay to the signal is
fixed to the fraction of the world-average values for their branching ratios, and is corrected
for the difference in acceptance for the two decay modes. The reconstructed mass m
B±is obtained from data for the full p
Trange in a rapidity interval by fitting the invariant
mass distribution of the selected candidates, and is fixed throughout the fits in p
TJHEP10(2013)042
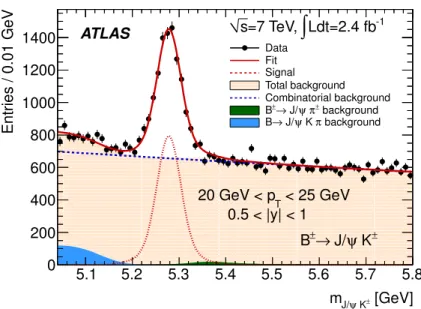
[GeV] ± K ψ J/ m 5.1 5.2 5.3 5.4 5.5 5.6 5.7 5.8 Entries / 0.01 GeV 0 200 400 600 800 1000 1200 1400 Data Fit Signal Total background Combinatorial background background ± π ψ J/ → ± B background π K ψ J/ → B ATLAS s=7 TeV,∫
Ldt=2.4 fb-1 0.5 < |y| < 1 < 25 GeV T 20 GeV < p ± K ψ J/ → ± BFigure 1. The observed invariant mass distribution of B± candidates, mJ/ψK±, with transverse
momentum and rapidity in the range 20 GeV < pT< 25 GeV, 0.5 < |y| < 1 (dots), compared to
the binned maximum likelihood fit (solid line). The error bars represent the statistical uncertainty. Also shown are the components of the fit as described in the legend.
normalisation of the signal, the normalisation of the partially reconstructed B-decays, and
the slope of the combinatorial background. The results of the fits to the invariant mass
distributions of the selected B
±candidates from data are exemplified in figure
1
for an
interval of intermediate p
Tand central rapidity. The stability of the fit was tested with
simulated samples of signal and background with statistical size similar to our data and
no evidence of bias in the fit was found.
The total number of signal B
±events observed in data in the full p
Tand y range
covered by the analysis, 9 GeV < p
T< 120 GeV and |y| < 2.25, before acceptance and
efficiency corrections, is about 125600. These events populate four intervals in |y| and eight
intervals in p
Tfor the differential cross-section measurement. The acceptance correction,
A, has a small dependence on y and ranges from 4% to 85% from the low to the high p
Tintervals. The efficiency ε
B+has a dependence on both y and p
T
and ranges from 25% to
40%. The relative difference between the efficiencies for reconstructing B
+and B
−mesons,
(ε
B+− ε
B−)/ε
B+, has a dependence on p
Tand ranges from 5% to 2%.
The assumption of equal B
+and B
−production is tested by fitting the invariant mass
distribution of B
+and B
−candidates separately. The resulting yields, before applying
efficiency corrections, are 63530 ± 840 and 62090 ± 840 respectively, where the quoted
uncertainties are statistical. Taking into account the different efficiencies for reconstructing
B
+and B
−mesons, the ratio of B
+/B
−is found to be consistent with unity, within the
JHEP10(2013)042
6
Systematic uncertainties
Various sources of systematic uncertainty on the measurement of the B
+production
cross-section are considered and discussed below:
1. Trigger. The trigger efficiency is obtained from data in bins of p
Tand q·η of the muon,
where q is the muon charge, using a tag-and-probe method [
53
]. Then, the correction
weights for the trigger efficiency w
triggerJ/ψ(see eq. (
5.4
)) are obtained from the fraction
of the measured efficiency from data over the expectation from simulation in each
(p
T, q · η) bin. As the statistical components of the uncertainty associated with the
weights for the trigger efficiency are dominant, the uncertainties on the cross-section
are derived from a series of pseudo-experiments by allowing the weights to fluctuate
randomly under a Gaussian assumption, according to their assigned uncertainty.
2. Fit. For the fit method, three sources of systematic uncertainty are identified and
considered to be uncorrelated. These are the shape of the signal pdf, the reconstructed
B
±mass and the shape of the background pdf. Below, the procedure to estimate the
systematic uncertainty from each source is described, and the resulting uncertainties
are added quadratically to obtain the total systematic uncertainty from the fit method
in each (p
T, y) interval.
(a) Uncertainty on shape of the signal pdf. This uncertainty is estimated with
vari-ations of the fit model, where the values of the signal pdf parameters σ
1, σ
2, f
1are varied independently within their uncertainties derived from the fit to signal
events from MC simulation. From these variations of the fit model, the largest
absolute value of the signal yield variation is taken as the systematic
uncer-tainty from the signal pdf shape, in order to account for the large correlations of
these parameters. Two alternative pdfs were considered (three Gaussians, two
Crystal Ball + Gaussian) and no significant differences in the signal yield were
observed. Among the various sources of systematic uncertainty considered for
the fit method, the signal pdf is dominant and its contribution ranges from 1%
to 8%.
(b) Uncertainty on the B
±mass value. The reconstructed mass m
B±is obtained
from data by fitting the invariant mass distribution of all candidates with
p
T> 9 GeV in each of the four rapidity intervals. The resulting values are
used to fix this parameter when performing the fits in the various (p
T, y)
inter-vals and their statistical uncertainties (0.4–1.0 MeV) are used to estimate the
systematic uncertainty on the signal yield. The fits in the various (p
T, y)
in-tervals are repeated varying the value of m
B±within its statistical uncertainty.
The observed difference in the signal yield is smaller than 1%.
(c) Uncertainty on the shape of the background pdf. The fit includes three
compo-nents for the description of the background (see below), and each contributes
as a possible source of uncertainty. In order to account for the large
correla-tions between the three components, the systematic uncertainty assigned to the
JHEP10(2013)042
background modelling for each (p
T, y) interval is obtained after varying each
component independently, and taking the largest observed difference in the
sig-nal yield.
i. Combinatorial background: with a polynomial instead of exponential shape
for the combinatorial bacground; the observed relative difference in the
signal yield ranges from 0.1% to 4%, where the larger change is observed
for higher values of y and p
T.
ii. B
±→ J/ψ π
±: for the resonant background from B
±→ J/ψ π
±, the
dom-inant uncertainty comes from the relative branching fraction of this decay
with respect to the signal, which has an uncertainty of 10% [
51
]. Varying
this fraction in the fit within its uncertainty was found to have a small effect
on the signal yield (∼1%).
iii. Partially reconstructed B-decays: the resonant background from partially
reconstructed B-decays is modelled with a complementary error function.
When varying its parameters within their uncertainties from the fits to
background events from MC simulation, the observed difference in the signal
yield is smaller than 1%.
3. Kaon track reconstruction. The efficiency of hadron reconstruction is determined
from MC simulation and validated with data [
54
], with the uncertainty dominated
by the material description. The uncertainty ranges with increasing rapidity from
2% to 4% for the kaons used in this analysis.
4. Acceptance.
The acceptance in each (p
T, y) interval has a relative uncertainty
ranging from 1% to 4%, due to the size of the MC sample, which is assigned as
systematic uncertainty.
5. Muon reconstruction. The muon reconstruction efficiency is obtained from data in
bins of p
Tand q · η of the muon, using a tag-and-probe method [
53
]. Then, the
correction weights w
µMS(see eq. (
5.4
)) are obtained from the fraction of the measured
efficiency from data over the expectation from simulation in each (p
T, q · η) bin.
The uncertainties associated with the weights for the muon reconstruction efficiency
are mainly statistical, so the same procedure as for the trigger efficiency is used to
estimate the systematic uncertainty on the cross-section. In addition, there is also
an uncertainty coming from the efficiency for reconstructing a muon in the ID with
the selection criteria used in this analysis. This efficiency is found to be 99% with a
systematic uncertainty of 0.5% for each muon.
6. B
±vertex-finding efficiency. The vertex quality requirement has an efficiency of
∼99% and is fairly independent of p
Tand y. It was estimated with data by comparing
the signal yields in four rapidity intervals before and after applying this requirement
and is found to be consistent with the expectation from MC simulation. A
system-atic uncertainty of 2% is assigned to the cross-section, as the maximum difference
observed between the estimate from data and the expectation from MC simulation
for this efficiency.
JHEP10(2013)042
7. Branching ratio. The total branching ratio of the selected decay, obtained by
com-bining the branching ratios of the decays B
±→ J/ψK
±and J/ψ → µ
+µ
−, has an
uncertainty of 3.4% [
51
].
8. Luminosity. The luminosity calibration is based on data from van der Meer scans
and has an uncertainty of 1.8% [
37
].
9. Signal efficiency. The efficiency correction factor for B
±signal events is obtained
from MC simulation (eq. (
5.3
)). The systematic uncertainty assigned to this factor
has two components, which are added in quadrature:
(a) Uncertainty from the size of the MC sample. The sample used for the estimation
of the efficiency correction factor corresponds to a luminosity similar to that of
the data sample. Due to the size of this sample, the efficiency estimation has
an uncertainty that is small (∼1%) in most intervals and becomes significant in
the high-p
Tinterval 70–120 GeV (∼10%). It is added quadratically to the rest
of the sources of uncertainty.
(b) Uncertainty from K
+/K
−efficiency asymmetry.
The efficiencies for
recon-structing K
+and K
−mesons are obtained from simulation and their relative
difference is found to be ∼3.5%. This difference is verified with data and the
statistical uncertainty of the estimate from data is used to assign a systematic
uncertainty of 1%, which propagates to the cross-section through the sum of
efficiencies (ε
B++ ε
B−) in eq. (
5.2
).
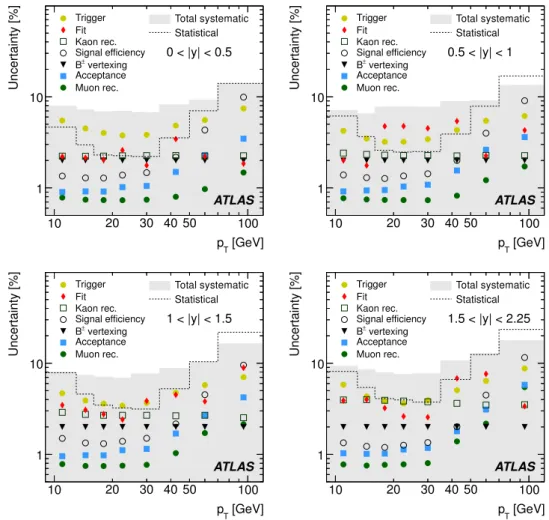
The range of these uncertainties is summarised in table
1
. Their breakdown in (p
T, y)
intervals is given in figure
2
. In the same figure, the total systematic uncertainty, including
the uncertainties from the luminosity and branching ratio, is compared to the statistical
precision of the measurement. In most intervals, the systematic uncertainty dominates.
Additional sources of systematic uncertainty were examined, but were found to be less
significant and were neglected. Residual effects related to final-state radiation have been
de-termined to be smaller than 1% and are neglected. Differences in the underlying kinematic
distributions modelled by the Pythia and NLO generators, including parton distribution
functions, were considered. The impact on the acceptance and the signal efficiency was
estimated by reweighting the kinematic distributions of Pythia to those of Powheg and
MC@NLO. The largest effect is seen in the high-rapidity intervals (1.5 < |y| < 2.25),
where the maximum relative difference observed is 1%, with a statistical uncertainty of the
same order, while in most (p
T, y) intervals the effect is very small (∼0.1%). Bin-to-bin
mi-gration of signal events due to finite detector resolution is studied with MC simulation. It
is found to be a small effect (<0.5%), which is included in the definition of signal efficiency
(eq. (
5.3
)). Potential effects in the calculation of the signal efficiency due to the difference
between the momentum scales in data and MC simulation are expected to be larger in the
JHEP10(2013)042
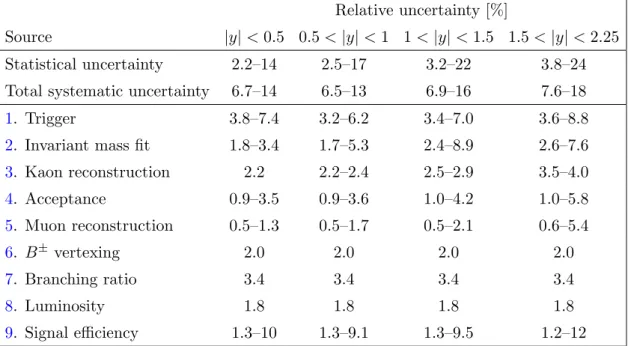
Relative uncertainty [%]
Source
|y| < 0.5 0.5 < |y| < 1 1 < |y| < 1.5 1.5 < |y| < 2.25
Statistical uncertainty
2.2–14
2.5–17
3.2–22
3.8–24
Total systematic uncertainty
6.7–14
6.5–13
6.9–16
7.6–18
1
. Trigger
3.8–7.4
3.2–6.2
3.4–7.0
3.6–8.8
2
. Invariant mass fit
1.8–3.4
1.7–5.3
2.4–8.9
2.6–7.6
3
. Kaon reconstruction
2.2
2.2–2.4
2.5–2.9
3.5–4.0
4
. Acceptance
0.9–3.5
0.9–3.6
1.0–4.2
1.0–5.8
5
. Muon reconstruction
0.5–1.3
0.5–1.7
0.5–2.1
0.6–5.4
6
. B
±vertexing
2.0
2.0
2.0
2.0
7
. Branching ratio
3.4
3.4
3.4
3.4
8
. Luminosity
1.8
1.8
1.8
1.8
9
. Signal efficiency
1.3–10
1.3–9.1
1.3–9.5
1.2–12
Table 1. The statistical and total systematic uncertainties on the cross-section measurement in different ranges of rapidity y. The contributions from the various sources of systematic uncertainty are also given. The range of values quoted for some of the uncertainties represent the lower and upper limit of the uncertainty over the pTrange in a given rapidity range.
7
Cross-section results
Using eq. (
5.1
), the differential cross-section for B
+production times the product of
branch-ing ratios B is obtained as a function of p
Tand y of the B
+meson and the results are
shown in tables
2
and
3
, averaged over each (p
T, y) interval. The double-differential
cross-section is integrated over p
Tto obtain the differential cross-section dσ/dy, or over rapidity
to obtain dσ/dp
T, and results are reported in tables
4
and
5
. When summing over the
intervals in p
Tor rapidity, the systematic uncertainty from each source is calculated from
the linear sum of the contributions from each interval, as they are correlated. Tabulated
results of the measurements presented in this paper are available in HepData [
56
].
Using the world-average values for the branching ratio B, the differential cross-sections
obtained are compared to predictions of Powheg (+Pythia) and MC@NLO (+Herwig)
and the FONLL approximations. For Powheg and MC@NLO the CT10 [
57
]
param-eterisation for the parton distribution function of the proton is used, while for FONLL
calculations the CTEQ6.6 [
58
] parameterisation is used. In all cases, a b-quark mass of
4.75 ± 0.25 GeV is used, with the renormalisation and factorisation scales, µ
r, µ
f, set to
µ
r= µ
f= µ, where µ has different definitions for the Powheg, MC@NLO and FONLL
predictions.
2The predictions are quoted with uncertainties due to the b-quark mass and
2
For Powheg: µ2= m2Q+(m2Q ¯Q/4−m 2
Q) sin2θQ, where mQ ¯Qis the invariant mass of the Q ¯Q system and
θQis the polar angle of the heavy quark in the Q ¯Q rest frame. For MC@NLO: µ2= m2Q+(pT, Q+pT, ¯Q) 2
/4, where pT, Qand pT, ¯Qare the transverse momenta of the produced heavy quark and antiquark respectively,
and mQis the heavy-quark mass. For FONLL: µ =
q m2
JHEP10(2013)042
[GeV] T p 10 20 30 40 50 100 Uncertainty [%] 1 10 ATLAS Trigger Fit Kaon rec. Signal efficiency vertexing ± B Acceptance Muon rec. Total systematic Statistical 0 < |y| < 0.5 [GeV] T p 10 20 30 40 50 100 Uncertainty [%] 1 10 ATLAS Trigger Fit Kaon rec. Signal efficiency vertexing ± B Acceptance Muon rec. Total systematic Statistical 0.5 < |y| < 1 [GeV] T p 10 20 30 40 50 100 Uncertainty [%] 1 10 ATLAS Trigger Fit Kaon rec. Signal efficiency vertexing ± B Acceptance Muon rec. Total systematic Statistical 1 < |y| < 1.5 [GeV] T p 10 20 30 40 50 100 Uncertainty [%] 1 10 ATLAS Trigger Fit Kaon rec. Signal efficiency vertexing ± B Acceptance Muon rec. Total systematic Statistical 1.5 < |y| < 2.25Figure 2. Relative systematic uncertainties on the cross-section determination as a function of pT
for different rapidity ranges. The total systematic uncertainty (solid area), including uncertainties from luminosity (1.8%) and branching ratio (3.4%), is compared to the statistical uncertainty (dashed line).
renormalisation and factorisation scales. Uncertainties from factorisation and
renormal-isation scales are estimated by varying them independently up and down by a factor of
two [
19
].
Powheg and MC@NLO predictions are compared with the double-differential
cross-section measurement in figure
3
. To allow a better comparison between the measured
cross-sections and the NLO predictions, figure
4
shows their ratio for each rapidity range
separately for Powheg and MC@NLO. The data are in good agreement with Powheg in
all rapidity intervals. MC@NLO, however, predicts a lower production cross-section at
low p
Tand a p
Tspectrum that is softer than the data for |y| < 1 and harder than the data
for |y| > 1. In the integration of the four rapidity intervals, this effect averages out and
the prediction of the cross-section dσ/dp
Tis compatible with data.
The FONLL prediction is compared with the measured differential cross-section
dσ/dp
Tin figure
5
. In this figure, the results from CMS [
23
] for B
+meson production
JHEP10(2013)042
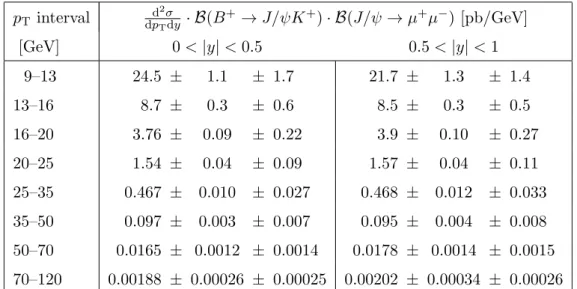
p
Tinterval
d2σ
dpTdy
·
B
(B
+
→ J/ψK
+) ·
B
(J/ψ → µ
+µ
−) [pb/GeV]
[GeV]
0 < |y| < 0.5
0.5 < |y| < 1
9–13
24.5 ±
1.1
± 1.7
21.7 ±
1.3
± 1.4
13–16
8.7 ±
0.3
± 0.6
8.5 ±
0.3
± 0.5
16–20
3.76 ±
0.09
± 0.22
3.9 ±
0.10
± 0.27
20–25
1.54 ±
0.04
± 0.09
1.57 ±
0.04
± 0.11
25–35
0.467 ±
0.010
± 0.027
0.468 ±
0.012
± 0.033
35–50
0.097 ±
0.003
± 0.007
0.095 ±
0.004
± 0.008
50–70
0.0165 ± 0.0012 ± 0.0014
0.0178 ± 0.0014 ± 0.0015
70–120
0.00188 ± 0.00026 ± 0.00025
0.00202 ± 0.00034 ± 0.00026
Table 2. Differential cross-section measurement for B+ production multiplied by the branching ratio to the final state, averaged over each (pT, y) interval in the rapidity range |y| < 0.5 and
0.5 < |y| < 1. The first quoted uncertainty is statistical, the second uncertainty is systematic.
p
Tinterval
d2σ
dpTdy
·
B
(B
+
→ J/ψK
+) ·
B
(J/ψ → µ
+µ
−) [pb/GeV]
[GeV]
1 < |y| < 1.5
1.5 < |y| < 2.25
9–13
23.6 ±
1.9
± 1.7
22.3 ±
1.8
± 1.9
13–16
8.0 ±
0.4
± 0.5
7.1 ±
0.4
± 0.6
16–20
3.29 ±
0.11
± 0.20
2.90 ±
0.12
± 0.21
20–25
1.32 ±
0.04
± 0.08
1.08 ±
0.04
± 0.07
25–35
0.408 ±
0.013
± 0.028
0.312 ±
0.012
± 0.022
35–50
0.073 ±
0.004
± 0.006
0.055 ±
0.004
± 0.006
50–70
0.0135 ± 0.0014 ± 0.0013
0.0097 ± 0.0012 ± 0.0012
70–120
0.00095 ± 0.00021 ± 0.00015
0.00083 ± 0.00019 ± 0.00014
Table 3. Differential cross-section measurement for B+ production multiplied by the branching
ratio to the final state, averaged over each (pT, y) interval in the rapidity range 1 < |y| < 1.5 and
1.5 < |y| < 2.25. The first quoted uncertainty is statistical, the second uncertainty is systematic.
FONLL prediction is in good agreement with the data concerning the behaviour in rapidity
and p
T, within the theoretical uncertainties.
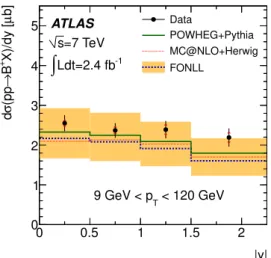
All available predictions for dσ/dy are compared with data in figure
6
. The measured
cross-section has a small rapidity dependence and is in agreement with the predictions
within their uncertainties. The theoretical uncertainties in all cases are large (∼30%) and
are similar for the Powheg, MC@NLO and FONLL predictions.
JHEP10(2013)042
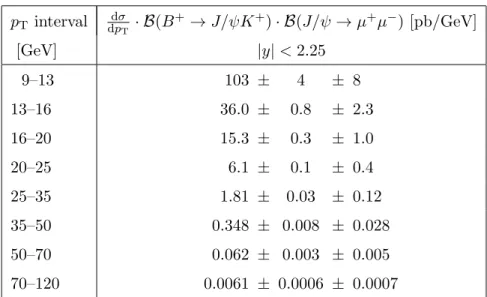
p
Tinterval
dpdσ T·
B
(B
+→ J/ψK
+) ·
B
(J/ψ → µ
+µ
−) [pb/GeV]
[GeV]
|y| < 2.25
9–13
103 ±
4
± 8
13–16
36.0 ±
0.8
± 2.3
16–20
15.3 ±
0.3
± 1.0
20–25
6.1 ±
0.1
± 0.4
25–35
1.81 ±
0.03
± 0.12
35–50
0.348 ± 0.008 ± 0.028
50–70
0.062 ± 0.003 ± 0.005
70–120
0.0061 ± 0.0006 ± 0.0007
Table 4. Differential cross-section measurement for B+ production multiplied by the branching ratio to the final state, averaged over each pT interval in the rapidity range |y| < 2.25. The first
quoted uncertainty is statistical, the second uncertainty is systematic.
|y| interval
dσdy·
B
(B
+→ J/ψK
+) ·
B
(J/ψ → µ
+µ
−) [pb]
9 GeV < p
T< 120 GeV
0.0–0.5
154 ± 5 ± 10
0.5–1.0
143 ± 6 ± 9
1.0–1.5
144 ± 8 ± 10
1.5–2.25
132 ± 7 ± 11
Table 5. Differential cross-section measurement for B+ production multiplied by the branching
ratio to the final state, averaged over each y interval in the pT range 9 GeV< pT< 120 GeV. The
first quoted uncertainty is statistical, the second uncertainty is systematic.
The integrated B
+production cross-section in the kinematic range 9 GeV < p
T<
120 GeV and |y| < 2.25 is:
σ(pp → B
+X) = 10.6 ± 0.3 (stat.) ± 0.7 (syst.) ± 0.2 (lumi.) ± 0.4 (B) µb.
The FONLL prediction, with its theoretical uncertainty from the renormalisation and
fac-torisation scale and the b-quark mass, is:
σ(pp → bX) · f
¯b→B+= 8.6
+3.0−1.9(scale) ± 0.6 (m
b) µb ,
where f
¯b→B+= (40.1 ± 0.8)% [
51
] is the world-average value for the hadronisation
frac-tion. The corresponding predictions of Powheg and MC@NLO are 9.4 µb and 8.8 µb,
respectively, with theoretical uncertainties similar to those of the FONLL prediction.
JHEP10(2013)042
[GeV]
Tp
10
20
30 40 50
100
b/GeV]µ
dy [
TX)/dp
+B
→
(ppσ
2d
-710
-610
-510
-410
-310
-210
-110
1
10
210
310
410
510
610
710
810
POWHEG+Pythia MC@NLO+Herwig ) 0 < |y| < 0.5 6 10 × ( ) 0.5 < |y| < 1 4 10 × ( ) 1 < |y| < 1.5 2 10 × ( 1.5 < |y| < 2.25 Data 2011ATLAS
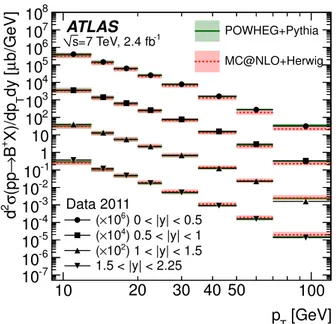
-1 =7 TeV, 2.4 fb sFigure 3. Double-differential cross-section of B+ production as a function of p
Tand y, averaged
over each (pT, y) interval and quoted at its centre. The data points are compared to NLO predictions
from Powheg and MC@NLO. The shaded areas around the theoretical predictions reflect the uncertainty from renormalisation and factorisation scales and the b-quark mass.
8
Conclusions
The differential cross-section for B
+meson production has been studied with 2.4 fb
−1of
pp collision data at
√
s = 7 TeV, recorded in 2011 with the ATLAS detector at the LHC.
The cross-section was measured as a function of transverse momentum and rapidity in
the range 9 GeV < p
T< 120 GeV and |y| < 2.25, and quoted with a total uncertainty
of 7%–30% with the main source of uncertainty being systematic. The
next-to-leading-order QCD calculation is compatible with the measured differential cross-section. The
predictions are obtained within the Powheg and MC@NLO frameworks and are quoted
with an uncertainty from renormalisation and factorisation scales and b-quark mass of the
order of 20%–40%. Within these uncertainties, Powheg+Pythia is in agreement with
the measured integrated cross-sections and with the dependence on p
Tand y. At low |y|,
MC@NLO+Herwig predicts a lower production cross-section and a softer p
Tspectrum
than the one observed in data, while for |y| > 1 the predicted p
Tspectrum becomes harder
than observed in data. The FONLL calculation for σ(pp → b X) is compared to the data,
assuming a hadronisation fraction f
¯b→B+of (40.1 ± 0.8)% [
51
], and is in good agreement
with the measured differential cross-section dσ/dp
T, within the theoretical uncertainty.
Acknowledgments
We thank CERN for the very successful operation of the LHC, as well as the support staff
from our institutions without whom ATLAS could not be operated efficiently.
JHEP10(2013)042
NLO σ / σ 0.5 1 1.5 2 NLO σ / σ 0.5 1 1.5 2 NLO σ / σ 0.5 1 1.5 2 [GeV] T p 10 20 30 40 50 100 NLO σ / σ 0.5 1 1.5 2 POWHEG+Pythia 0 < |y| < 0.5 0.5 < |y| < 1 1 < |y| < 1.5 1.5 < |y| < 2.25 ATLAS NLO σ / σ 0.5 1 1.5 2 NLO σ / σ 0.5 1 1.5 2 NLO σ / σ 0.5 1 1.5 2 [GeV] T p 10 20 30 40 50 100 NLO σ / σ 0.5 1 1.5 2 0 < |y| < 0.5 0.5 < |y| < 1 1 < |y| < 1.5 1.5 < |y| < 2.25 ATLAS MC@NLO+HerwigFigure 4. Ratio of the measured cross-section to the theoretical predictions (σ/σNLO) of
Powheg (left) and MC@NLO (right) in eight pT intervals in four rapidity ranges. The points
with error bars correspond to data with their associated uncertainty, which is the combination of the statistical and systematic uncertainty. The shaded areas around the theoretical predictions reflect the uncertainty from renormalisation and factorisation scales and the b-quark mass.
We acknowledge the support of ANPCyT, Argentina; YerPhI, Armenia; ARC,
Aus-tralia; BMWF and FWF, Austria; ANAS, Azerbaijan; SSTC, Belarus; CNPq and FAPESP,
Brazil; NSERC, NRC and CFI, Canada; CERN; CONICYT, Chile; CAS, MOST and
NSFC, China; COLCIENCIAS, Colombia; MSMT CR, MPO CR and VSC CR, Czech
Re-public; DNRF, DNSRC and Lundbeck Foundation, Denmark; EPLANET, ERC and NSRF,
European Union; IN2P3-CNRS, CEA-DSM/IRFU, France; GNSF, Georgia; BMBF, DFG,
HGF, MPG and AvH Foundation, Germany; GSRT and NSRF, Greece; ISF, MINERVA,
GIF, DIP and Benoziyo Center, Israel; INFN, Italy; MEXT and JSPS, Japan; CNRST,
Mo-rocco; FOM and NWO, Netherlands; BRF and RCN, Norway; MNiSW, Poland; GRICES
and FCT, Portugal; MERYS (MECTS), Romania; MES of Russia and ROSATOM, Russian
JHEP10(2013)042
[GeV] T p 6 7 8 10 20 30 40 100 b/GeV] µ [ T X)/dp + B → (pp σ d -6 10 -5 10 -4 10 -3 10 -2 10 -1 10 1 10 , |y|<2.25 -1 ATLAS, 2.4 fb , |y|<2.4 -1 CMS, 5.8 pb FONLL, |y|<2.25 =7 TeV s ATLAS FONLL σ / σ 0.5 1 1.5Figure 5. Differential cross-section of B+ production vs p
T, integrated over rapidity. The solid
circle points with error bars correspond to the differential cross-section measurement of ATLAS with total uncertainty (statistical and systematic) in the rapidity range |y| < 2.25, averaged over each pTinterval and quoted at its centre. For comparison, data points from CMS are also shown, for
a measurement covering pT< 30 GeV and |y| < 2.4 [23]. Predictions of the FONLL calculation [19]
for b-quark production are also compared with the data, assuming a hadronisation fraction of f¯b→B+
of (40.1 ± 0.8)% [51] to fix the overall scale. Also shown is the ratio of the measured cross-section to the predictions of the FONLL calculation (σ/σFONLL). The upper and lower uncertainty limits
on the prediction were obtained considering scale and b-quark mass variations.
|y| 0 0.5 1 1.5 2 b] µ X)/dy [ + B → (pp σ d 0 1 2 3 4 5 =7 TeV s -1 Ldt=2.4 fb
∫
Data POWHEG+Pythia MC@NLO+Herwig FONLL < 120 GeV T 9 GeV < p ATLASFigure 6. Differential cross-section of B+ production vs rapidity, integrated over p
T. Points with
error bars correspond to the differential cross-section measurement with total uncertainty (lines on the error bars indicate the statistical component) in the pT range 9 GeV < pT < 120 GeV,
averaged over each rapidity interval and quoted at its centre. Powheg, MC@NLO and FONLL predictions are also given for comparison. The FONLL prediction is quoted with upper and lower uncertainty limits, which were obtained considering scale and b-quark mass variations. The relevant uncertainties of the predictions of Powheg and MC@NLO are of the same order and are not shown.
JHEP10(2013)042
South Africa; MICINN, Spain; SRC and Wallenberg Foundation, Sweden; SER, SNSF and
Cantons of Bern and Geneva, Switzerland; NSC, Taiwan; TAEK, Turkey; STFC, the Royal
Society and Leverhulme Trust, United Kingdom; DOE and NSF, United States of America.
The crucial computing support from all WLCG partners is acknowledged gratefully,
in particular from CERN and the ATLAS Tier-1 facilities at TRIUMF (Canada), NDGF
(Denmark, Norway, Sweden), CC-IN2P3 (France), KIT/GridKA (Germany), INFN-CNAF
(Italy), NL-T1 (Netherlands), PIC (Spain), ASGC (Taiwan), RAL (UK) and BNL (USA)
and in the Tier-2 facilities worldwide.
Open Access.
This article is distributed under the terms of the Creative Commons
Attribution License which permits any use, distribution and reproduction in any medium,
provided the original author(s) and source are credited.
References
[1] P. Nason, S. Dawson and R.K. Ellis, The total cross-section for the production of heavy quarks in hadronic collisions,Nucl. Phys. B 303 (1988) 607[INSPIRE].
[2] P. Nason, S. Dawson and R.K. Ellis, The one particle inclusive differential cross-section for heavy quark production in hadronic collisions,Nucl. Phys. B 327 (1989) 49[Erratum ibid. B 335 (1990) 260] [INSPIRE].
[3] M. Cacciari, M. Greco and P. Nason, The pT spectrum in heavy flavor hadroproduction, JHEP 05 (1998) 007[hep-ph/9803400] [INSPIRE].
[4] M. Cacciari, S. Frixione and P. Nason, The pT spectrum in heavy flavor photoproduction, JHEP 03 (2001) 006[hep-ph/0102134] [INSPIRE].
[5] UA1 collaboration, C. Albajar et al., Beauty production at the CERN proton-anti-proton collider. 1,Phys. Lett. B 186 (1987) 237[INSPIRE].
[6] UA1 collaboration, C. Albajar et al., Measurement of the bottom quark production cross-section in proton-anti-proton collisions at√s = 0.63 TeV,Phys. Lett. B 213 (1988) 405[INSPIRE].
[7] CDF collaboration, D. Acosta et al., Measurement of the ratio of b quark production cross sections in ¯pp collisions at√s = 630 GeV and√s = 1800 GeV,Phys. Rev. D 66 (2002) 032002[hep-ex/0206019] [INSPIRE].
[8] CDF collaboration, F. Abe et al., Measurement of the bottom quark production cross-section using semileptonic decay electrons in p¯p collisions at√s = 1.8 TeV,Phys. Rev. Lett. 71 (1993) 500[INSPIRE].
[9] CDF collaboration, F. Abe et al., Measurement of the B meson differential cross-section, dσ/dpT, in p¯p collisions at
√
s = 1.8 TeV,Phys. Rev. Lett. 75 (1995) 1451[hep-ex/9503013] [INSPIRE].
[10] CDF collaboration, D. Acosta et al., Measurement of the B+ total cross section and B+ differential cross section dσ/dpT in p¯p collisions at
√
s = 1.8 TeV,Phys. Rev. D 65 (2002) 052005[hep-ph/0111359] [INSPIRE].
[11] D0 collaboration, S. Abachi et al., Inclusive µ and b quark production cross-sections in p¯p collisions at√s = 1.8 TeV,Phys. Rev. Lett. 74 (1995) 3548[INSPIRE].
JHEP10(2013)042
[12] D0 collaboration, B. Abbott et al., Small angle muon and bottom quark production in p¯pcollisions at√s = 1.8 TeV,Phys. Rev. Lett. 84 (2000) 5478[hep-ex/9907029] [INSPIRE].
[13] D0 collaboration, B. Abbott et al., Cross section for b jet production in ¯pp collisions at √
s = 1.8 TeV,Phys. Rev. Lett. 85 (2000) 5068 [hep-ex/0008021] [INSPIRE].
[14] CDF collaboration, D. Acosta et al., Measurement of the J/ψ meson and b-hadron
production cross sections in p¯p collisions at √s = 1960 GeV,Phys. Rev. D 71 (2005) 032001
[hep-ex/0412071] [INSPIRE].
[15] CDF collaboration, A. Abulencia et al., Measurement of the B+ production cross-section in
p¯p collisions at√s = 1960 GeV,Phys. Rev. D 75 (2007) 012010[hep-ex/0612015] [INSPIRE].
[16] CDF collaboration, T. Aaltonen et al., Measurement of the b-hadron production cross section using decays to µ−D0X final states in p¯p Collisions at√s = 1.96 TeV,Phys. Rev. D 79 (2009) 092003[arXiv:0903.2403] [INSPIRE].
[17] M. Cacciari, S. Frixione, M. Mangano, P. Nason and G. Ridolfi, QCD analysis of first b cross-section data at 1.96 TeV,JHEP 07 (2004) 033[hep-ph/0312132] [INSPIRE].
[18] J.C. Collins and R.K. Ellis, Heavy quark production in very high-energy hadron collisions,
Nucl. Phys. B 360 (1991) 3[INSPIRE].
[19] M. Cacciari et al., Theoretical predictions for charm and bottom production at the LHC,
JHEP 10 (2012) 137[arXiv:1205.6344] [INSPIRE].
[20] LHCb collaboration, Measurement of the B± production cross-section in pp collisions at √
s = 7 TeV, JHEP 04 (2012) 093[arXiv:1202.4812] [INSPIRE].
[21] LHCb collaboration, Measurement of J/ψ production in pp collisions at√s = 7 TeV,Eur. Phys. J. C 71 (2011) 1645[arXiv:1103.0423] [INSPIRE].
[22] LHCb collaboration, Measurement of σ(pp → b¯bX) at √s = 7 TeV in the forward region,
Phys. Lett. B 694 (2010) 209[arXiv:1009.2731] [INSPIRE].
[23] CMS collaboration, Measurement of the B+ production cross section in pp collisions at
√
s = 7 TeV, Phys. Rev. Lett. 106 (2011) 112001[arXiv:1101.0131] [INSPIRE].
[24] CMS collaboration, Measurement of the B0 production cross section in pp collisions at
√
s = 7 TeV, Phys. Rev. Lett. 106 (2011) 252001[arXiv:1104.2892] [INSPIRE].
[25] CMS collaboration, Measurement of the strange B meson production cross section with J/ψ φ decays in pp collisions at√s = 7 TeV, Phys. Rev. D 84 (2011) 052008[arXiv:1106.4048] [INSPIRE].
[26] CMS collaboration, Measurement of the Λb cross section and the ¯Λb to Λb ratio with Λb to
J/ψ Λ decays in pp collisions at√s = 7 TeV,Phys. Lett. B 714 (2012) 136
[arXiv:1205.0594] [INSPIRE].
[27] CMS collaboration, J/ψ and ψ2S production in pp collisions at
√
s = 7 TeV,JHEP 02 (2012) 011[arXiv:1111.1557] [INSPIRE].
[28] CMS collaboration, Inclusive b-hadron production cross section with muons in pp collisions at√s = 7 TeV,JHEP 03 (2011) 090[arXiv:1101.3512] [INSPIRE].
[29] CMS collaboration, Measurement of the cross section for production of b¯b X, decaying to muons in pp collisions at√s = 7 TeV, JHEP 06 (2012) 110[arXiv:1203.3458] [INSPIRE].
[30] CMS collaboration, Inclusive b-jet production in pp collisions at √s = 7 TeV, JHEP 04 (2012) 084[arXiv:1202.4617] [INSPIRE].
JHEP10(2013)042
[31] ATLAS collaboration, Measurement of the b-hadron production cross section using decays toD∗µ−X final states in pp collisions at√s = 7 TeV with the ATLAS detector,Nucl. Phys. B 864 (2012) 341[arXiv:1206.3122] [INSPIRE].
[32] ATLAS collaboration, Measurements of the electron and muon inclusive cross-sections in proton-proton collisions at√s = 7 TeV with the ATLAS detector, Phys. Lett. B 707 (2012) 438[arXiv:1109.0525] [INSPIRE].
[33] ATLAS collaboration, Measurement of the differential cross-sections of inclusive, prompt and non-prompt J/ψ production in proton-proton collisions at√s = 7 TeV,Nucl. Phys. B 850 (2011) 387[arXiv:1104.3038] [INSPIRE].
[34] ATLAS collaboration, Measurement of the inclusive and dijet cross-sections of b-jets in pp collisions at√s = 7 TeV with the ATLAS detector,Eur. Phys. J. C 71 (2011) 1846
[arXiv:1109.6833] [INSPIRE].
[35] ATLAS collaboration, The ATLAS experiment at the CERN Large Hadron Collider,2008 JINST 3 S08003[INSPIRE].
[36] ATLAS collaboration, Performance of the ATLAS trigger system in 2010,Eur. Phys. J. C 72 (2012) 1849[arXiv:1110.1530] [INSPIRE].
[37] ATLAS collaboration, Improved luminosity determination in pp collisions at √s = 7 TeV using the ATLAS detector at the LHC,Eur. Phys. J. C 73 (2013) 2518[arXiv:1302.4393] [INSPIRE].
[38] T. Sj¨ostrand, S. Mrenna and P.Z. Skands, PYTHIA 6.4 physics and manual,JHEP 05 (2006) 026[hep-ph/0603175] [INSPIRE].
[39] ATLAS collaboration, ATLAS tunes of PYTHIA 6 and PYTHIA 8 for MC11,
ATL-PHYS-PUB-2011-009(2011).
[40] ATLAS collaboration, The ATLAS simulation infrastructure,Eur. Phys. J. C 70 (2010) 823
[arXiv:1005.4568] [INSPIRE].
[41] GEANT4 collaboration, S. Agostinelli et al., GEANT4: a simulation toolkit,Nucl. Instrum. Meth. A 506 (2003) 250[INSPIRE].
[42] P. Nason, A New method for combining NLO QCD with shower Monte Carlo algorithms,
JHEP 11 (2004) 040[hep-ph/0409146] [INSPIRE].
[43] S. Frixione, P. Nason and G. Ridolfi, A positive-weight next-to-leading-order Monte Carlo for heavy flavour hadroproduction,JHEP 09 (2007) 126[arXiv:0707.3088] [INSPIRE].
[44] S. Frixione and B.R. Webber, Matching NLO QCD computations and parton shower simulations,JHEP 06 (2002) 029[hep-ph/0204244] [INSPIRE].
[45] S. Frixione, P. Nason and B.R. Webber, Matching NLO QCD and parton showers in heavy flavor production,JHEP 08 (2003) 007[hep-ph/0305252] [INSPIRE].
[46] B. Andersson, G. Gustafson, G. Ingelman and T. Sj¨ostrand, Parton fragmentation and string dynamics,Phys. Rept. 97 (1983) 31[INSPIRE].
[47] M.G. Bowler, e+e− production of heavy quarks in the string model,Z. Phys. C 11 (1981) 169
[INSPIRE].
[48] B. Andersson, G. Gustafson and B. Soderberg, A general model for jet fragmentation,Z. Phys. C 20 (1983) 317[INSPIRE].
JHEP10(2013)042
[49] G. Corcella et al., HERWIG 6: an event generator for hadron emission reactions withinterfering gluons (including supersymmetric processes),JHEP 01 (2001) 010
[hep-ph/0011363] [INSPIRE].
[50] B.R. Webber, A QCD model for jet fragmentation including soft gluon interference,Nucl. Phys. B 238 (1984) 492[INSPIRE].
[51] Particle Data Group collaboration, J. Beringer et al., Review of particle physics,Phys. Rev. D 86 (2012) 010001[INSPIRE].
[52] V. Kostyukhin, VKalVrt — Package for vertex reconstruction in ATLAS,
CERN-ATL-PHYS-2003-031(2003).
[53] ATLAS collaboration, Measurement of Υ production in 7 TeV pp collisions at ATLAS,
Phys. Rev. D 87 (2013) 052004[arXiv:1211.7255] [INSPIRE].
[54] ATLAS collaboration, Charged-particle multiplicities in pp interactions measured with the ATLAS detector at the LHC,New J. Phys. 13 (2011) 053033 [arXiv:1012.5104] [INSPIRE].
[55] T. Skwarnicki, A study of the radiative CASCADE transitions between the Upsilon-Prime and Upsilon resonances, Ph.D. thesis, Institute of Nuclear Physics, Krakow, Ploand (1986),
DESY-F31-86-02[INSPIRE].
[56] HepData,http://hepdata.cedar.ac.uk/view/ins1240670.
[57] H.-L. Lai, M. Guzzi, J. Huston, Z. Li, P.M. Nadolsky, et al., New parton distributions for collider physics,Phys. Rev. D 82 (2010) 074024[arXiv:1007.2241] [INSPIRE].
[58] P.M. Nadolsky, H.-L. Lai, Q.-H. Cao, J. Huston, J. Pumplin, et al., Implications of CTEQ global analysis for collider observables,Phys. Rev. D 78 (2008) 013004[arXiv:0802.0007] [INSPIRE].