1877-0428 © 2010 Published by Elsevier Ltd. doi:10.1016/j.sbspro.2010.07.071
Procedia Social and Behavioral Sciences 5 (2010) 190–198
WCPCG-2010
International Crime Victim Survey 2005: Criminal Victimization in
Istanbul Households
Galma Jahic
a*, AslÕ T. Akdaú Mitrani
baIstanbul Bilgi University, Faculty of Law, Istanbul, Turkey
bDo÷uú University, Department of Psychology, Istanbul, Turkey
Received January 1, 2010; revised February 11, 2010; accepted March 12, 2010
Abstract
This study aimed to explore the nature of criminal victimization in Istanbul. Face-to-face interviews were conducted using the standard ICVS questionnaire to a randomly selected sample of 1242 householders. Five-year victimization rates were found to be the highest for burglary and attempted burglary. One-year victimization rates for these two types of criminal victimization were higher than those for other European cities. It was found that rates of reporting the offenses to the police in Istanbul were comparably lower than in other European cities. Fear of crime was found to be comparably higher. The findings from Istanbul were discussed in the light of the international results.
© 2010 Elsevier Ltd.
Keywords: ICVS; criminal victimization; reporting; fear of crime.
1. Introduction
Crime is one of the most significant problems of contemporary societies. High rates of crime and violence result in fear amongst citizens, inflict trauma on victims, and the criminal justice systems often outcasts the perpetrators. Effect of crime spreads even further, as victims and their families suffer in the hands of the slow and inefficient criminal justice system, inducing secondary victimization. In that sense, entire societies are affected by crime and victimization. Research indicates that reactive policing strategies, that deal with crime after it occurs, are not as successful in crime prevention as proactive measures (Wilson & Petersilia, 2002). Proactive measures in crime prevention stipulate carefully planned and well implemented policies. Unfortunately, in most countries, reliable data on crime do not exist, which makes it hard to develop policies efficiently. Prevention policies developed without good knowledge of the situation “on the streets” tend to be based on biased and distorted picture of crime problem, relying solely on information about crime provided through media.
There are two traditional sources of data about crime: official statistics and victimization surveys (Maxfield & Babbie, 1998). Official statistics usually include incidences that have been reported to the police or resolved by the
* Galma Jahic. Tel.:+90-212-311-5171; fax: +90-212-253-8911. E-mail address: [email protected].
This research was funded by TÜBøTAK, Grant no SBB 104K100 Open access under CC BY-NC-ND license.
police. Since most crime never actually gets reported to the authorities, a vast amount of crime is never reflected in the official statistics and databases. Victimization surveys, on the other hand, mainly focus on the prevalence and incidence of crime victimization amongst citizens, and aim to explore how victims are affected by the experience of victimization. Victimization surveys thereby allow researchers to “count” crime incidences, even if they were never reported to the police, and to gather in-depth information about the context in which the crime occurred, experiences of the victims, and victims’ reactions to crime. Findings which are based upon representative and reliable samples can be used to develop estimations about crime rates and the prevalence of a variety of crimes (Van Dijk & Shaw, 2001).
In many countries, official statistics about crime are published annually by law enforcement units. Turkey, however, is among the countries that have very limited data on the scope and nature of crime problem. National police does not have an extensive data collection and analysis strategy, and until now law enforcement agencies did not issue any significant or comprehensive reports on crime data, other than a very basic table of reported offences classified by the type of offence.2 The only other potential source of information is the data collected in courts across the country by Ministry of Justice. Aggregate results are published annually by the Turkish Statistical Institute (TSI).3 Court data, however, do not include the cases that have eluded the criminal justice system. So far,
no nationwide victimization surveys have been conducted yet. Further, in Turkey, scientific research on crime problem is scarce. Hence, when it comes to crime rates, crime characteristics and victim reactions to crime, the body of knowledge that exists in Turkey is very limited.
It is for these reasons that a victimization survey was long overdue in Turkey. This article reports main findings of a victimization survey (International Crime Victim Survey) that was conducted in Istanbul.4 International Crime
Victim Survey (ICVS) is the largest international comparative research project on criminal victimization and crime rates. By now 5 waves of the project have been completed (1989, 1992, 1996, 2000, and 2005), and so far data from more than eighty countries has been accumulated.5 In order to ensure comparability of the data across countries, parallel research designs have been used: instruments used in different countries were kept identical, and sampling strategies similar. So far over 220,000 participants from all around the world were interviewed about their experiences of crime victimization, nature of their contact with law enforcement personnel, and their fear of crime. In ICVS 2005, 17 EU countries participated, in addition to several industrialized countries such as the USA, Japan, Canada, and New Zealand, many developing countries, and some Middle Eastern and African countries.6 Turkey, participated in the fifth wave of ICVS in 2005, with a sample of citizens from Istanbul. The objectives of the survey were as follows: 1) to acquire data on victimization rates, as an alternative to official statistics, 2) to determine the prevalence, incidence, nature and characteristics of various crimes, 3) to determine the victimization characteristics which are unique to different types of crimes, 4) to gather information about the citizens’ perceptions about safety, fear of crime and crime prevention measures, 5) to gather data on citizens’ attitudes and behaviours towards services provided by the police
2. Method
2.1. Participants
Total of 1242 participants, aged 16 or over were interviewed from a total of 1242 households in Istanbul. Half of the participants were women. Average age of the participants was 34.11. The sample of the households was derived as follows: 100 neighborhoods were randomly selected from a total of 670 neighborhoods of the Istanbul City 2 See the Activity Reports published by the General Directorate for Security, which is the equivalent of the National Police; reports available at
http://www.egm.gov.tr/duyurular.asp (in Turkish only).
3 See the website of the Ministry of Justice General Directory of Criminal Records and Statistics website at
http://www.adlisicil.adalet.gov.tr/istatistik_2008/ist_tab.htm (in Turkish only)
4 For logistic reasons it was not possible to conduct research with a national sample; however almost one quarter of the country’s population lives
in Istanbul, meaning that results regarding Istanbul should still be seriously considered.
5 See the ICVS website at http://rechten.uvt.nl/ICVS/ .
6 See the final global report of the EU ICS and ICVS that was published in 2007 (Van Dijk, Van Kesteren, & Smit, 2007) for detailed information
Municipality. Each street was categorized as low, middle, or high SES, depending on whether average real estate tax was higher, similar to, or lower that the average real estate tax of the neighborhood. Two streets representing each of the 3 levels were randomly selected from each neighborhood. From each street two households were selected randomly, and a women was interviewed in one of the households whereas a man in the other. For each neighborhood a total of 12 households participated in the research [(1 men + 1 woman)*(2 streets*3 SES levels)]. Randomly selected replacements from the same street were used in cases of refusals.
2.2. Instrument and Procedure
Data were collected through face-to-face interviews, using that standard ICVS questionnaire. By using the standard questionnaire, which was translated and adopted to Turkish while keeping changes at the minimum, we have ensured the comparability of the data, with all other countries that participated in ICVS. Questionnaire included questions on nine different types of criminal victimization: Car theft, theft from a car, burglary, attempted burglary, robbery, assault/threat, theft, consumer fraud, and bribery. Definitions of offences had to be the same across all the countries that participated in ICVS, to ensure the comparability of data. Hence, legal definitions of offences could not be used, as definitions very across legal systems. Therefore the definitions of offences used in the questionnaire should be considered as sociological definitions, rather than legal. Therefore, “crime” and “victimization”, here, refer to sociological concepts rate than legal. Further, questions on reporting the victimization to police, fear of crime, and attitudes towards punishment were also included.
3. Results
ICVS data for European cities that was used in this report originated from the “EU International Crime Survey” coordinated by Gallup Europe. The project was funded by the 6th Framework Programme of the European Commission.
3.1. Victimization rates
One (2004) and 5 year (2000-2005) victimization rates were calculated from the data, as shown in Table 1 and 2, respectively. When one year rates for Istanbul were compared to one year rates obtained in other European cities, it can be seen that while for some types of offences Istanbul has the highest victimization rates, for other types of offences; Istanbul is one of the cities with the lowest victimization rates. For example, when it comes to theft from a car, only London had higher rates than Istanbul. When it comes to car thefts, Dublin and Rome were the only two cities with higher rates than Istanbul. Burglaries also appear to be a problem, as rates found in Istanbul were the highest in Europe. For attempted burglary, again, only London had higher rates than Istanbul.
When looking at robbery and assault offences, victimization rates obtained in Istanbul were lower than victimization rates obtained in most other European cities. Robbery rates were found to be the highest in London (%3,38), with Istanbul rates being less than a third of this figure. Helsinki, Vienna, Copenhagen, Rome and Stockholm were the only cities that had lower robbery rates than Istanbul. When it comes to assault, Istanbul had the lowest rates of all other European cities. In terms of ‘low-level’ theft (such as pick pocketing), Istanbul, again, had quite low rates, with only the rates in Helsinki being lower. In other words, it appears that Istanbul has relatively low rates for offences that require physical proximity between the offender and the victim, while Istanbul has a more serious crime problem with offences that are more “impersonal” and less likely to lead to direct and/or physical confrontation between the victim and the offender, such as car theft and burglary. Based on these findings it can be argued that when it comes to violent offences, Istanbul is actually relatively safer than most other European cities, however property offences remain an issue in Istanbul.
When it comes to bribery, European cities had rather low victimization rates. Istanbul, however, had much higher rates, similar to those found in Athens and Budapest. In terms of consumer fraud, Istanbul was in the middle of the scale, with rates close to the European average.
Type of offense General sample (N=1242)
Car owners (N=446)
Car theft Household based %1,0 %2,9
Theft of a car Household based %3,2 %9,0
Burglary Household based %4,5 --
Attempted burglary Household based %4,0 --
Robbery Individual based %1,1 --
Theft Individual based %2,8 --
Assault/threat Individual based %0,7 --
Consumer fraud7 Individual based %9,7 --
Bribery8 Individual based %6,8 --
Table 2Five year victimization rates, for individuals and households (years 2000-2005 ).
Type of offence General sample
(N=1242)
Car owners (N=446)
Car theft Household based %3,9 %11,0
Theft of a car Household based %10,5 %29,4
Burglary Household based %15,7 --
Attempted burglary Household based %14,3 --
Robbery Individual based %4,4 --
Theft Individual based %12,2 --
Assault/threat Individual based %3,5 --
3.2. Reporting Victimization to the Police
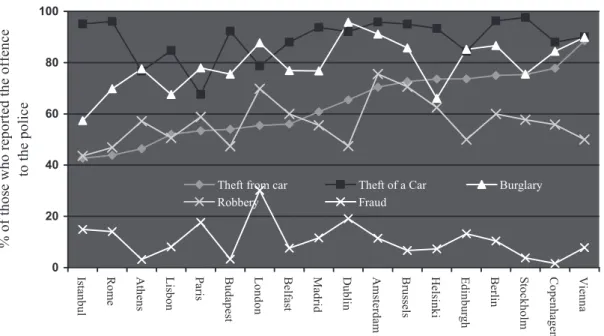
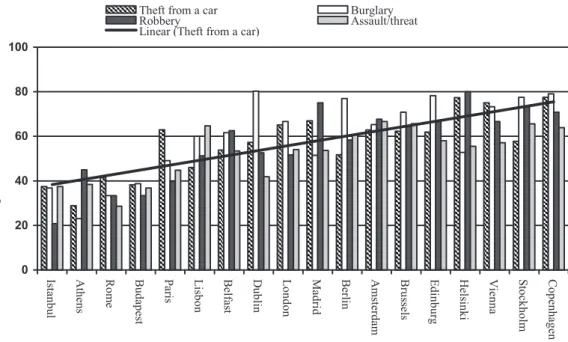
Participants who reported that they were victimized were asked whether they had reported the incident to police. Figure 1 shows the results. As can be seen from Figure 2 below, levels of reporting varied greatly in different cities in Europe, depending on the offence in question. Hence, for example, when it came to car theft, Istanbul had the next to highest reporting rate, but when it came to theft from a car or burglary, it had the lowest reporting rate. In general, however, the reporting rates in Istanbul were somewhat lower than reporting rates found in other European cities. The most frequently cited reasons for not reporting the incident to the police were: “Police would not do anything/there were no witnesses” and “Police could not do anything”. Those victims who reported the incidents to police were asked whether they were satisfied with the response they received form the police. In general satisfaction rates were lower than satisfaction rates in European cities, as is shown for different types of offences in Figure 3.
7 Only 1 year victimization rates were collected 8 Only 1 year victimization rates were collected
95,1 57,4 42,7 43,6 32,3 17,8 17,5 14,9 1,2 4,9 42,6 55,7 56,4 67,7 82,2 82,5 85,1 98,8 0% 20% 40% 60% 80% 100% Car theft Burglary Theft form a car Robbery Theft Assault/threat Attempted burglary Fraud Bribery
% of those who reported the offence to the police
Reported to police % Did not report to police % Not sure if reported to police %
Figure 1. Reporting to police rates, by type of victimization.
0 20 40 60 80 100 Istanbul Ro me A
thens Lisbon Paris Budapes
t L ondon Be lfa st Ma dr id D ublin Am ste rd am Bru ssel s H els inki E dinbur gh B
erlin Stockholm Copenhagen Vienna
%
of thos
e who reported the offence to the police Theft from car Theft of a Car Burglary
Robbery Fraud
0 20 40 60 80 100 Istanbul A thens Rome B udapes t Pa
ris Lisbon Belfast
D ublin London Ma dr id B erlin Amste rd am Bru ssel s E dinbur g H els inki V
ienna Stockholm Copenhagen
P
erce
ntage of victims
who were not s
atis
fied with th
e
police reaction
Theft from a car Burglary
Robbery Assault/threat
Linear (Theft from a car)
Figure 3. Satisfaction with the police, among those victims who reported their victimization: (Proportions of those who were satisfied).
3.3. Fear of Crime
In order to measure the fear of criminal victimization, all participants (both those who were victims of crime as well as those who were not) were asked two questions:
1. “How safe do you feel walking alone in your area after dark?”
2. “What would you say are the chances that over the next twelve months someone will try to break into your home?”
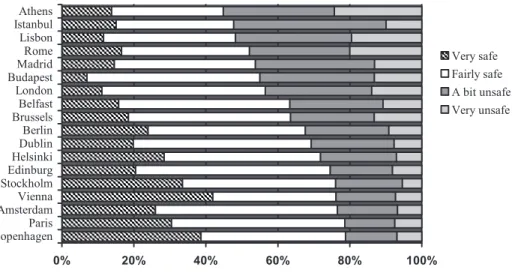
Results with regard to the first question, as shown in Figure 4, indicate that fear of crime is the highest in South European cities (including Athens, Istanbul, Lisbon, Rome and Madrid). The percentage of those who stated that they feel safe on the streets at night was very low in Istanbul (approximately 48%), compared to other European cities. Further, it was found that percentage of women who felt safe was even lower (44%, as compared to 60%for men), indicating that women perceive the streets to be more dangerous than men do.
Results regarding the second question, shown in Figure 5, indicate, again, that fear of crime is higher in Istanbul, than in most other European cities. In fact, 75% of participants in Istanbul indicated that they thought that it is highly likely or possible that their house will be burgled within the next 12 months. In London, which was found to have very similar burglary crime rates to Istanbul, this rate was 38% - half of that in Istanbul. This indicates that fear of crime in different cities is not directly related to actual victimization rates, and that cities with similar victimization rates can, hence have, very different levels of fear among citizens.
0% 20% 40% 60% 80% 100% CopenhagenParis Amsterdam Vienna StockholmEdinburg Helsinki DublinBerlin BrusselsBelfast London BudapestMadrid Rome Lisbon IstanbulAthens Very safe Fairly safe A bit unsafe Very unsafe
Figure 4. Answers to the following question: “How safe do you feel walking alone in your area after dark?”
0% 20% 40% 60% 80% 100% CopenhagenEdinburgh AmsterdamBudapest StockholmBerlin MadridParis Belfast Vienna BrusselsDublin LondonLisbon Rome HelsinkiAthens Istanbul High Possible Low Don't know
Figure 5. Answers to the following question:
“What would you say are the chances that over the next twelve months someone will try to break into your home?”
4. Discussion and Conclusions
The findings of the ICVS-2005 Istanbul yielded data on the prevalence of criminal victimization in Turkey for the first time, as an alternative to official statistics. Comparisons with other EU metropolitan cities enabled us to determine Istanbul’s relative standing in terms of crime rates, safety and satisfaction with policing services. In particular, Istanbul appears top in burglary and attempted burglary to be more prevalent than in most other EU cities. An implication of the finding for the law enforcement units can be to prioritize focusing on this offence, exploring the reasons behind higher victimization rates and developing and taking preventive actions specific to this type of a crime in Istanbul. Similarly, car theft and theft from cars were also found to be more prevalent in Istanbul, than in other EU cities. In fact, by looking at 2004 data it appears that Istanbul is at that time was one of the three least safe cities across Europe (of those that were included in the EU ICS project).
Street robbery and purse snatching (both were classified under robbery in this research) are usually considered to be the most prevalent type of crime in Istanbul. Findings of the present research indicated that Istanbul streets may not as dangerous as imagined by the citizens and as presented by the media. A comparison of robbery rates with
those from EU cities show that Istanbul is in fact one of the safest cities across Europe in terms of this type of crime. It is suggested to take measures to reduce the fear of this type of crime, among citizens.
Assault rates in Istanbul were strikingly low. Assaults and threats are often between individuals who somehow know each other, that have somehow escalated, and often neither party will exactly see itself as a victim. A comparison of EU 2005 data with those of Istanbul indicates that during 2004, the prevalence of threats and assaults was much lower in Istanbul (0.7%) than in EU (average rate for EU was 3%). It is possible that individuals in Turkey simply do not perceive themselves as victims, do not consider such fights and brawls as “offences” or “victimizations”, or simply such events occur more rarely in Istanbul than is originally thought.
In the previous 18 years, five waves of ICVS have been conducted, and the findings of those surveys indicated that crime rates demonstrated an increasing trend between 1988 and 1996 all over the world. Since then, however, between 1996 and 2004, a general trend of decrease was observed (Van Dijk, Mayhew & Killias, 1990; Van Dijk & Mayhew, 1992; Alvazzi del Frate, Zvekic, & Van Dijk, 1993; Mayhew & Van Dijk, 1997; Alvassi del Frate, 1998; Alvazzi del Frate & Van Kesteren, 2004, Van Dijk, Manchin, Van Kesteren, Nevala, & Hideg, 2006). Given that we do not have comparison data, it is not possible to tell whether crime rates in Istanbul are increasing or decreasing. We will only be able to reach such conclusions after the 6th wave of the ICVS, which will be administered around 2010.
Three other findings in this research stand out. First, it was found that in all types of offences, other than car theft, reporting to police rates were below 60%, for most offences below 50%. While for some offences, reporting rates in Istanbul were average, for others they were remarkably lower than in other European cities. This means that in Istanbul majority of offences are not reflected in official statistics and hence official statistics, even if collected very well, would fail to include a big chunk of criminal incidents. This also indicates that any changes in official crime rates should be interpreted very conservatively, as increase in reporting rates could easily make it look as if crime is increasing, especially since so many cases go unreported at this time. Further, this information also tells us that current law enforcement agencies in Istanbul are trying to combating crime, while having information about only about half of the offences that actually take place, or even less, and hence have very limited knowledge about the scope and the nature of crime problem in Istanbul.
Secondly, findings of ICVS-Istanbul indicate that in Istanbul, fear of crime amongst citizens is quite high. In fact, fear of criminal victimization and perceived likelihood of future victimization in Istanbul is disproportionate to the actual victimization rates, and this is even more apparent when Istanbul is compared to other European cities. This once again demonstrates that fear of crime experienced by the citizens is a distinctive phenomenon, not necessarily directly related to the actual crime rates and actual risks of victimization. It is a phenomenon of great significance, as it disrupts citizens’ daily activities and interferes with their sense of safety, and therefore should be a priority and part of every security policy (Rader, 2004).
Finally, third major finding is with regard to the rates of reporting to police and satisfaction with services provided by the police. There are two main conclusions that can be drawn based on the data: people believe that police will not be able to or will not be willing to intervene successfully with the crime cases. Aside from the concrete expectations that citizens have from police, such as finding the lost property and arresting the criminal, participants have also stressed so-called “psychological” expectations from police, such as getting informed about the process, feeling that their experience is truly validated. The satisfaction rates in Istanbul were among the lowest, indicating that police are somehow failing to satisfy the needs of the citizens. It is possible that low levels of satisfaction are related to low reporting rates. This implies that it is not sufficient for the police to do its job; it also has to communicate successfully with the citizens, and also respond to their needs, which may not be perceived as strictly “police” work.
In conclusion, ICVS-Istanbul has provided us with some pioneering data on the prevalence of crime victimization and on the nature of various types of offences in the city of Istanbul. Moreover, comparative quality of data allows us to put the Istanbul findings into perspective. It remains to be seen, however, what the trends are, as only longitudinal data will be able to tell us in which direction the victimization rates are changing. This information will only be available after further data and research become available.
References
Alvazzi del Frate, A., & Van Kesteren, J. N. (2004). Criminal victimization in urban Europe: Key findings of the 2000 International Crime
Victims Survey. Turin: UNICRI.
Alvazzi del Frate, A., Zvekic, U., & Van Dijk, J. J. M. (eds.). (1993). Understanding crime, experiences of crime and crime control; Acts of the
International Conference. Rome, 18-20 November, 1992. UN Publication No. 49. Rome: UNICRI.
Mayhew, P., & Van Dijk, J. J. M. (1997). Criminal victimization in eleven industrialized countries: Key findings from the 1996 International
Crime Victims Survey. Netherlands, The Hague: Ministry of Justice, WODC.
Maxfield, M. G., & Babbie, E. (1998). Research methods for crimina l justice and criminology ( 2nd ed.). New York, NY: West/Wadsworth. Rader, N. E. (2004). The threat of victimization: A theoretical reconceptualization of fear of crime. Sociological Spectrum, 46, 689-704. Van Djik, J. J. M., Manchin, R., Van Kesteren, J. N., Nevala, S., & Hideg, G. (2007). The burden of crime in the EU: Research report: A
comparative analysis of the EU International Crime Survey (EU ICS) 2005. Brussels: Gallup-Europe. Retrieved from:
http://www.gallup-europe.be/euics/Xz38/downloads/EUICS%20-%20The%20Burden%20of%20Crime%20in%20the%20EU.pdf
Van Dijk, J. J. M., & Mayhew, P. (1992). Criminal victimization in the industrialized world: Key findings of the 1989 and 1992 International
Crime Surveys. The Hague: Ministry of Justice.
Van Dijk, J. J. M., Maynew, P., & Killias, M. (1990). Experiences of crime across world: Key findings from 1989 International Crime Survey. Deventer: Kluwer Law and Taxation.
Van Dijk, J. J. M., & Shaw, M. (2001). The International Crime Victim Survey: Impact and future policy Õmplications. In H. Kury (Ed.),
International comparison of crime and victimization: The ICVS. Willowdale: De Sitter Publications.
Van Dijk, J. J. M., Van Kesteren, J. N., & Smit, P. (2007). Criminal victimization in international perspective: Key findings from the 2004-2005
ICVS and EU ICS. The Hague: Ministry of Justice, WODC