Journal of Air Transport Management 82 (2020) 101725
Available online 26 September 2019
0969-6997/© 2019 Elsevier Ltd. All rights reserved.
How efficient airways act as role models and in what dimensions? A
superefficiency DEA model enhanced by social network analysis
Umut Aydın
a, Melis Almula Karadayi
b, Füsun Ülengin
c,*aBandırma Onyedi Eylül University, Faculty of Engineering and Natural Sciences, Department of Transportation Engineering, Bandırma, Balıkesir, 10200, Turkey bIstanbul Medipol University, Faculty of Engineering and Natural Sciences, Department of Industrial Engineering, Beykoz, Istanbul, 34810, Turkey
cSabanci University, School of Management, Tuzla, Istanbul, 34945, Turkey
A R T I C L E I N F O Keywords:
Airline performance
Superefficient data envelopment analysis Stepwise regression
Social network analysis Eigenvector centrality
A B S T R A C T
In this empirical study, a five-stage methodology is used to examine the efficiency of 45 worldwide known airline companies from the financial, operation and marketing perspectives. Initially, the superefficient data envelop-ment model is run with inputs and outputs that are selected based on the literature review. However, because 21 out of 45 airline companies are found to be efficient based on this analysis, a stepwise regression-based mech-anism is applied to four reduced models – one for each output variable – for better discrimination. The outputs are, namely, net profit margin (financial output), passengers carried, on-time departure performance (opera-tional outputs), and customer satisfaction (marketing output). In this way, the significant input variables are found for each reduced model. In the third stage, in order to provide even more discrimination, social network- based eigenvector centrality values are used as the weights of the superefficiency scores, and the strengths and weaknesses of efficient airlines for each output are specified in terms of their related significant inputs. The results show that, when net profit margin is taken as an output, Vietnam Airlines has the top weighted super-efficiency value and excels in terms of available seat kilometers and liquidity, but it should improve its debt level. Although Norwegian Airlines has the highest efficiency with respect to debt level, it is not the best role model because its eigenvector centrality value is relatively low. However, Norwegian airlines also has the highest weighted superefficiency and acts as a role model in terms of on-time departures with respect to this output. Its main strength is liquidity, and it has no significant weaknesses. On the other hand, in terms of overall satisfaction and passengers carried, Vietnam Airlines and Thai Airways are the leaders, respectively. Vietnam Airlines is the only superefficient company with respect to overall satisfaction, while the basic strengths of Thai Airways in terms of passengers carried are its employee and fleet, and it has no significant weakness. A final aggregation of the results is made by making pairwise comparisons of the relative importance of four outputs for 7 experts selected from different departments of airline companies. According to the results, Net Profit Margin has the highest priority, followed by On-time Departure and Overall Customer Satisfaction, while passengers carried has the lowest importance. Based on these relative priorities, it can be said that Vietnam Airlines can be accepted as the top performing airline company, followed by Norwegian Airlines.
1. Introduction
Today, airline companies are facing important financial, operational and customer service performance fluctuations. To improve the competitiveness of airline companies, it is necessary to use appropriate tools to measure their efficiencies in these dimensions. However, the efficiency evaluation is difficult because of the large number of complex factors involved. For example, a focus on service quality may help to increase customer satisfaction and, hence, improve service productivity,
but the operational and financial performance may be subsequently reduced as a result. Contrarily, decisions to improve an airline’s oper-ational and financial performance regardless of customer satisfaction may result in internal and external factors that can cause a number of negative reactions. As seen, the problem has a multidimensional aspect. On the other hand, the results are also heavily influenced by the vari-ables that are taken into account (Colli et al., 2011).
This study proposes an integrated superefficiency Data Envelopment Analysis (DEA) model with a stepwise regression-based feedback * Corresponding author.
E-mail addresses: [email protected] (U. Aydın), [email protected] (M.A. Karadayi), [email protected] (F. Ülengin).
Contents lists available at ScienceDirect
Journal of Air Transport Management
journal homepage: http://www.elsevier.com/locate/jairtraman
https://doi.org/10.1016/j.jairtraman.2019.101725
mechanism and social network analysis to evaluate the performance of the world’s 45 major airline companies. The superefficiency DEA results are weighted with eigenvector centrality values to discriminate among the efficient airline companies. Based on the network-based analysis
proposed by Liu and Lu (2010), the strengths and weaknesses of each
efficient airline company are analyzed in detail for each considered output. For this purpose, a directed and weighted graph is constructed, in which the nodes represent the airline companies and the edges represent their relationships. This method can rank efficient DMUs, taking into account their qualities by utilizing the eigenvector centrality concept. This analysis aims develop a road map to specify the basic improvement areas in which each airline company should focus and make investments. The basic contributions of the study can be summa-rized as follows:
1. The inputs and outputs are initially specified based on a literature survey. The lack of nonfinancial measures encountered in the liter-ature is addressed by taking into account the customer satisfaction surveys and the operational indicators.
2. For each output, the most significant inputs are selected by using stepwise backward variable regression analysis. In this way, the less significant variables are eliminated from consideration.
3. Although the stepwise regression-based backward variable selection
technique is used with the classic DEA method (see section 2.2), its
use with the superefficiency DEA model is a novel approach in the literature and increases the discriminatory and ranking power of the traditional DEA model.
4. Subsequently, Social Network Analysis is used to specify each output variable for which efficient airline companies are leaders and role models in terms of input variables selected by stepwise regression analysis. The use of eigenvector centrality as a weight is itself a new concept in the group decision-making literature. Its application to find the weighted average of the superefficiency scores provides greater discriminatory power in the ranking of the efficient airline companies and a novel contribution to the airline management literature. Therefore, a benchmark is obtained for the airline com-panies to improve their effectiveness in different dimensions by analyzing the strengths and weaknesses of the role model in each dimension.
5. A final selection of the most efficient airline companies is made based on the aggregation of the efficiency results for the financial, opera-tions and marketing efficiencies. A pairwise comparison survey is conducted with 7 experts on airline companies who are selected from different departments to represent different perspectives. The rela-tive weights of these outputs are specified using the eigenvalues corresponding to the largest eigenvector, and the experts’ opinions are aggregated using geometric means.
The next section provides the literature survey on airline efficiency measurement and the variable selection methods. The third section provides the proposed methodology and its application to the worldwide known 45 airline companies, which also underlines the managerial implications for each output based on the superefficiency DEA. Social network analysis is conducted and eigenvector centrality values are used as the weights to compute the superefficiency score weighted by eigenvectorcentralitys. A final aggregation of the results is also provided to specify the top airline company. Finally, conclusions and further suggestions are given.
2. Literature review
2.1. Airline company efficiency research methods
The performance of airline companies has attracted the attention of the researchers. Different methods, such as Stochastic Frontier, DEA, Multi-Criteria Decision-Making methods (MCDM), regression, tobit,
logit, etc., are used for this purpose. However, as we will see in the literature survey, the analysis is generally focused on the financial data of these companies, whereas the nonfinancial performance is not usually
taken into account (Dinçer et al., 2017).
The first group of studies use MCDM methods for their performance analyses of airline companies. For this purpose, different MCDM methods have been developed to address airline performance evaluation
problems (Barros and Wanke, 2015; Wanke et al., 2015; Pineda et al.,
2018; Dinçer et al., 2017). The studies apply several MCDM approaches to the problem, compare their results, and then make a final decision. However, this approach is difficult to comprehend and implement because it requires an extensive technical knowledge in MCDM fields (Wang et al., 2016). Additionally, in traditional MCDM approaches, the performance evaluation of the airline industry may require the consid-eration of qualitative and quantitative data and a large number of per-formance attribute evaluations. In all these methods, there are main disadvantages that need to be discussed. First, different users will obtain different results when using the same method because often each have different backgrounds, expertise and experience. The preferred infor-mation associated with the decision-makers in the evaluation criteria varies from person to person. Additionally, the ratings and weights of the criteria are assumed to be known precisely. However, using different relative criteria weights has a significant effect on the ranking of the alternatives. In fact, the ranking results are very sensitive to changes in the attribute weights. Different techniques may yield different results when applied to the same problem. There are no better or worse tech-niques, only techniques that fit better to certain situations. It is not easy to say which MCDM approach is more reasonable and reliable for airline performance evaluation problems.
On the other hand, the models based on constructing an efficient frontier allows us to analyze the maximum possible output given certain inputs, and then to calculate the distance of the observed output to that frontier. The mathematical models proposed to determine such a fron-tier can be broadly classified as parametric models (e.g., stochastic frontier analysis (SFA)) and nonparametric models (e.g., DEA as
intro-duced by Charnes et al. (1978)). In a parametric model, a functional
form of the production function needs to be specified, in contrast to a nonparametric model, where specific assumptions about the form of the production function are not necessary. The DEA technique assumes that all deviations from the efficient frontier are due to inefficiency, while the SFA technique assumes that deviations from the efficient frontier can be either a realization of inefficiency or a random shock. There is no consensus as to which the most appropriate technique is. In fact, each has its own strengths and weaknesses (Coli et al., 2011; Barros and Couto, 2013). However, the parametric DEA models have been widely applied to measure the efficiency of airlines. DEA is a method of measuring the relative efficiency of a group of operating units wherein the relative values of the variables are unknown (Chow, 2014; Coli et al., 2011; Barros and Peypoch, 2009).
Most of the DEA studies evaluate the performance of the airlines in a
specific country or region DEA (Saranga and Nagpal, 2016; Lee and
Worthington, 2014; Lu et al., 2012; Mallikarjun, 2015; Rouse et al., 2002; Saranga and Nagpal 2016; Sakthidharan and Sivaraman, 2018).
Fuzzy DEA is an extended form of the standard DEA application to airlines performance evaluation, and is especially preferred in the case
of uncertain data (Wanke et al., 2016; Soltanzadeh and Omrani, 2018)
Recently, there has been a growing interest in applying DEA models to evaluate environmental performance of airlines and to reduce
unde-sirable outputs in addition to evaluating financial performance (Chang
et al., 2014, Arjomanbdi and Seufert, 2014, Choi et al., 2015, Cui and Li, 2017a, Li and Cui, 2017, Chen et al., 2017).
Lozano and Gutierrez (2011) introduce a multiobjective DEA
approach and Barak and Hadooei (2018) use multiattribute decision
making to evaluate airline performance evaluation in order to explore different trade-offs among airline operations, environmental impact, fleet costs and operating costs.
In conventional DEA models used to evaluate the airline efficiencies, the system is considered as a black box and does not take into account different processes of it, each having its own inputs and outputs. How-ever, recently, network DEA models consider the system as composed of
several stages with serial structure. Lozano and Gutierrez (2014) use a
slack-based network DEA to analyze the efficiency of European airlines.
Chen et al. (2017) provide a stochastic network DEA model to assess the
efficiency of 13 major Chinese airlines from 2006 to 2014. Zhu (2011)
builds a two-stage network DEA process to measure airline performance. Among the methods used to analyze airline companies’ efficiencies, DEA accommodates multiple inputs and outputs, uses linear program-ming and does not require assumptions about the statistical properties of the variables. DEA does not require the specification of a functional form to be fitted. If the true functional form is unknown, this feature of DEA could be advantageous, since it avoids the danger of fitting the wrong
functional form (Retzlaff-Roberts et al., 2004). That is, why a DEA-based
efficiency model is used in this study. However, a limitation of DEA methods is that they classify the decision-making units (DMUs) as effi-cient when they have a 100% efficiency score and ineffieffi-cient when they score below a 100% efficiency score. Although such a classification al-lows DEA to evaluate the efficiency of any data set, it does not allow the ranking of the DMUs. Several combinations based on superefficiency
and cross-efficiency (Li et al., 2018), social networks (De Blas et al.,
2018) and MCDM (Rakhshan, 2017) with data envelopment analysis are
used as new ideas to eliminate this problem. Aldamak and Zolfaghari
(2017) provide a detailed review of literature related to ranking methods with DEA and comparing their advantages and shortcomings.
The superefficiency concept in DEA was proposed by Andersen and
Petersen (1993) as a useful tool when there are too many efficient DMUs under evaluation and it is crucial to rank these efficient DMUs. The core idea of the proposed methodology is to exclude the target DMU from the reference set, which allows a DMU to be located on the efficient frontier. Therefore, the superefficiency score for an efficient DMU can take any
value greater than or equal to one (Zarafat Angiz et al. (2013), De Blas
et al., 2018)). Later, Tone (2002) extended the superefficiency model of
Andersen and Petersen (1993) and established the slacks-based measure of superefficiency, which evaluates efficiency by means of slack vari-ables. Slack variables defined in the model have the following charac-teristics: They are units-invariant and they represent either input excesses or output shortfalls (P~oldaru and Roots, 2014). The earlier literature has pointed out the importance and need for the supereffi-ciency concept in DEA models to provide additional discrimination and
ranking power (Ruggireo, 2005; Liu and Lu, 2010).
In this paper, a novel approach combining superefficiency, stepwise regression and social network analysis is used to rank the efficient airline companies according to financial, operational and marketing di-mensions. An input-orientation is preferred, since the outputs are less likely to be under the control of the individual airline companies than their choice of inputs in a competitive market. The CCR (Charnes, Cooper and Rhodes) model is also preferred in the published literature on airline efficiency studies (Coli et al., 2011; Rai, 2013; Sakthidharan and Sivaraman, 2018)). Therefore, an input-oriented slacks-based su-perefficiency DEA model with constant returns to scale (hereinafter Super-SBM-I-C) is preferred in this research.
The justification of selecting Super-SBM-I-C as the most proper for implementation can be justified as follows. The inputs and outputs selected in this study evaluate both operational(Available Seat Kilo-meter (ASK), Revenue Passenger KiloKilo-meter (RPK), Fleet Size, Cargo Carried (Metric Tons), Passenger Carried (PAX), Employee Number, On- Time Departure Performance (OTP)), financial (Debt Ratio, Current Ratio, Quick Ratio, Cash Ratio, Liquidity, Net Profit Margin (NPM)) and service satisfaction (Overall Customer Satisfaction Score (OCSS)). Therefore an overall efficiency is analyzed rather than focusing on only technical efficiency. Such an evaluation is consistent with the majority
of existing airline efficiency studies (Sj€orgen, 2016). This made CCR
model the be the most proper approach because CCR model accepts that
if a DMU is efficienct it is both technically and scale efficient while under VRS model a unit efficiency score means only technical efficiency (Kottas and Madas, 2018; Thanassoulis, 2001). On the other hand, air-lines have greater control over the inputs while the outputs are primarily influenced by macro-economic factors. We assume that airlines have a higher influence on the input variables than on the output variables. Our aim is to gain efficiency by reducing excess inputs while continuing to
operate with the current technology mix (Kottas and Madas, 2018;
Merkert and Hensher, 2011). The reason of selecting superefficienct DEA model is its discrimination power among efficiency scores by eliminating ties of efficient DMUs and its potential to detect outliers which consists of the DMUs having superefficiency scores greater than
two (Kottas and Madas, 2018).
To the best of our knowledge, there is no published paper combining a network-based approach and superefficiency in DEA to improve the discriminating power of traditional DEA for performance evaluation.
2.2. Research on variable selection in DEA
The specification of a DEA model necessitates the selection of appropriate inputs and outputs to be included in the model. One po-tential limitation of DEA is its sensitivity to appropriate variable selec-tion. In fact, the DEA scores are affected by the inclusion or exclusion of an input or an output. Although a simple DEA model that contains all the relevant information is generally preferred, there is always the danger of the exclusion of relevant variables, which may result in biased perfor-mance measurement. On the other hand, it is also necessary to avoid including irrelevant variables in the model that may result in overfitting. Therefore, one of the most important steps in the application of data envelopment analysis is the selection of appropriate input and output variables.
The literature review reveals many multivariate statistical tech-niques, such as Efficiency Contribution Measure (ECM), Principal Component Analysis (PCA), regression-based tests and bootstrapping,
for the selection of most appropriate variables (inputs/outputs).
Natar-aja and Johnson (2011) compare these four most-widely used ap-proaches to variable selection in DEA. Efficiency contribution measures consider two DEA formulations, one with the candidate variable and one without it. A binomial statistical test is then used to determine whether
the candidate variable is important for the problem at hand (Chen and
Johnson, 2010). Principal Component Analysis (Adler and Golany,
2001) is used to reduce the dimensionality of data. In the
regression-based test, efficiency is regressed against a set of candidate variables which tests whether they are significant or not (Ruggiero,
2005). Bootstrapping is proposed by Simar and Wilson (2001) to test the
relevance of removing input and output variables, as well as the
po-tential for aggregation. The simulation analysis results of Nataraja and
Johnson (2011) show that Principal Component’s application to DEA has the smallest run time, works with a smaller sample size (n � 25), while the efficiency contribution measure works well with a low cor-relation and sample size but is vulnerable dimensionality problems while bootstrapping, has a heavy computational burden and has poor performance. They conclude that the four methods reveal significant differences and, thus, it is necessary to select the best-fit method ac-cording to the conditions of the problem at hand.
Because our problem has a relatively small sample size (n ¼ 45) and the correlations among the variables are very low (average correla-tion ¼ 0.179), is robust to the use of CRS or VRS and is easy to imple-ment, in this research we decided to the use regression-based method for the selection of the appropriate input variables. In fact, the basic reason for low correlation is the factor analysis conducted to combine three variables, namely current, quick and cash ratios under the factor that we called “liquidity”.
Wagner and Shimshak (2007) use a formal stepwise approach to variable selection. This method drops one variable at a time and uses a nonparametric test for the significance of the dropped variables. The
method is based on sequentially maximizing (or minimizing) the average change in efficiency as variables are added (dropped) from the model. If more than one variable has a significance value less than 20%, it uses a mean efficiency change and removes the variable with the least significant change. The procedure is repeated until all variables’ per-centage change in significance values are greater than 20%. At least one input and output variable is required to run the final model.
Subramanyam (2016) proposes a new stepwise method to reduce the data set. The method is based on the improvement of the method
pro-posed by Wagner and Shimshal (2007) and includes an additional step
such that, if the percentage change in significance value is greater than 20%, then it retains the variable, otherwise it removes the variable from the data exploration.
In this paper, the stepwise approach proposed by Subramanyam
(2016), which is the improved version of Wagner and Shimshal (2007)’s approach, is used for variable selection and for reducing the insignifi-cant input and output variables. However, as a novel approach, the backward procedure is applied not to the classic but to the supereffi-ciency DEA model because an important problem in the application of DEA for ranking is that usually many DMUs are found to be efficient and
are therefore given the efficiency score of one (Cook and Seiford, 2009).
3. Proposed methodology
3.1. Framework
The methodology used in this paper consists of five phases. More specifically, the proposed methodology initially runs the superefficient SBM models with all possible inputs and outputs, based on the literature review. Efficient airlines are listed and ranked at the end of the first stage using the full DEA models. Then, in the second stage, a regression-based mechanism is applied to different output scenarios, which are Net Profit Margin (NPM), On-time departure performance (OTP), Customer
Satisfaction (OCSS) and Passengers carried (PAX). In the third stage, reduced superefficient SBM models are run and efficient airlines are determined and ranked. Furthermore, benchmarking and road maps for airlines are provided in the final stage, which includes identification of the strengths and weaknesses of each airline company. Managerial im-plications are provided for the managers of the airline companies for each output. The best airline company as a result of the aggregation of the four outputs is also analyzed through the pairwise comparison of the relative weights of the outputs according to expert opinions. The
flow-chart of the proposed model is presented in Fig. 1.
3.2. Evaluation of airline companies using proposed framework 3.2.1. Phase I: efficiency evaluation of the full DEA model
The preliminary list of financial, operational and marketing perfor-mance indicators based on the literature survey and factor analysis
re-sults is given in Table 1. The Bloomberg database (Bloomberg (2016)) is
initially used, especially for financial and operational indicators, and the missing values in the data set are obtained from the annual reports of the airline companies. Even though it is difficult to collect consistent data on airline service quality, service quality indicators should be incorporated
into airline efficiency studies to make the results more realistic (Oum
et al., 2005). In this context, an Overall Customer Satisfaction Score is created using data that was obtained from Skytrax Internet-based sur-veys that measure the level of customer satisfaction with the airlines. Skytrax sets out this list using the results of airline customer satisfaction
surveys and publishes it on their webpage (https://www.airlinequality.
com). This is used as a proxy variable for marketing performance.
Initially, the Airlines in the Skytrax Top 100 Airlines list of 2016 are used to create the dataset but, due to the lack of data for each airline, the complete and accurate data for 2016 is found for only 45 airlines, which are selected for analysis. The inputs and outputs that are initially are selected for this study based on the most frequently used ones in the
publihed literature. Data availability is also considered. However, in the second step most significant inputs are screened by step-wise regression analysis.
As can be seen from Table 1, we have several financial ratio in-dicators in this research. It is known that the convexity axiom embedded in standard DEA models cannot be fully satisfied where the dataset in-cludes ratio measures and the results obtained from such models may
not be correct and reliable (Zhu, 2011; Hatami-Marbini and Toloo,
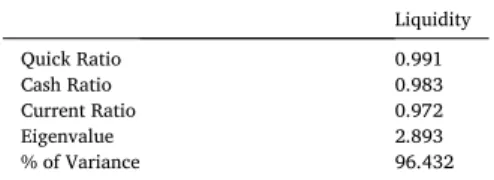
2019). Hollingsworth and Smith (2003) stated that BCC formulation should be deployed when rations are used in DEA. This specification ensures that all comparison between units is by interpolation only, and that extrapolation of behaviour to infeasible performance is ruled out. However, the reasons of using specifically a CRS based model in this study is explained in detail in section 2.1. In order to avoid the ratio issue to some degree, a factor analysis is conducted by taking the logarithm of both the numerator and the denominator of each ratio. In fact, when the information provided by the Cash, Current and Quick Ratios variables are considered, it can be seen that all of these variables are indicators of the cash availability of companies and, hence, they provide the same type of information. Therefore, Factor Analysis results obtained after the logarithmic transformation of the numerator and denominator of each of these three ratio variables can be seen in Table 2. According to the Factor Analysis result, one dimension, which we call “Liquidity”, can explain approximately 96.4% of the variances of Cash, Quick and Cur-rent Ratios (see Table 2). For this reason, the Liquidity dimension is used as a variable that can serve as a substitute for these three variables at the subsequent stages., factor analysis is conducted by taking the logarithm of the numerator and denominator of each ratio.
Additionally, we checked whether the number of DMUs (Airlines) is
at least twice the total number of input and output factors (Golan et al.,
1989). When the number of inputs and outputs of the models are
considered, the Full Model has 5 inputs and 6 outputs. Reduced Models 1, 2 and 4 have 3 inputs and 1 outputs, while Reduced Model 3 has just 1 input and 1 output. Therefore, it can be said that the condition is satisfied.
Initially, efficiency evaluations of 45 airline companies using a conventional input-oriented CRS DEA model are carried out. According to the results, 28 of the evaluated (target) airlines are found to be effi-cient. Because this is a very high number, in order to better discriminate among airline companies, it is decided to use the superefficiency concept. In this study, efficiency evaluations of full and reduced DEA
models are conducted using super SBM-I-C. For an efficient DMUk, super
SBM-I-C is formulated as follow (Tone, 2002; Tran et al., 2019):
minδk¼ 1 m Pm i¼1 ~ xi xik 1 s Ps r¼1 ~ yr yrk ; Table 1
Performance indicators used in the analysis. Classification Indicator Evaluation
Formula/ Definiton
References Type of Variable Financial Debt Ratio Total Assets/
Total Liabilities Feng and Wang (2000),
Bigliardi and Ivo Dormio (2010), Dinçer et al. (2017)
Input
Current Ratio Current Assets/ Current Liabilities Wang (2008), Dinçer et al. (2017) Input Quick Ratio (Cash and Cash
Equivalents þ Account Receivables þ Short Term Investments)/ Short Term Liabilities Mahesh and Prasad (2012),
Lee and Jang (2007), Wang (2008)
Input
Cash Ratio Cash and Cash Equivalents/ Short Term Liabilities
Wang (2008),
Armen (2013) Input
Liquidity The variable obtained by saving the factor score as a regression score obtained as a result of Principle Component Analysis using Current, Quick and Cash ratios
Lee and Jang
(2007) Input
Net Profit Margin (NPM)
Net Profit/
Revenue Teker et al. (2016) Output
Operational Available Seat Kilometer (ASK) Number of Seats Available x Number of Kilometers Flown Coli et al. (2011), Choi et al. (2015), Saranga and Nagpal (2016) Input Revenue Passenger Kilometer (RPK) Number of Revenue Passengers x Number of Kilometers Flown Barros and Peyboch (2009) Input
Fleet Size Number of Aircraft Operated by Airline Barros and Peyboch (2009) Input Cargo Carried
(Metric Tons) Payload Carried by Airline Sakthidharan &Sivaraman (2018) Output Passenger Carried (PAX) (Million) Passenger Carried by Airline Sakthidharan &Sivaraman (2018) Output Employee
Number Number of Employee Barros and Peyboch (2009), Ha et al., 2013, Arjomandi and Seufert (2014), Chang et al. (2014), Lee and Worthington (2014), Choi et al. (2015),
Cui and Li, 2017
Input
On-Time
Departure Ratio of Departure see www.oag.com/ https:// Output
Table 1 (continued)
Classification Indicator Evaluation Formula/ Definiton
References Type of Variable Performance
(OTP) (%) within þ-15 Minutes of Scheduling Departure Time airport-and- airline-on-time performance- report), Cho and Lee (2011), Chow (2014), Zhang et al. (2014), Dinçer et al. (2017) Marketing Overall Customer Satisfaction Score (OCSS) The Ratings of Airlines Between 1 and 10 about Airlines Overall Service Quality see https:// skytraxratings. com Chow (2014) Output
s:t: ~xi� Xn j¼1;j6¼k xijλj; i ¼ 1; …; m; ~ yr� Xn j¼1;j6¼k yrjλj; r ¼ 1; …; s; (1) ~ xi�xik; i ¼ 1; …; m; 0 � ~yr�yrk; r ¼ 1; …; s; λj�0; j ¼ 1; …; n; j 6¼ k;
where ~xiði ¼ 1; …; mÞ and ~yrðr ¼ 1; …; sÞare decision variables with respect to inputs and outputs, respectively; and λ is a non-negative vector.
Table 3 shows efficient airlines and their superefficiency scores with respect to the full model.
3.2.2. Phase II: the best input and output combination selection using a stepwise regression-based approach
In this study, we employed a stepwise regression-based backward analysis for variable selection. Stepwise regression conducts multiple regression a number of times, each time removing the weakest corre-lated variable from the model. Based on the literature survey, we determined six important outputs from the available data set, namely cargo carried (CARGO), passenger carried (PAX) and on-time departure, Overall Customer Satisfaction Score (OCSS), Net Profit Margin (NPM) and Revenue per passenger (RPK), for the regression analysis, as these are the most critical outputs for airline companies. However, since no significant inputs remained for CARGO and RPK after the stepwise analysis, they are excluded from the analysis. The stepwise regression analysis is used for each of the 4 outputs separately (reduced models
1,2,3, and 4). In this research, the methodology proposed by
Sub-ramanyam (2016) is adapted to the superefficiency model. It iterates through the following steps using the efficiency scores obtained from super SBM-I-C model as dependent variables for each specified output: Step 1: Determine input variables that contribute the most to pre-dicting the specified output variable.
Step 2: Run the super SBM-I-C model and store the superefficiency scores and add them to the regression model.
Step 3: Check the p-values of all input variables in the model. Remove the inputs from the model if their p-values are above 0.10 (significance test of the dropped variables).
Step 4: Repeat this procedure until all “significant” inputs are in the model and all “nonsignificant” inputs are removed). If the p-value of none of the input variable is significant, the related output-based model is eliminated from consideration
The variables having significant coefficients for each output variable,
as well as their standard errors, can be seen in Table 4. As seen from the
table, the inputs have negative coefficients.
3.2.3. Phase III: efficiency evaluation of the reduced DEA models
In this phase, the efficient airlines are found using four reduced models, one for each of the four different outputs. The output of Reduced Model 1 is NPM, and the output of the Reduced Model 2 is OTP, while both models have same inputs. Norwegian Airlines, Bangkok Airways, Aegean Airlines, Aeromexico, United Airlines, Icelandair and China Eastern are efficient airlines with respect to both Reduced Models 1 and 2. Alaska Airlines and Copa Airlines have superefficiency scores greater than 1 with respect to only Reduced Model 1. South African Airlines and TAP Air Portugal are efficient according to Reduced Model 2 only. Vietnam Airlines shows high performance with respect to Reduced Model 1 and Reduced Model 3; Delta Airlines is efficient with respect to Reduced Model 1 and Reduced Model 4; and Thai Airways, EasyJet and Asiana Airlines have superefficiency scores greater than 1 according to
Reduced Model 4. Table 5 shows the efficient airlines according to the
reduced models.
When Table 5 is analyzed, it can be seen that airlines have different
superefficiency scores according to the models. Therefore, in order to specify how airlines’ superefficiency scores, change with regard to the models used, the coefficients of variations (CV) are calculated. Since CV represents the average superefficiency score variation for each airline, it can be said that the airlines that have CV over 1, such as Thai Airways (1.24), United Airlines (1.19), South African Airways (1.11), Singapore Airlines 1.09), Emirates (1.08), Korean Air (1.07) and China Airlines (1.04), have different superefficiency scores with respect to different models. On the other hand, airlines such as Jet Airways (0.58), Air China (0.57), China Eastern (0.57), TAP Air Portugal (0.45) and Aeromexico (0.44) have approximately 0.5 CV, and this CV indicates that these airlines show nearly the same performance from one model to another. Finally, the overall CV mean is approximately 0.78, and this means that the airlines have approximately 0.8 standard deviation difference in superefficiency scores with respect to the full and reduced models.
As seen from the results even though the reduced models have lower number of efficient airline companies, the discriminatory power of the ranking of superefficiency models is still low, except in reduced model 3. In the full model, which includes all the inputs and outputs, 28 airline companies out of 45 are found to be efficient. In the Reduced Model 1 (Inputs: Debt Ratio, Liquidity, ASK, Output: NPM) the number of effi-cient airline companies decreased to 11. In Reduced Model 2 (Inputs: Debt Ratio, Liquidity, ASK, Output: OTD) the number of efficient airline
Table 3
Efficient Airlines and their Superefficiency Scores with respect to Full Model.
DMU Superefficiency Score Rank DMU Superefficiency Score Rank DMU Superefficiency Score Rank
Thai Airways 5.994 1 Asiana Airlines 1.270 11 China Airlines 1.091 21
United Airlines 3.550 2 Emirates 1.267 12 China Eastern 1.087 22
Vietnam Airlines 3.456 3 TAP Air Portugal 1.250 13 Lufthansa 1.082 23
Norwegian 3.095 4 Singapore Airlines 1.248 14 SAS Scandinavian 1.054 24
Bangkok Airways 1.722 5 Japan Airlines 1.168 15 Alaska Airlines 1.045 25
Delta Air Lines 1.699 6 South African Airways 1.149 16 Copa Airlines 1.039 26
Aegean Airlines 1.592 7 Aeromexico 1.148 17 Southwest Airlines 1.023 27
Korean Air 1.320 8 China Southern 1.121 18 British Airways 1.006 28
Icelandair 1.298 9 Hainan Airlines 1.117 19
EasyJet 1.273 10 Hawaiian Airlines 1.094 20
Table 2
Factor analysis result.
Liquidity Quick Ratio 0.991 Cash Ratio 0.983 Current Ratio 0.972 Eigenvalue 2.893 % of Variance 96.432
companies decreased to 9, and in Reduced Model 3 (ASK is the input, OCSS is the output), only one airline remained and, finally, in Reduced Model 4 (Inputs: Fleet, Liquidity, Employee; Output: PAX), the number of efficient airline companies is 4 (see Table 5). As a result, in order to better discriminate among the efficient airline companies and to specify their strength and weaknesses for each reduced model, in the next stage, a social network-based analysis is conducted.
3.2.4. Phase IV: social network-based superefficiency DEA analysis to provide a roadmap
In the fourth phase (Benchmarking), Social Network Analysis is used to identify the importance of each airline company within the network. Social Network Analysis has emerged as a key concept for focusing on the relationships between social entities such as nations, families, etc. These entities are influenced by other entities they take as role models, and such connections often comprise a social network and can be
analyzed using social network analysis methods (DeNooy et al., 2011;
McCulloh et al., 2013).
In this paper, the social entities are the airline companies. The use of social networks in airline management is a very recent trend. To our knowledge, there are very few papers that use social networks in airline
management. Çavdar and Ferhatosmano�glu (2018) analyzes the
customer lifetime value in airline management while Lozano and
Calzada-Infante (2017, 2019) use it for benchmarking and efficiency assessment of airlines.
In this research, an eigenvector centrality measure is used to define the weights of the superefficiency scores of the efficient airlines and to calculate the weighted average score for each to have a robust discrimination in terms of ranking the efficient companies. Furthermore, we determined the strengths and weaknesses of each efficient airline
company for each of the reduced models corresponding to each output.
The network-based eigenvector centrality method proposed by Liu and
Lu, 2010 is used for this purpose. Finally, the managerial implications are given for the airlines to improve their efficiency in terms of each reduced model.
In the recent large-group decision-making literature, the centrality concept of social networks is used as the weight of the social entities to show their relative importance (Hengie et al. (2018); Lesser et al. (2017); Dong et al. (2018)). In fact, the degree of centrality counts how many links each airline company has. The degree of an airline is simply the count of the number of links going into it, in-degree, or coming from it, out-degree. However, degree centrality is limiting because it does not take into account which other nodes are important in the network. In this paper, we would such as to know the number of connections among superefficient airline companies. Therefore, it is necessary to find which airline companies are connected to important airline companies (i.e., airline companies with many links). The airline companies with high eigenvector values have the power to connect with many other influ-ential airline companies. This measure is called eigenvector centrality. In this paper, the eigenvector centrality measure is used to find the relative weight of each airline company for each output and the related significant input combination. The vectors are created by the Pajek64 5.05 Network > Create Vector > Centrality > Hubs-Authorities com-mand, which contains eigenvector centrality scores (De Nooy et al.,
2011). As in degree centrality, eigenvector centrality measure assumes
that, if decision-making units are more central, that is if they have many central contacts, it is important to know if they play a role in influential decision-making units. In other words, it is important to be a role model but it is also important to know for which airline you are acting as a role
model (Liu and Lu (2010), De Nooy et al., 2011),). If an airline company
Table 4
Specification of significant input variables for reduced models 1–4 using stepwise regression analysis.
Variables Unstandardized Coefficient Coefficients Standard Error Significance (t) Significance (F)
Reduced Model 1:
NPM (Dependent output) 0.002**
Constant 1.854 0.346 0.000***
Employee Number (Input) 0.727
Debt Ratio (Input) 0.015 0.004 0.001***
Liquidity (Input) 0.186 0.078 0.021**
Available Seat Kilometer (Input) 2.03E-06 0.000 0.005***
Fleet Size (Input) 0.631
Reduced Model 2
OTP (Dependent-Output) 0.004**
Constant 1.884 0.390 0.000***
Employee Number (Input) 0.309
Debt Ratio (Input) 0.009 0.005 0.067*
Liquidity (Input) 0.227 0.088 0.013**
Available Seat Kilometer (Input) 2.88E-06 0.000 0.001***
Fleet Size (Input) 0.300
Reduced Model 3
OCSS (Dependent-Output) 0.001**
Constant 0.912 0.104 0.000***
Employee Number (Input) 0.271
Debt Ratio (Input) 0.898
Liquidity (Input) 0.131
Available Seat Kilometer (Input) 2.44E-06 0.000 0.001***
Fleet Size (Input) 0.220
Reduced Model 4
PAX (Dependent-Output) 0.039**
Constant 1.090 0.229 0.000***
Employee Number (Input) 8.92E-06 0.000 0.064*
Debt Ratio (Input) 0.127
Liquidity (Input) 0.174 0.073 0.022**
Available Seat Kilometer (Input) 0.688
Fleet Size (Input) 0.001 0.001 0.071*
* Significant at the 0.10 level (2-tailed). ** Significant at the 0.05 level (2-tailed). *** Significant at the 0.01 level (2-tailed).
acts as a role model to other influential airline companies, then it is more likely to exert influence through them. An airline company with high eigenvector centrality is connected to many other nodes that are themselves well-connected. Because of their connectedness to other well-connected airline companies, such companies are expected to be influential nodes in the network.
After the calculation of eigenvector centrality, the superefficient airline companies are ranked in a more robust way by multiplying their superefficiency score coming from the superefficient DEA model by their corresponding normalized eigenvector centrality value obtained in the previous step. The process is repeated for each reduced model except reduced model 3, where the efficient airline company was already reduced to one. Additionally, the network-based eigenvector concept
suggested by Liu and Lu, 2010 is also used to develop a performance map
to point out strengths and weaknesses of the ranked superefficient airline companies. Relative strengths and weaknesses of the supereffi-cient airline companies cross-organizations and within-organization can be calculated by the following formulas (2–9):
Step 1: Transform all DEA results into a directed and weighted
network where each node represents a DMU (airline company) and the link between a pair of node represents the referencing
relation-ship between the pair. The corresponding lambda value, λjk gives
information about the endorsement of inefficient airline to the effi-cient airline. For example, if an airlinej is an exemplar of airline k and
the corresponding lambda value, λjkpointing from nodekto node j can
be generated.
Step 2: Calculate efficiency scores of all airlines using Super-SBM-I-C
model. The value of λt
jk indicates the contribution of the ith input of
Table 5
Airline Companies’ efficiency scores according to the Reduced Models. Rank Reduced Model
1 Reduced Model 2 Reduced Model 3 Reduced Model 4 1 Norwegian
(2.042) Norwegian (2.270) Vietnam Airlines (1.062) Thai Airways (4.280) 2 Bangkok
Airways (1.236)
Aegean Airlines
(1.431) Aeromexico (0.940) Delta Air Lines (1.254) 3 Vietnam
Airlines (1.124) Bangkok Airways (1.117) TAP Air Portugal (0.876) easyJet (1.209) 4 Aegean Airlines
(1.122) China Eastern (1.114) Bangkok Airways (0.083)
Asiana Airlines (1.125) 5 Aeromexico
(1.112) Aeromexico (1.097) Aegean Airlines (0.031) Southwest Airlines (0.833) 6 United Airlines
(1.088) TAP Air Portugal (1.080)
Icelandair
(0.027) China Eastern (0.829) 7 Icelandair
(1.077) Icelandair (1.071) Hawaiian Airlines (0.020) Norwegian (0.811) 8 Delta Air Lines
(1.077) United Airlines (1.046) Copa Airlines (0.017) China Southern (0.779) 9 Alaska Airlines
(1.052) South African Airways (1.004)
Finnair (0.011) Hainan Airlines (0.732) 10 China Eastern
(1.031) Vietnam Airlines (0.926) Air New Zealand (0.010) American Airlines (0.727) 11 Copa Airlines
(1.017) Hawaiian Airlines (0.877) Asiana Airlines (0.010) Air China (0.695) 12 Hawaiian
Airlines (0.903) Avianca (0.679) EVA Air (0.010) Turkish Airlines (0.669) 13 Japan Airlines
(0.825) Copa Airlines (0.676) China Airlines (0.009) Qantas Airways (0.649) 14 Air China
(0.659) Jet Airways (0.659) Garuda Indonesia (0.008)
Emirates (0.638) 15 Air New
Zealand (0.590) Alaska Airlines (0.642) Alaska Airlines (0.008) KLM (0.626) 16 China Southern
(0.587) China Airlines (0.638) South African Airways (0.008)
Air France (0.626) 17 easyJet (0.580) Air China
(0.635) Avianca (0.008) Lufthansa (0.577) 18 TAP Air Portugal (0.577) SAS Scandinavian (0.621) Virgin Australia (0.008) Jet Airways (0.541) 19 Southwest
Airlines (0.548) Garuda Indonesia (0.609) SAS Scandinavian (0.007) Korean Air (0.515) 20 British Airways
(0.503) Asiana Airlines (0.599) Korean Air (0.006) Garuda Indonesia (0.508) 21 Hainan Airlines
(0.473) Virgin Australia (0.594) Norwegian (0.006) SAS Scandinavian (0.490) 22 Jet Airways
(0.460) Air New Zealand (0.581) Jet Airways (0.005) British Airways (0.457) 23 Qantas Airways
(0.439) Finnair (0.569) Japan Airlines (0.005) Aeroflot (0.451) 24 SAS
Scandinavian (0.426)
China Southern
(0.561) Hainan Airlines (0.005) Avianca (0.444) 25 Aeroflot
(0.420) Korean Air (0.526) Thai Airways (0.005) Vietnam Airlines (0.443) 26 Asiana Airlines
(0.417) Thai Airways (0.486) easyJet (0.004) Cathay Pacific (0.430) 27 Air Canada
(0.406) Qantas Airways (0.445) ANA All Nippon Airways (0.004)
Virgin Australia (0.423) 28 Finnair (0.397) EVA Air (0.444) Air Canada
(0.003) ANA All Nippon Airways (0.404) 29 ANA All Nippon
Airways (0.346)
Japan Airlines
(0.392) Singapore Airlines (0.003) Air Canada (0.404)
Table 5 (continued) Rank Reduced Model
1 Reduced Model 2 Reduced Model 3 Reduced Model 4 30 American
Airlines (0.318) easyJet (0.387) Cathay Pacific (0.003) Alaska Airlines (0.382) 31 Avianca
(0.315) Delta Air Lines (0.383) Qantas Airways (0.002) Aegean Airlines (0.380) 32 EVA Air (0.293) Aeroflot
(0.363) Aeroflot (0.002) Japan Airlines (0.366) 33 Lufthansa
(0.286) Singapore Airlines (0.345) Southwest Airlines (0.002) Hawaiian Airlines (0.353) 34 China Airlines
(0.284) Southwest Airlines (0.344) Turkish Airlines (0.002) TAP Air Portugal (0.324) 35 Thai Airways
(0.273) ANA All Nippon Airways (0.332) China Southern (0.002) Singapore Airlines (0.314) 36 Garuda Indonesia (0.272) Turkish Airlines
(0.321) British Airways (0.001) Air New Zealand (0.311) 37 Singapore
Airlines (0.261) Air Canada (0.315) Lufthansa (0.001) Finnair (0.302) 38 KLM (0.229) Cathay Pacific
(0.295) China Eastern (0.001) Bangkok Airways (0.279) 39 Air France
(0.229) British Airways (0.289) KLM (0.001) Copa Airlines (0.264) 40 Emirates
(0.182) Air France (0.286) Delta Air Lines (0.001) South African Airways (0.230) 41 Turkish Airlines
(0.176) KLM (0.286) Air France (0.001) Icelandair (0.222) 42 Cathay Pacific
(0.170) Hainan Airlines (0.271) Air China (0.001) EVA Air (0.221) 43 Virgin Australia
(0.072) Lufthansa (0.266) Emirates (0.001) United Airlines (0.205) 44 Korean Air
(0.068) American Airlines (0.258) United Airlines (0.000) Aeromexico (0.198) 45 South African
Airways (0.052)
Emirates
the kth airline to the jthairline in the reference set under DEA spec-ification t.
Step 3: Normalize the lambda value. The contribution of the ith input
of the kth airline to the jthairline in the reference set under DEA specification t can be rescaled as follows:
IWt;k ij ¼ λt jkxtij P j2Eλ t jkxtij ;0 < IWt;k ij �1: (2)
Similarly, the contribution of the rth output of the kth airline to the
jthairline in the reference set under DEA specification t can be rescaled as
follows: OWt;k rj ¼ λt jkytrj P j2Eλ t jkytrj ;0 < OWt;k rj �1: (3)
In the reference set under DEA specification t, the overall contribu-tion of the kth airline to the jthairline can be computed as follows:
IOWt jk¼ 1 ðm þ sÞ Xm i¼1 IWt;k ij þ Xs r¼1 OWt;k rj ! (4)
Step 4: Aggregate results of all DEA specifications onto one network
to obtain the following adjacency matrix A:
A ¼ " Xw t¼1 IOWt jk # (5) where A is a square matrix of order n and w is the total number of DEA
specifications w ¼ ð2m 1Þð2s 1Þ.
Step 5: Calculate the eigenvector centrality value for each network
node (airline).
Step 6: Rank airlines according to obtained eigenvector centrality
value (in Step 5) in descending order.
*Sensitivity of the airline performance to individual input and
output variables. Ranking the airline companies under each input or output variable. A ¼ 1 m þ s Xm i¼1 AIiþ Xs r¼1 AOr ! ; (6) where, AIi¼ " Xw t¼1 IWt;k ij # ;i ¼ 1; 2; …; m; AOr¼ " Xw t¼1 OWt;krj # ;r ¼ 1; 2; …; s: (7)
In this formulation, AIi and AOi are square matrices of order n: Each
entry in these matrices denote the aggregated endorsement of the kth airline to the jth airline in the reference set through the ith input, and the endorsement of the kthairline to the jth airline in the reference set through the rth output, respectively. AIi and AOi can be treated as
network adjacency matrices and airlines can be ranked in descending order according to obtained eigenvector centrality value under each input or output variable.
*Within organization strengths and weaknesses among all var-iables for an airline:
The endorsement from all peers over all specifications to an efficient airline j through a specific input/output p can be calculated as follows:
IOWSp j¼ 8 > > > > < > > > > : Xn k¼1 Xw t¼1 IWt;kij; p ¼ i; i ¼ 1; 2; …; m; ve Xn k¼1 Xw t¼1 OWt;k rj;p ¼ m þ r; r ¼ 1; 2; …; s: 9 > > > > = > > > > ; (8)
where p is a consolidated input/output index. The relative importance of each input/output factor p to an efficient airline equals:
IOp j¼ IOWSp j �2 P mþs p¼1 IOWSp j �2 (9) Table 6
Ranking of the Efficient Airline Companies and their Strengths and Weaknesses for the Reduced Model 1 (Output: NPM). Super-
SBM-I-C Rank
Superefficiency
Score Eigenvector centrality value (Weight)
Normalized
Weights Superefficiency score weighted by eigenvector centrality
Rank of airlines based on superefficiency score weighted by eigenvector centrality(5)
Strengths Weaknesses
(1) (2) (3) (4)¼(3)/SUM
(3)) (5)¼(2)*(4) (6) (7) (8)
3 1.124 0.260 0.167 0.527 Vietnam Airlines ASK (0.524),
Liquidity (0.462) Debt (0.015)
7 1.077 0.218 0.167 0.505 Icelandair ASK (0.450), Debt
(0.450)
11 1.017 0.066 0.168 0.479 Copa Airlines ASK (0.348), Debt
(0.305), Liquidity (0.348)
10 1.031 0.471 0.136 0.394 China Eastern ASK (0.001)
5 1.112 0.468 0.092 0.289 Aeromexico ASK (0.968) Debt (0.022),
Liquidity (0.011)
1 2.042 0.382 0.046 0.264 Norwegian Liquidity (0.353)
9 1.052 0.209 0.078 0.230 Alaska Airlines ASK (0.483),
Liquidity (0.483) Debt (0.034)
8 1.077 0.116 0.074 0.225 Delta Airlines Liquidity (0.555)
4 1.122 0.129 0.041 0.130 Aegean Airlines ASK (0.5), Debt
(0.500) Liquidity (0.000)
2 1.236 0.021 0.024 0.082 Bangkok Airways ASK (0.499), Debt
(0.499) Liquidity (0.002)
6 1.088 0.469 0.008 0.023 United Airlines Debt (0.985) ASK (0.007),
Liquidity (0.008) Strengths and Weaknesses columns represents the factors with IOj
Here, IOp
jis calculated to indicate the relative importance of each input
factor pamong all inputs within an efficient airline company. Input factors with values greater than or equal to 0.2 are labeled as strengths, while values less than or equal to 0.05 are labeled as weaknesses.
This analysis identifies the airline companies that are particularly efficient in certain input/output factors relative to other airline com-panies. Identifying strengths and weakness provides managerial insights to airline companies, since it highlights the areas where each airline company needs to improve and should make investments. This is the same as detecting the sensitivity of the airline company’s performance to individual input and output factors. This tends to screen out
specialized efficient organizations, or in other words, it favors airline organizations that have their strengths evenly spread.
In this study, a total of 22 DEA models are run with all input/output combinations (7 for reduced model 1, 7 for reduced model 2, 1 for reduced model 3, and 7 for reduced model 4). By applying the steps (1–5) to each reduced model, adjacent matrices are constructed to calculate eigenvector centrality values and, hence, to determine the importance of each efficient airline in the network for different output scenarios. Next, by employing formulas (6–9), strong and weak factors among all inputs for each output scenario are determined. Identification of strengths and weaknesses within an airline company provides a
Table 7
Ranking of the Efficient Airline Companies and their Strengths and Weaknesses for Reduced Model 2 (Output: OTP). Super-
SBM-I-C Rank
Superefficiency
Score Eigenvector centrality value (Weight)
Normalized
Weights Superefficiency score weighted by eigenvector centrality
Rank of airlines based on superefficiency score weighted by eigenvector centrality(5)
Strengths Weaknesses
(1) (2) (3) (4)¼(3)/SUM
(3)) (5)¼(2)*(4) (6) (7) (8)
1 2.270 0.460 0.187 0.426 Norwegian Liquidity (0.386)
4 1.114 0.461 0.188 0.209 China Eastern Liquidity (0.972) ASK (0.013),
Debt (0.013)
2 1.143 0.353 0.144 0.206 Aegean Airlines ASK (0.497), Debt
(0.497) Liquidity (0.005)
6 1.080 0.462 0.189 0.203 TAP Air Portugal ASK (0.698),
Liquidity (0.296) Debt (0.004)
8 1.046 0.462 0.189 0.197 United Airlines Debt (0.983) Ask (0.008),
Liquidity (0.008)
7 1.071 0.125 0.051 0.054 Icelandair ASK (0.347), Debt
(0.347), Liquidity (0.304)
9 1.004 0.065 0.026 0.026 South African Airways ASK (0.500),
Liquidity (0.500) Debt (0.000)
5 1.097 0.049 0.020 0.021 Aeromexico ASK (0.626), Debt
(0.328) Liquidity (0.004)
3 1.117 0.011 0.004 0.005 Bangkok Airways ASK (0.500), Debt
(0.500) Liquidity (0.002) Strengths and Weaknesses columns represents the factors with IOjp greater than or equal to 0.2 (strengths) and less or equal to 0.05 (weaknesses) (Liu and Lu, 2010). Table 8
Efficiency scores, ranks, strengths and weaknesses for the reduced model 3 (output: OCSS). Super-SBM-I-
C Rank Superefficiency Score Eigenvector centrality value (Weight) Normalized Weights Superefficiency score weighted by eigenvector centrality Rank of Airlines based on Superefficiency score weighted by eigenvector centrality
(1) (2) (3) (4)¼(3)/SUM
(3)) (5)¼(2)*(4)
1 1.062 1 1 1.062 Vietnam Airlines
Table 9
Ranking of the Efficient Airline Companies and their Strengths and Weaknesses for Reduced Model 4 (Output PAX). Super-
SBM-I-C Ran k
Superefficiency
Score Eigenvector centrality value (Weight)
Normalized
Weights Superefficiency score weighted by eigenvector centrality
Rank of airlines based on superefficiency score weighted by eigenvector centrality(5)
Strengths Weaknesses
(1) (2) (3) (4)¼(3)/SUM
(3)) (5)¼(2)*(4) (6) (7) (8)
1 4.280 0.528 0.269 1.152 Thai Airways Employee (1.935),
Fleet (0.583) -
2 1.254 0.600 0.305 0.383 Delta Air Lines Employee (0.463),
Fleet (0.439), Liquidity (2.205)
-
3 1.125 0.492 0.250 0.282 Asiana Airlines Employee (0.254),
Fleet (2.529), Liquidity (1.813)
-
4 1.209 0.342 0.174 0.174 Easy Jet Employee (2.851),
Fleet (1.556), Liquidity (2.113)
-
roadmap for their improvement. Tables 6–9 presents the rankings of efficient airline companies according to obtained eigenvector centrality values and their strengths and weaknesses within the company for each output scenario in the reduced DEA model.
When Net Profit Margin (NPM) is taken as an output according to the superefficient model, the most superefficient company is Norwegian Airlines (column 1) with its superefficiency value of 2.043. However, it is not the role model endorsed by the most influential airline companies.
Fig. 2 shows the role model companies for reduced model 1 at the center. Because its eigenvector centrality value is low (0.382), when the NPM is selected as output, Norwegian Airlines becomes the sixth most
efficient airline in terms of its weighted super efficiency value (0.264). That is, why, with its high eigenvector centrality, the weighted super-efficiency value (0.527) of Vietnam Airlines makes it a leader in terms of NPM. This company has the power to connect with many other influ-ential airline companies outside its immediate connections. In organi-zational risk terms, it has the ability to form a social elite within the group, building norms and expectations that others in the group will relate to. Vietnam Airlines can improve its debt ratio, its basic strengths are liquidity and available seat kilometers (ASK), while Norwegian
Airlines especially outperforms on liquidity (see Table 6). This outcome
also shows us that the network-based approach proposed by Liu and Lu,
Fig. 2. Reference network of airline companies with respect to Reduced Model 1 (Output: NPM). (The network is plotted with Pajek software using the Kamada- Kawai energy layout option).
Fig. 3. Reference network of airline companies with respect to Reduced Model 2 (Output:OTP). (The network is plotted with Pajek software using the Kamada-Kawai energy layout option).
2010 favors organizations that have their strengths evenly spread and tends to screen out specialized efficient organizations.
On the other hand, when On-Time Departure Performance (OTP) is taken as an output, the most superefficient airline is Norwegian Airlines (2.2704) because it has a superefficiency much higher than the rest of the efficient airlines and, hence, has the top superefficiency score
weighted by eigenvectorcentrality (see Table 7).
Fig. 3 shows that the eigenvector centrality of United Airlines (0.4624) is the highest. However, because its eigenvector centrality value is also high (0.4603), Norwegian Airline has the highest weighted superefficiency value (0.4266), and this makes it the leader with respect to the OTP dimension.
The greatest strength of Norwegian Airlines is its liquidity and it has no weakness. It influences many other airline companies that are themselves well-connected. The other superefficient airline companies still have some relative weaknesses, such as debt, liquidity and available seat kilometers (ASK). They should take Norwegian Airlines as a role model in these factors.
Because the superefficiency DEA was able to reduce the number of superefficient airline companies to one for reduced model 3, it can be seen that Vietnam Airlines is the leader in terms of overall customer satisfaction and should serve as a dominant role model for the other
companies (see Table 8).
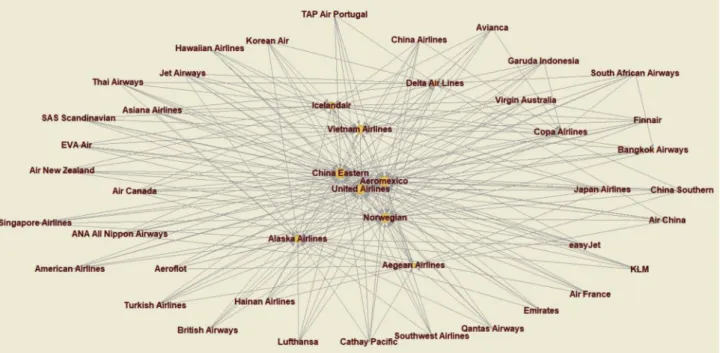
Finally, when the efficiency of airline companies is analyzed with respect to passengers carried (PAX), we can see that Thai Airways is the
leader in terms of eigenvector centrality (Fig. 4), superefficiency and
weighted superefficiency values, and its basic strengths are its fleet and
employees (see Table 9).
Fig. 4 shows the airline companies with the highest eigenvector centrality values for reduced model 4 at the center.
To sum up, in Figs. 2–4 efficient airlines which play a role model for
the other airlines with respect to each considered output are located at the inner periphery of the network. Size of the related nodes in these figures also provide information about the degree of influence, in terms of Eigenvector centrality. For instance, in Fig. 4, Thai Airways, Delta Air Lines, Asiana Airlines and easyJet are located at the inner cluster since they have the highest eigenvector centrality with respect to output, “PAX”, based on the reference network analysis. Therefore, they should act as role models to the other airlines when we consider output “PAX”.
Moreover, Tables 6–9 provide information about within organization
strengths and weaknesses of each efficient airline. These tables present only the input factors with greater than or equal to 0.2 (strengths) and
less than or equal to 0.05 (weaknesses) due to approach suggested by Liu
and Lu (2010). Related to Fig. 4, Table 9 present within organization strengths of these efficient airlines since no weaknesses are observed. To sum up, the strength/weakness of an efficient airline with respect to a certain input exactly varies from one output to another as we can see in
Tables 6–9
3.2.5. Phase V: aggregation
At the final stage, a pairwise comparison of the four outputs is made by 7 experts from different departments of the airline companies to reflect different perspectives. The relative priorities based on
eigen-vectors are shown in Table 10 for both the individual evaluations and
the group decision (geometric means).
According to the relative priorities calculated in Table 10, financial
performance output “Net Profit Margin (NPM)” has the highest priority (0.383), followed by operational performance output “On-time Depar-ture (OTP)” (0.286) and marketing performance output “Overall Customer Satisfaction (OCSS)” (0.273), while passengers carried is
Fig. 4. Reference network of airline companies with respect to Reduced Model 4 (Output:PAX). (The network is plotted with Pajek software using the Kamada-Kawai energy layout option.)
Table 10
Output weights obtained by eigenvectors.
Expert 1 Expert 2 Expert 3 Expert 4 Expert 5 Expert 6 Expert 7 Geometric Mean
NPM 0.3182 0.3125 0.4657 0.4464 0.3076 0.3866 0.4578 0.3791
OTP 0.3182 0.3125 0.2947 0.2373 0.3268 0.3143 0.2074 0.2838
OCSS 0.3220 0.3177 0.1893 0.2250 0.3306 0.2514 0.2921 0.2704
![Ambrosius Aurelianus [called Emrys Wledig] (fl. 5th cent.), military leader](data:image/gif;base64,R0lGODlhAQABAIAAAP///wAAACH5BAEAAAAALAAAAAABAAEAAAICRAEAOw==)