15
th
ISEOS
PROCEEDINGS BOOK
15th International Symposium on Econometrics, Operations Research and Statistics 22-25 May 2014 Suleyman Demirel University
MACROECONOMIC DETERMINANTS OF MERGER AND ACQUISITIONS IN TURKEY:AN ARDL BASED COINTEGRATION APPROACH
Doç.Dr. Özlem TaĢseven1 Abstract
This study is an empirical investigation of the relationship between the value of merger and acquisitions, gross domestic product, real exchange rate, openness of the economy and the wage index measured as the hourly real wage index in the manufacturing industry.For estimation ADF (Augmented Dickey Fuller) unit root test, ARDL based co-integation tests and error correction analyses have been undertaken. The existence of cointegration among the variables are tested by the bounds tests developed by Pesaran and Shin (1999) and Pesaran, Shin and Smith (2001). The results of the bound tests (Pesaran et al. 2001) suggest that there is a cointegration between the variables ofmerger and acquisitions, gross domestic product, real exchange rate, wages and openness of the economy variables. It is found that the gross domestic product, real exchange rate and openness of the economy affect merger and acquisitions positively, whereas wages has a negative effect.
JEL Codes: C32, C13, L21, L22, L29
Keywords: Merger & Acquisitions,Turkish Economy, Macroeconomic Variables
TÜRKĠYE‘DE ġĠRKET BĠRLEġME VE SATIN ALMALARININ BELĠRLEYENLERĠ: ARDL TABANLI KO-ĠNTEGRASYON YAKLAġIMI
Özet
Bu çalıĢma Ģirket birleĢme ve satın almalarının değeri, gayri safi milli hasıla, reel kur, ekonominin dıĢa açıklığı ve imalat sanayinde geçerli olan saatlik ücret değiĢkenleri arasındaki iliĢkiyi analiz etmektedir. Tahmin amaçlı olarak ADF (DüzeltilmiĢ Dickey Fuller) birim kök testi ve ARDL tabanlı ko-integrasyon ve hata düzeltme analizleri yapılmıĢtır. Pesaran & Shin (1999) ve Pesaran, Shin & Smith (2001) tarafından geliĢtirilen sınır testi yaklaĢımı ile değiĢkenler arasında ko-integrasyon olup olmadığı test edilmiĢtir. Sınır testinin sonuçlarına göre Ģirket birleĢme ve satın almalarının değeri, gayri safi milli hasıla, reel kur, ekonominin dıĢa açıklığı ve ücret değiĢkenleri arasında ko-integrasyon bulunmuĢtur. Gayri safi milli hasıla, reel kur, ekonominin dıĢa açıklığı değiĢkenleri Ģirket birleĢme ve satın almalarının değerini pozitif olarak, ücret değiĢkenin ise negatif olarak etkilediği bulunmuĢtur.
JEL Kodları:C32, C13, L21, L22, L29
Anahtar Kelimeler:Şirket Birleşme ve Satın Almaları, Türkiye Ekonomisi, Makroekonomik Değişkenler
1. INTRODUCTION
As the world‘s economies become increasingly integrated, mergers and acquisitions are likely to become even more important.In recent years, mergers and acquisitions (M&As) have become a preferred form of foreign direct investment (FDI) by multinational firms in developed and developing countries. In the process, most M&As have become a crucial component of economic growth with potentially more jobs, transfer of new technology and managerial expertise for developing nations. To understand the economic development process, a better understanding of the M&A activities is needed.
Financial development, the size of market, infrastructural development are seen as the factors in attracting FDI. Various macroeconomic factors such as economic growth, inflation, openness and natural
resources are the factors which motivated M & A activities. Kiymaz (2004) mentions that the motivations for M& A activities include changes in government policy and regulation, the increase in the level of economic integration and volume of international trade, undervaluation of institutions and the existence of strong financial markets so that M&As activities can be financed.
Overall M&A activities follow a cyclical nature, the total number of worldwide M&As has been increasing recently at a rapid rate. This can be due to the dynamic nature of international trade. The consolidations of industries and regions have also contributed to the overall number and value of M&As to continuously increase. Shimizu et al. (2004) argue that the increasing globalization of business has provided the opportunities to engage in M&As. The motivation behind M& As involve unique challenges, as countries have different economic, institutional and cultural structures. Dunning (1993)
states that economic perspectives ownership-location-internalization (OLI) theory forms the bases of determinants of M&A activities.
In this paper we will investigate the explanatory power of macro variables, such as gross domestic product, exchange rates, wages and the degree of openness, on the dollar volume of merger and acquisitions both in the long and short run, using bounds testing co-integration approach. In this paper section two provides a brief overview of the literature on merge and acquisitions. Section three presents data source and empirical analysis undertaken in the paper. The last section of the paper briefs our conclusion.
2. ANOVERVIEW OF THE EXISTING LITERATURE ON M&A
Recently one of the most important development on the way to globalization has been the significance of FDI around the world. One of the main components of FDI is considered as M&A activities, the other one is greenfield investment. The analysis of merger and acquisitions form a macroeconomic point of view is important. Several studies investigated the relationship between the M&As and macro factors. Kiymaz (2004) states that macroeconomic factors such as domestic and foreign economic conditions and exchange rate volatility play a significant role in explaining M&A activities. There have been studies that attempt to understanding of the relationship between merger activity and macroeconomic fundamentals in the M&A literature. Erel (2012), Kiymaz (2004), Shimizu et al. (2004), Erdogan (2012), Wang (2008) investigate the relationship between M&A activities and macroeconomic factors.
Dunning (1981) sets a theoretical foundation for M&A activities. According to Dunning international production is a function of a combination of three categories of factors: ownership advantages (O), locational advantages (L) and internalisation advantages (I), referred to as the OLI advantages. Dunning (2001) defines ownership advantages as ―any kind of income generating asset that allows firms to engage in foreign production. Market internalisation advantages (I) ―relate to the way firms organise the generation and use of resources and capabilities‖. Location advantages are external to the firm and include the cultural, legal, political and institutional environment, government legislation and policies. Dunning emphasizes that the way OLI advantages combine to create competitive advantage for firms, varies across industries, countries and regions. It is important to identify the set of advantages that give a specific industry, country or region its competitive advantages.
Kiymaz (2004) investigates the impact of mergers and acquisitions on US bidders and targets involved in cross-border mergers of financial institutions. It is found that US targets obtain significant wealth gains, however US bidders experience insignificant wealth gains. Also it is found that location plays an important role in terms of wealth gains. When the wealth gains are examined according to the industry affiliation US depository/non-depository institutions and insurance firms are found to experience the greatest wealth gains when they are the target of a foreign acquirer.
EREL et al. (2012) analyze the motivation for cross border mergers; stating that about one third of worldwide mergers combine firms from two different countries. Therefore, they concentrate on cross border mergers instead of domestic mergers. They analyze a sample of 56,978 cross-border mergers between 1990 and 2007.
They find that geography, the quality of accounting disclosure, and bilateral trade increase the likelihood of mergers between two countries. Geography is important since the probability of acquiring a firm in a nearby country is higher than the probability of acquiring a firm in a country far away. Higher economic development and better accounting quality are factors which increase the probability of mergers. They state that mergers are likely to occur between firms of countries that trade more commonly with one another, because they have similar synergies and also a common cultural background. Country-level factors, such as currency appreciation and macroeconomic performance are also found to attract acquiring firms. Valuation is found to be motivating mergers: firms in countries whose stock market has increased in value and that have a relatively high market-to-book value tend to be purchased.
Shimizu et al. (2004) states that M&As have been motivated by the search for new firms across different geographic locations and markets in a changing environment. Shimizu et al. summarize that the choice of M&A as a mode of entry into a foreign market is affected by (1) firm-level factors such as multinational
experience, local experience, product diversity and international strategy (2) industry-level factors such as technological intensity, advertising intensity and sales force intensity and (3) country-level factors such as market growth in the host country, cultural similarities between the home and host countries, and the specific culture of the acquiring firm‘s home country.
Erdogan (2012) examines the financial determinants of merger and acquisition targets in Turkey. Cox regression with segmented time-dependent covariates is conducted using 500 industrial firms. Time-dependent covariates on 37 merged and acquired firms and 173 non-merged and non-acquired firms for the period 2004-2010 are investigated. Financial data of the firms such as pretax profit margin, return on equity, capital productivity, labor productivity, size, capital intensity, export intensity and debt ratio are used. Erdogan found that a lower pretax profit margin is related with an increased chance of being a merger or an acquisition target. The lower the debt ratio, the more likely the firm will be a target for a merger or an acquisition.
Wang (2008) investigates the macroeconomic factors that may affect the corporate acquisition, and finds that economic growth, interest rates, money supply and exchange rates affect the number of China‘s mergers and acquisitions significantly. Stock market and economy freedom variables are found to be insignificant. Wang argues that money supply shortage shows monetary tightening, and it makes Chinese SMEs more difficult to obtain bank loans, and therefore the probability of M & A increases. Also, as China lowers interest rates, the cost of mergers and acquisitions decrease, therefore M&A increases.
3. DATA SOURCE AND EMPIRICAL ANALYSES 3.1. The Methodology
In our analysis we employed the Autoregressive Distributed Lag (ARDL) method initially used by Pesaran and Shin (1999) to test the existence of cointegration among the variables of interest. Co-integration concept is based on the long term relationship between the non-stationary time series with limited divergence. If there is a strong relationship between the time series data, we expect them to fluctuate together. Otherwise, the series, Yt, X2t, …., Xkt could drift apart indefinitely. If the model (Yt=β1+β2X2t+…+.βkXkt+ ut) is correct, there will be a limit to short run divergences. Even though the time series are non stationary, the error term ut = Yt - β1- β2X2t-…-βkXkt will be stationary. The test for cointegration can be achieved with Augmented Dickey-Fuller (ADF) unit root test.
We use ARDL model because this model allows estimating both short-run and long-run coefficients. ARDL model has an advantage compared to other cointegration techniques because it is free from the assumption of same integration degree of as I(1) in cointegrating series (Pesaran et al.2001). The bounds testing approach of Pesaran et al. (2001) can be used when the variables are either stationary or integrated of order one. In other words, bounds testing cannot be applied if the order of integration for variables is two or higher.
3.2. Data Set and the Model Used in the Analyses
Using a functional representation, the merger and acquisitions equation of our interest in this paper can be indicated as in Eq. 1 below.
mer = f(gdp, exc, wages, openness) (1) Based on the literature the determinants of the value of merger and acquisitions are selected as gross domestic product, real exchange rate, wages and openness of the economy. Thedata set used in the analyses is quarterly and covers the period from 1995Q1 to 2011Q1 of Turkish time series.
The variable to be explained is the value of merger and acquisitions. The data are obtained from Zephyr database. The value of merger and acquisitions are measured in million U.S. dollars. The series are converted into Turkish lira using 3 months average of USD nominal exchange rate. The exchange rate data are obtained from the electronic data delivery system of the Central Bank of the Republic of Turkey (CBRT). The series are represented as mer in the empirical models.
The first explanatory variable is gross domestic productwhich is obtained from the electronic data delivery system of the Central Bank of the Republic of Turkey. The real gdp with 2003 prices are taken. The series are represented as gdp in the empirical models.
The second explanatory variable used in estimations is the real exchange rate. CPI based real effective exchange rate (1995=100) is used to represent the data. Source of data is the Central Bank and it is the 3 month average of monthly data. CPI based real effective exchange rate index is calculated using the IMF weights for 19 countries including Germany, USA, Italy, France, United Kingdom, Japan, Netherlands, Belgium, Switzerland, Austria, Spain, Canada, Korea, Sweden, Taiwan, Iran, Brazil, China and Greece. The series are measured in logs and represented as exc in the models. Moreover, an increase in this variable represents appreciation.
The third explanatory variable which is the key variable of interest for this analysis is the openness of the economy. The series is calculated as [(exports + imports) /GDP], where GDP data represent gross domestic product, exports and imports are measured in million U.S. dollars. Exports and imports series are converted into Turkish lira using 3 months average of USD nominal exchange rate. Exports and imports are obtained from the electronic data delivery system of the Central Bank of the Republic of Turkey. The series are represented as openness in the empirical models.
The fourth explanatory variable is the wage index measured as the hourly real wage index in the manufacturing industry. Source of data is the Turkish Statistic Institute, work statistics. The series are represented as wages in the models. All the series except openness are measured in logarithms.
3.3. Unit Root Tests
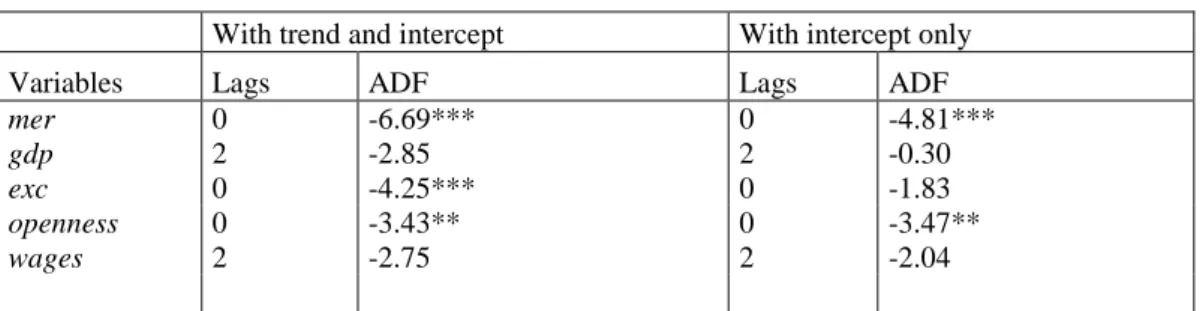
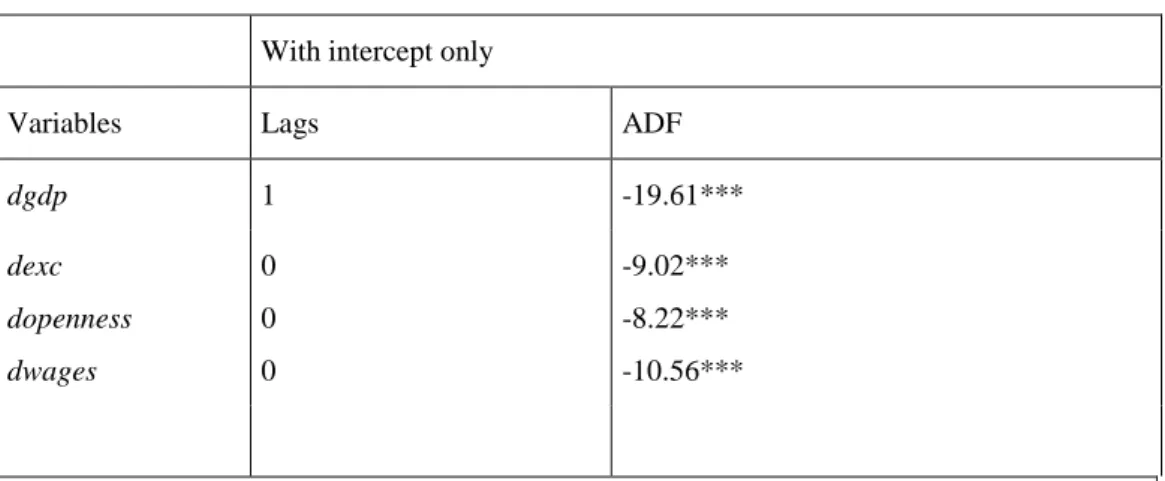
The bounds testing approach of Pesaran et al. (2001) can be used if the variables are either stationary or integrated of order one. In other words, bounds testing cannot be applied if the order of integration for variables is two or higher. In order to determine the order of integration, Augmented Dickey Fuller (ADF) and KPSS tests are applied to the levels and the first differences. The numbers in parentheses are the lags used for the ADF test, which are augmented up to a maximum of 5 lags. The choice of optimum lag for the ADF test was decided on the basis of minimizing the Schwarz information criterion. The letter ‗d‘ shows that the variable is differenced once. The ADF test results are given in tables 1 and 2.
Table 1. ADF test results for levels of variables
With trend and intercept With intercept only
Variables Lags ADF Lags ADF
mer gdp exc 0 2 0 -6.69*** -2.85 -4.25*** 0 2 0 -4.81*** -0.30 -1.83 openness wages 0 2 -3.43** -2.75 0 2 -3.47** -2.04
Note: The critical values for the models with trend and intercept are -4.09, -3.47 and -3.16 for confidence levels of 99 percent, 95 percent and 90 percent respectively. The critical values with intercept only are -3.52, -2.90, and -2.58 for confidence levels of 99 percent, 95 percent and 90 percent respectively. Rejection of null hypothesis is shown with * for 90 percent, ** for 95 percent and *** for 99 percent confidence levels.
The test results suggest that the null hypothesis of a unit root can be rejected for mer and openness with intercept and trend case. As can be seen from Table 1, null hypothesis of a unit root can be rejected for
mer, exc and openness with intercept only case. The results show that unit root hypothesis cannot be
rejected for gdp, exc and wages with intercept only case only. Mer and openness are found to be trend stationary at 99 and 95 percent confidence level consequently. When table 2 is examined, all variables except mer and openness are found to be stationary when their first differences are taken.
Table 2. ADF test results for first difference of variables
With intercept only
Variables Lags ADF
dgdp 1 -19.61*** dexc dopenness dwages 0 0 0 -9.02*** -8.22*** -10.56***
Note: The critical values for the models with intercept only are -3.53, -2.90, and -2.58 for confidence levels of 99 percent, 95 percent and 90 percent respectively. Rejection of null hypothesis is shown with * for 90 percent, ** for 95 percent and *** for 99 percent confidence levels.
3.4. ARDL Model Results
Since the order of integration of variables are determined in the previous section, we can move on to determine the existence of long run relationship between variables. Engle and Granger (1987) co-integration method determines whether there is one co-integrating vector between the variables or not. It does not consider the existence of more than one co-integrating vector. This method can be considered as a very restricted version of co-integration tests. On the other hand widely popular maximum likelihood based Johansen (1988; 1995) and Johansen and Juselius (1990) multivariate co-integration test can be used to test whether there exists a long run equilibrium between variables provided that the variables of interest are found to be integrated of same order.
In section 3.2 we find that the variables of interest have different orders of integration. Therefore, we cannot apply either Engle and Granger (1987) or Johansen (1995) co-integration methods. In this paper, in order to test the existence of cointegration among the variables, bounds testing approaches developed by Pesaran and Shin (1999) and Pesaran, Shin and Smith (2001) are used. The reason for selecting this approach is that this co-integration method allows for different orders of integration of variables. Particularly, it allows the variables to be stationary, integrated order one or a combination of both. Moreover, as illustrated by Pesaran et al. (2001), bounds testing for cointegration is followed by an analysis of an autoregressive distributed lag model (ARDL) based on Pesaran and Shin (1999). This model allows examining both the short run and long run dynamics. Autoregressive distributed lag bounds testing procedures, can allow us to consider our I(0) and I(1) variables together in a co-integrating equation, in our empirical analysis of the Turkish trade balance ratio. Let us consider the vector error correction model in Eq. (1):
∆Yt = µ + λYt-1 +
1 -p 1 j
jY
t-j+ εt (2)In Eq. (2), Yt= [yt xt]‘ is defined as the variable vector in which ytrepresents the endogeneous variable tbalt, that is, the trade balance ratio and xtrepresents the explanatory variables which are assumed
affecting the trade balance ratio which includes short term capital inflows ratio, reel exchange rate, ise 100 index and deposit rates. We can write the possible co-integration relationship as follows:
Δlnyt = α + φyt-1 + δxt-1 + ωΔxt +
p-1 1 j
P, jΔyt-j +
1 -q 1 j
x,jΔxt-j + ut (3)In Eq. (3), φand δare the long run multiplier coefficients, while Δyt-j and Δxt-j express the short run
dynamic structure of our error correction model. The bounds testing approach requires the ordinary least squares (OLS) estimation of Eq. (3) with or without trend component, and then we must test the absence of a long run relationship between the level values of ytand xtby use of the F-statistics in line with the
below hypotheses:
H0: φ=0, δ=0 H1: φ≠0, δ≠0
In Eq. (3), the rejection of H0 hypothesis by the standard F (or Wald) tests leads to the acceptance of H1 hypothesis and indicates a long run equilibrium relationship between the variables. The statistics such estimated then are compared with the non-standard distributed asymptotic critical value bounds reported in Pesaran et al. (2001). If estimated F-statistic falls outside of the critical value bounds, we can definitely infer whether or not there exists a cointegrating relationship between the variables, regardless of the order of integration of the variables. In this case, if F-statistic exceeds its respective upper critical values, this means rejection of the null hypothesis of no co-integration between the variables. If F-statistic is found below the lower critical value bounds, we cannot reject non-existence of a cointegrating relationship. If estimated statistic lies between the bounds, we cannot make any conclusive inference as to the existence of a possible co-integrating relationship and need to know the order of integration of the underlying regressors.
Once the existence of a potential co-integration relationship between the variables is verified, the most appropriate lag specification of the variables in the ARDL model must be determined through the mostly used lag information criteria, so that the long run equilibrium and short run dynamic error correction model coefficients can be estimated by way of employing the standard OLS methodology.
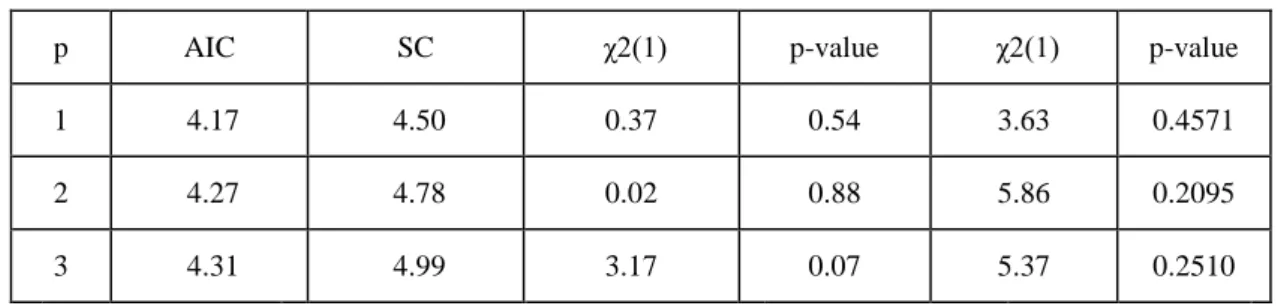
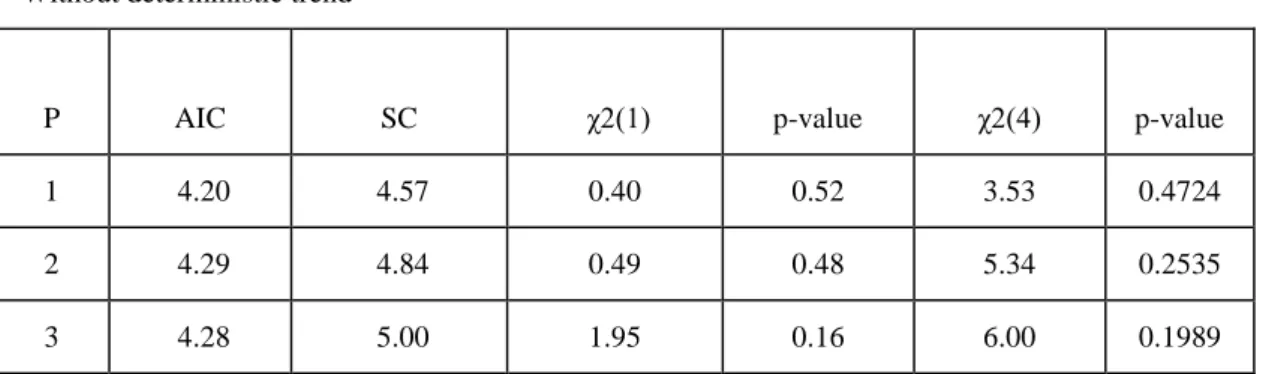
In order to determine the appropriate lag length (p), following Pesaran et al. (2001), for p = 1, 2, …, 5, the conditional error correction model in Eq. (3) is estimated by OLS methodology both with and without trend components in the regression. The results are given in Table 5 for ―with trend‖ and ―without trend‖ cases.
Table 3. Selection of the Lag Order for Eq. (2)
With deterministic trend
p AIC SC χ2(1) p-value χ2(1) p-value
1 4.17 4.50 0.37 0.54 3.63 0.4571
2 4.27 4.78 0.02 0.88 5.86 0.2095
Without deterministic trend
P AIC SC χ2(1) p-value χ2(4) p-value
1 4.20 4.57 0.40 0.52 3.53 0.4724
2 4.29 4.84 0.49 0.48 5.34 0.2535
3 4.28 5.00 1.95 0.16 6.00 0.1989
In Table 3, ‗p‘ shows the lag order of the underlying VAR for the conditional error correction model. AIC and SC represent Akaike and Schwarz information criterions, respectively. χ2(1) and χ2(4) are Breusch-Godfrey error terms Lagrange multiplier serial correlation test F-statistics under the null hypothesis of no serial correlation. The lag length is chosen as one for the ARDL equation.
Table 4. ARDL Unrestricted Error Correction Model of the Trade Balance Ratio
Dependent Variable: ∆mer
Coefficient Standard Error t-statistics p-value
C -18.797 44.583 -0.421 0.6750 ∆gdpt 3.654 2.3042 1.585 0.1187 ∆exc t 1.431 3.7124 0.385 0.7014 ∆wagest 2.175 6.6560 0.326 0.7451 ∆opennesst -5.757 4.2684 -1.348 0.1831 merger t-1 -0.922 0.1373 -6.715 0.0000 gdpt-1 1.687 2.9030 0.581 0.5636 exct-1 4.638 4.4745 1.036 0.3046 wagest-1 -5.488 5.1782 -1.059 0.2940 opennesst-1 -1.872 3.4148 -0.548 0.5858 trend -0.0098 0.0581 -0.169 0.8657
Table 5. Regression Statistics in Table 4
R-squared 0.5127
Mean dependent var
0.0245
Adjusted R-squared 0.4208
S.D. dependent var
2.4052
S.E. of regression 1.8305
Akaike info criterion
4.2022
Sum squared resid 177.59
Schwarz criterion 4.5733 Log likelihood -123.47 Hannan-Quinn criter 4.3484 F-statistic 5.5771 Durbin-Watson stat 1.9314 Prob(F-statistic) 0.000012
The Bounds testing approach (Pesaran et al. 2001) tests the null hypothesis of no cointegration. It is mainly a joint significance test of the one period lagged value of the levels in a conditional error correction model (ECM) in Eq. 3. The F-statistics are calculated for different lags chosen for the first differences of the variables. The existence of a potential co-integration relationship between the variables has been found for lag length one by comparing our estimates with the critical values reported in Table CI(iv), Table CI(v) and Table CII(v) m of Pesaran et al. (2001):
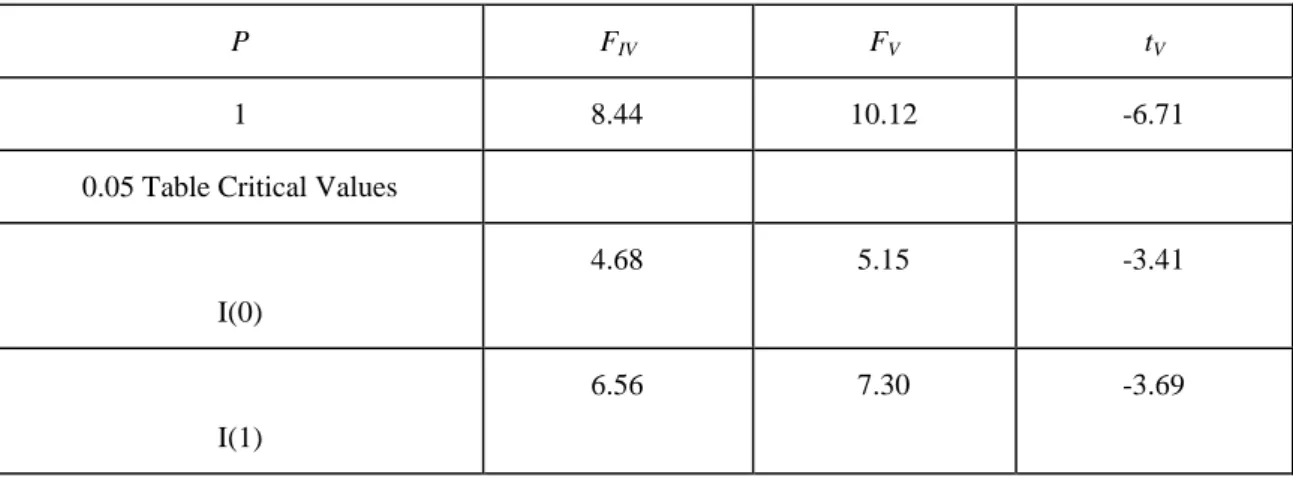
Tablo 6. F- and t-statistics for Testing the Existence of Co-integration
P FIV FV tV
1 8.44 10.12 -6.71
0.05 Table Critical Values
I(0)
4.68 5.15 -3.41
I(1)
6.56 7.30 -3.69
In table 6 Fıv is the F-statistic calculated by applying to Wald tests that impose zero value restriction to the one-period lagged level coefficient values and deterministic trend component. Fv is the F-statistic calculated by applying to Wald tests that impose zero value to the only one-period lagged level coefficient values of the variables. tv is the t-statistic of the coefficient of one-period lagged level value of dependent variable, that is, tbal, in Table 6. We can observe that estimation results of the F-statistics exceed the upper critical values and thus, infer that there exists a co-integrating relationship between the time series in the level form. The t-statistic of the one period lagged level value of the dependent variable also supports these findings in favour of co-integration.
In the light of Pesaran et al. (2001), since the results show that there is a cointegration, an ARDL model following Pesaran and Shin (1999) is built and the estimates of the relationship between levels is examined. We estimate that ARDL (0 0 0 0 0) model best fits in with the Turkish data. ARDL model is chosen according to Schwarz Bayesian Criterion. The long run relationship is given in Table 7.
Table 7. Estimated Long Run Coefficients using the ARDL Approach
Dependent
Variable: mer Coefficient Std.Error t-Statistics p-value
gdp 3.70 1.765 2.098 0.0401
exc 2.61 1.942 1.346 0.1831
wages -3.88 3.342 -1.158 0.2512
openness 4.27 2.722 1.671 0.1213
Our estimation results reveal that in a long run period satisfying a stationary relationship between the variables merger and acquisitions behave in accordance with our model expectations. The gross domestic product and openness of the economy affect merger and acquisitions significantly. The gross domestic product, real exchange rate and openness of the economy affect merger and acquisitions positively, whereas wages has a negative effect. One unit increase in gross domestic product seems to increase merger and acquisitions by 3.7. One unit increase in the openness ratio increase merger and acquisitions by 4.27.
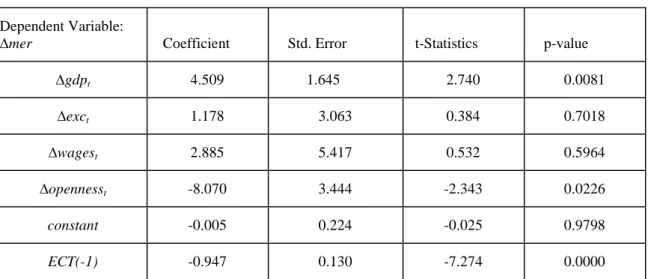
The ARDL specification of the short run dynamics can be derived by constructing an error correction model (ECM). All coefficients of short run equation are coefficients relating to the short run dynamics of the model‘s convergence to the equilibrium and the coefficient of the error term represents the speed of adjustment. The short run coefficients of the variables are presented in table 8 in the error correction model. As results of the ARDL based ECM show, the error correction term (ECT) is negative and highly significant. This means that deviations from the long run equilibrium are corrected through time. Therefore, ECM supports the results of the bounds test for existence of cointegration. The error correction term points out that nearly 9 % of the disequilibrium conditions within our co-integration model are corrected within one period.
Table 8. Estimated short run coefficients of the variables
Dependent Variable:
∆mer Coefficient Std. Error t-Statistics p-value
∆gdpt 4.509 1.645 2.740 0.0081 ∆exct 1.178 3.063 0.384 0.7018 ∆wagest 2.885 5.417 0.532 0.5964 ∆opennesst -8.070 3.444 -2.343 0.0226 constant -0.005 0.224 -0.025 0.9798 ECT(-1) -0.947 0.130 -7.274 0.0000
Table 9. Regression Statistics of the Error Correction Model
R-squared 0.501
Mean dependent var
0.0245
Adjusted R-squared 0.458
S.D. dependent var
2.4052
S.E. of regression 1.769
Akaike info criterion
4.0684
Sum squared resid 181.6
Schwarz criterion
Log likelihood -124.1 Hannan-Quinn criter 4.1481 F-statistic 11.67 Durbin-Watson stat 1.9050 Prob(F-statistic) 0.000
In the short run, merger and acquisitions mainly depends on gross domestic product and openness of the economy. They are found to be highly significant in the short run. The gross domestic product, real exchange rate and wages are found to affect merger and acquisitions positively, whereas openness of the economy is found to have a negative effect in the short run.
4. CONCLUSION
In this paper, the macroeconomic determinants of the merger and acquisitions are tried to be analyzed. Data and time series properties of the variables are presented and the results of the estimations are provided. The last section of the paper briefs our conclusion. In the empirical analysis, quarterly data is used covering the merger and acquisitions, gross domestic product, real exchange, wages and openness of the economy for the period of 1995-2011
We use autoregressive distributed lag (ARDL) bound testing approach of Pesaran Shin and Smith (2001), based on the fact that bound testing approach allows the variables to be stationary, integrated of order one or a mixture of both. After checking the existence of cointegration, the analyses continue with ARDL approach of Pesaran and Shin (1999) to investigate the short run and long run relations.
The results of the bound tests (Pesaran et al. 2001) suggest that there is a cointegration between the variables ofmerger and acquisitions, gross domestic product, real exchange rate, wages and openness of the economy variables. The gross domestic product and openness of the economy affect merger and acquisitions significantly. The gross domestic product, real exchange rate and openness of the economy affect merger and acquisitions positively, whereas wages has a negative effect.
REFERENCES
DICKEY D.A., and W.A. FULLER (1979), ―Distribution of the Estimators for Autoregressive Time Series with a Unit Root‖, Journal of the American Statistical Association, 74, pp. 427-431.
DICKEY D.A. and W.A. FULLER (1981), ―Likelihood Ratio Statistics for Autoregressive Time Series with Unit Roots‖, Econometrica, 49, pp.1057-1072.
DUNNING J.(1993), Multinational Enterprises and the Global Economy, Addison-Wesley Publishing, Reading, MA.
ENGLE R.F. and C.W.J. GRANGER (1987), ―Co-integration and Error Correction: Representation, Estimation, and Testing‖, Econometrica, 55, pp. 251-276.
ERDOGAN A.I.(2012), ―The Determinants of Mergers and Acquisitions: Evidence from Turkey‖,
International Journal of Economics and Finance, 4 Volume:4, pp.72-77.
EREL I, LIAO R.C. and M.S. WEISBACH (2012), ―Determinants of Cross-Border Mergers and Acquisitions‖, The Journal of Finance, 67 Volume:3, pp.1045-1087.
GARITA G., and C.V. MARRWIJK (2007), Macroeconomic Determinants of Cross-Border Merger
GRANGER C.W.J. and P. NEWBOLD (1974),‖Spurious Regressions in Economics‖,Journal of
Econometrics, 2(2), pp. 111-120.
JOHANSEN S.(1995), Likelihood-based Inference in Co-integrated Vector Autoregressive Models, Oxford University Press.
JOHANSEN S. (1988), ―Statistical Analysis of Cointegration Vectors, Journal of Economic Dynamics
and Control, 12, pp. 231-254.
JOHANSEN S. and K. JUSELIUS (1990), ―Maximum Likelihood Estimation and Inference on Cointegration-with Applications to the Demand for Money‖, Oxford Bulletin of Economics and
Statistics, 52, pp. 169-210.
KIYMAZ H. (2004), ―Cross-border Acquisitions of US Financial Institutions: Impact of Macroeconomic Factors‖, Journal of Banking & Finance, 28, pp.1413-1439.
PESARAN M.H., and Y. SHIN (1999), An Autoregressive Distributed Lag Modelling Approach to
Cointegration Analysis, Chapter 11 in Econometrics and Economic Theory in the 20th Century: The
Ragnar Frisch Centennial Symposium, Strom S.(ed.), Cambridge: Cambridge University Press.
PESARAN M.H, SHIN, Y. and R.J. SMITH (2001), Bound Testing Approaches to the Analysis of Level Relationships‖ Journal of Applied Econometrics, 16: 289-326.
SHIMIZU K., HITT M.A., VAIDYANATH D. and V. PISANO (2004), ―Theoretical Foundations of Cross-border Mergers and Acquisitions: A Review of Current Research and Recommendations for the Future‖, Journal of International Management, 10, pp. 307–353.
WANG J.(2008), ―The Macro Determinants of M & A Timing in China‖, International Journal of