Ergin Atalar, PhD
During an interventional magnetic resonance imaging (MRI) procedure, various kinds of surgical and interven-tional devices, such as needles, catheters, and guidewires, that contain metallic components are used inside the MRI scanner. Interference of these devices with radiofrequency pulses is known to be a possible health risk. The radiofre-quency (RF) power delivered by an RF body coil may become concentrated on these metallic devices and may cause a significant increase in the specific absorption rate (SAR), potentially resulting in excessive local temperature rise and burns (1).
This risk is very well known and has been extensively studied (2). The source of this problem is also well known (3). This temperature rise has been shown in a multitude of studies by many investigators (4 – 8). Unfor-tunately, absolute values of the results are conflicting, primarily because the methods used in these measure-ments have not been uniform. In addition, guidelines that could be used to prevent this problem from occurring in humans have not been established.
During an MRI procedure, RF pulses are applied to the subject in order to excite the spins and generate echo sig-nals, which are used to generate images. As an undesired side effect, the temperature of the subject increases as a result of absorption of the RF energy (9). The amount of applied RF energy depends on the pulse sequence that is being used, the type of the coil that is used to transmit this energy to the body, and the size, shape, and electro-magnetic and thermodynamic properties of the body. This
effect is very well known and various guidelines that are in place are safely used (10). Reported RF safety prob-lems are only related to the use of metallic devices that come into contact with the body (11). The existence of metallic devices inside or in contact with the body during an MRI examination is infrequent. As a safety precaution, during routine diagnostic examinations, patients are asked to remove all the metallic objects that may be in contact with their body. With few exceptions, the presence of metallic implants is a contraindication for MRI examina-tions. When the subject is free from metallic devices, an MRI examination can be conducted very safely with cur-rent guidelines, as used in approximately 2 million exami-nations per year.
With the advent of interventional MRI technology (12), the use of metallic devices during an MRI examina-tion, either internally or in contact with the body, is be-coming a necessary condition for many examinations. In many minimally invasive procedures, needles, guidewires, and catheters are used. It is well known that when these metallic devices are used, the RF pulses cause an induc-tion of electrical current and an accumulainduc-tion of electrical changes on these wires and these currents, which produce a high local electric field and results in an increase in the local specific absorption rate (SAR). Because SAR and temperature are related, some local temperature rise is to be expected. It is important to note that although this pro-cess seems complex, it is possible to calculate and esti-mate the amount of heat and temperature rise for a given condition. While local heating is real and significant, knowing the amount of temperature increase is sufficient to conduct a safe MRI examination because the amount of power applied during an MRI examination is adjust-able by the user. Currently, MRI scanners are equipped with software and/or hardware that limit the applied power level to a predetermined level. Although this
Acad Radiol 2005; 12:1149 –1157
1From The Johns Hopkins University, Baltimore, MD, and Bilkent Univer-sity, Ankara, Turkey; 06800. Received June 6, 2005; revision received and accepted June 8. This work was supported by a grant from the National Institutes of Health (R01 HL61672). Address correspondence to E.A. e-mail: [email protected]
©AUR, 2005
power limitation causes a reduction in MRI scanner imag-ing capabilities, many imagimag-ing sequences can be used very effectively within these limits. It is, therefore, impor-tant to understand completely the amount of temperature rise for a given RF power.
Unfortunately, current government guidelines are not suitable for furthering this understanding. In United States, the Food Drug Administration (FDA) recommends that (A) whole body SAR should not be more than 4 W/kg and (B) SAR should not exceed 8 W/kg anywhere in the head or torso when the SAR is averaged over 1 gram of tissue (10). Similarly, in the extremities, up to 12 W/kg of SAR is allowable when it is averaged over 1 gram of tissue. In parallel to this recommendation, there is a recommended temperature limit for local heating. It is recommended that the temperature rise due to SAR application should not be more than 1°C anywhere on the head. The corre-sponding temperature limit for the torso is 2°C, and °C for extremities. Given that a typical body has daily core temperature fluctuations between 36 to 38°C and the tem-perature stability of the head is far more important than of the extremities, it is relatively easy to justify the FDA’s local temperature rise limits. However, the relation between the temperature and SAR limits has not been well justified. On the other hand, measurement of the temperature rise in vivo is difficult. Because of these problems, the confusion in the field continues.
Multiple temperature measurements were conducted for guidewire tip heating in a phantom. Nitz et al. (5) measured an 11°C increase in 12 s with an estimated SAR of 1 W/kg application to the phantom. Others (8,13) measured more than a 20°C increase. In an article by Konings et al. (7), a 50°C temperature increase in 30 s was observed when an SAR of 4 W/kg was applied. In a 1997 article, Chou et al. showed a 14°C temperature in-crease in 4 min when a pulse sequence with an estimated SAR of 1 W/kg was used (14). This body of work con-firms the importance of this problem and justifies a need for a careful analysis of the problem.
One of the main problems with the temperature mea-surement techniques used in the literature is that the ther-modynamic properties of the phantoms that are used in the experiments do not match the thermodynamic proper-ties of the human body. Some investigators used water or saline solution as a phantom. Although the electromag-netic properties (such as electrical conductivity and per-mittivity) of such phantoms are close to those of the hu-man body, convection occurs in water or saline solution and causes significant underestimation of the simulated in vivo temperature profile. In order to solve this problem, investigators have used gel phantoms (15). Although a gel phantom solves the convection problem, it is important to note that this type of phantom lacks perfusion. In the body, perfusion is one of the main means of heat transfer. An absence of the perfusion results in a significant over-estimation of the actual problem (16).
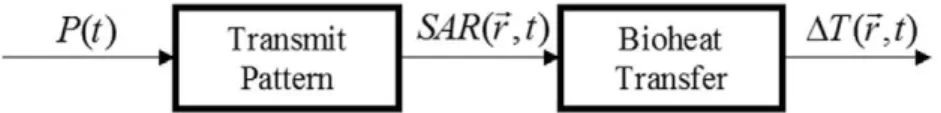
In order to formulate the problem (6), it is best to di-vide the RF safety problem into two components (Fig. 1). The first component involves an electromagnetic problem where applied RF power to a body coil is transmitted to the body, causing a particular electric field distribution, which is directly related to the specific absorption rate (SAR) distribution. This SAR distribution is modulated by the existence of metallic components in the body. The SAR by itself is not a health risk. However, SAR causes a temperature increase and this temperature rise may cause burns. Therefore, the second component of the RF safety problem is a bioheat transfer problem: the problem of evaluating the temperature distribution, given the SAR distribution. The bioheat problem, in its general form, was investigated earlier and formulated with the well-known bioheat equation (17). If these two components of the problem are very well understood, the applied power from the MRI scanner can be adjusted to a level that will cause no significant increase in temperature.
We first discuss SAR distribution around active and passive metallic devices. Green’s function averaging method will be introduced as a means of converting the Figure 1. Flow-chart model of RF heating in MRI. The power, P(t), which is applied
to the body coil, results in a specific absorption rate (SAR) distribution. This power absorption in the body results in a temperature change in the body. Change in the temperature is determined by thermal properties of the body, such as thermal con-ductivity and perfusion.
safety of these devices. Last, we discuss methods to mea-sure the safety of the devices. Let’s start with analysis of the SAR distribution on metallic devices.
SAR DISTRIBUTION
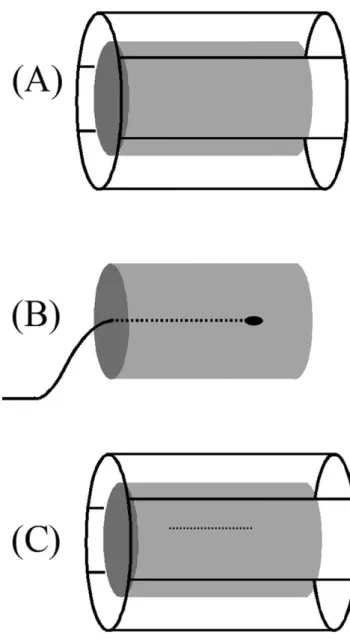
We examine the SAR distribution calculation under three main categories: (A) body coil transmitter; (B) internal coil transmitter; and (C) coupling with metallic objects (Figure 2).
Body Coil Transmitter
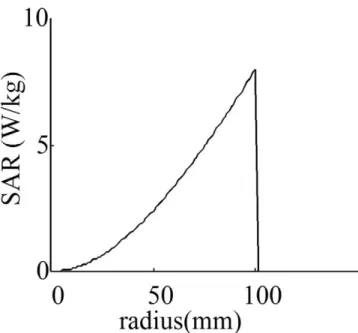
The first case is the most common case, where a body coil is used to transmit the RF power and no metallic ob-ject is inside the body. The human body differs in size and shape from subject to subject. In addition, various body coil designs are used for different examinations. Finding a solution that applies to all cases is difficult. However, in clinical MRI scanners, almost all scanner manufacturers use a quadrature birdcage coil as an RF power transmitter (Figure 2A). The main advantage of the birdcage coil is its ability to generate a uniform magnetic field over the entire volume of interest. In order to make a first-degree approximation of the problem of heating, in an early study Bottomley et al. (9) assumed that the body is a uniform cylindrical object with finite conductivity. They also assumed that the wavelength is long compared with body size. In this case, the electric field becomes zero at the center of the object and increases linearly with radial distance from the center. Knowing that SAR is pro-portional to the square of the electric field magnitude, SAR becomes proportional to the square of the radial po-sition (Figure 3). It has been shown that SAR distribution may deviate from this approximate calculation when a more realistic model of the body is used in numerical calculations (18,19). In addition, when high field (3 T or higher) MR scanners are used, the heat profile deviates from the quadratic relation (20).
Internal RF Transmitters
Internal MRI coils are rarely used as transmitters, pri-marily being used as receivers only (21,22). For catheter tracking applications (23), this mode of operation has a big advantage. If the transmitter is an internal MRI coil (Figure 2B), calculations of the SAR distribution are rather straightforward. Almost all of the energy of the
field is confined in a region around the antenna. In our laboratory, we use a loopless antenna (a coaxial cable with extended inner conductor) for imaging and tracking purposes (22). When this antenna is used as transmitter, the power in the electric field around the antenna de-creases with the distance from the antenna. In other words, SAR becomes approximately proportional to the inverse-square of the radial distance from the antenna (24). As in the birdcage body coil, this relation is approx-Figure 2. The three cases that are analyzed for heating the body. (A) A birdcage body coil is used for transmitting the RF power. No metallic object is inside the cylindrical body. (B) The RF power is applied through an internal transmitter. This case is rarely used in practice but interesting to analyze. (C) This is the case where a metallic wire is inside the body when RF power is applied using a birdcage body coil.
imate and more accurate results can be found when a het-erogeneous body model is used (Figure 4).
Coupling With Metallic Objects
A rather complex analysis is required to understand the relation between RF power deposition around an implant and the RF power applied to a body transmit coil. This complex problem becomes a rather straightforward
prob-lem for electromagnetic field solver software that uses advanced electromagnetic field solving methods such as methods of moments. For this article, the results are more important than the methods used to calculate them. In order to give the reader an intuitive understanding of the issues, we assume that a linear metallic wire of a finite length is placed inside the body along the axis of the body. As shown inFigure 5, maximum heating occurs at both ends of the wire (24). When the wire length in-creases, the heat deposition increases and, at a critical wire length, the heat deposition reaches its highest value and begins to decrease with further increases in the wire length. This critical length is sometimes called the reso-nance length and it is approximately half the wavelength of the transmitted RF pulse inside the object. At 1.5-T proton imaging, this length is approximately 18 cm long. The resonance length is inversely proportional to the strength of the field; that is, when 3-T proton imaging is used, the resonance length becomes 9 cm long.
It has been shown that insulation of the wires increases the resonance length significantly. Only a few microns of insulation is enough to make a significant change in the resonance length. In most cases, adding insulation de-creases the RF power deposition at the tips of the wires. However, it is important to note that if the wire is already longer than the resonance length, adding insulation may cause an increase in RF power deposition. With 1.5 T, if Figure 3. SAR as a function of radial distance to the center
when a birdcage body coil is used as a transmitter.
Figure 4. SAR as a function of radial distance to the center when a loopless antenna is used as a transmitter.
Figure 5. Theoretically predicted SAR gain on the surface of a bare wire in a lossy medium subject to an incident homogeneous electric field. SAR gain is the ratio of peak SAR to the native SAR at the same location if the wire were not present. RF heating is minimum at the center of the wire and maximum at the wire tip in all cases. Five wire lengths are shown: 6 cm, 12 cm, 18 cm (close to resonant length), 24 cm, and 30 cm. Wire diameter is 0.5 mm (24 AWG) and electrical conductivity is 0.5 S/m.
gible. We return to this subject later.
Measuring SAR
Although most metallic devices, such as needles, guidewires, and catheters, used in interventional MRI procedures are linear structures, it is important to have a general understanding of the SAR distribution for any shape of metallic device. Although advanced electromag-netic field solvers may be used to analyze such compli-cated devices, a more straightforward method is direct measurement. Direct SAR measurement is also important for these devices in order to verify the theoretical results since theoretical errors are usually difficult to track down. One common method to measure SAR distribution is by using phantoms. For this purpose, a gel phantom that sim-ulates in vivo conditions must be created. One important factor in the creation of the phantom is to match the elec-tromagnetic properties. Fortunately, the permittivity of the gel is similar to body permittivity and no adjustment is necessary. On the other hand, the electrical conductivity depends on the salt content of the gel and must be carefully matched to the in vivo condition. The FDA recommends 0.8 g/L salt in preparation of the gel. Although conductivity of the tissue varies greatly (blood 1.2 Siemens/m, fat 0.035 Siemens/m at 64 MHz), if a single measurement is neces-sary, this solution may be used as an approximate average tissue conductivity. The metallic device that will be in-vestigated can be placed inside the phantom during the phantom preparation phase.
When heat is uniform, the temperature of the phantom rises at a rate proportional to SAR. The value of SAR can be estimated by normalizing the slope of the temperature-time curve to the heat capacity of the gel (usually taken as 4200 J/kg/°C). When the heat is not uniform, slope of the temperature-time curve changes because of heat con-duction. In this case, the initial slope of the temperature time curve must be used in the measurement of SAR. It is assumed that there is no significant heat conduction during this initial heating period. If the measurement is conducted at the peak heating location, the slope of the temperature-time curve always decreases over time. It should be noted that when the heating is very localized, as in the case of wire tip heating, the slope may change very quickly and initial slope measurement is sometimes very difficult.
In the previous section, it was demonstrated that SAR distribution in the body can be calculated or measured very precisely. How does SAR distribution translate to temperature? The answer to this question depends on the thermodynamic properties of the environment. The ther-modynamic behavior of the body has been studied exten-sively and summarized into the bioheat equation. In the case of safety analysis, the bioheat problem, that is, the problem of finding temperature variation given SAR dis-tribution, can be solved using a relatively straightforward convolution operation with Green’s function, where Green’s function (or impulse response) is the temperature distribution as a result of point heating. While leaving some of the mathematical details of this calculation to the Appendix of this manuscript for the sake of decreasing the complexity of the text for the general reader, it is im-portant to note that Green’s function convolution (which is sometimes called Green’s function averaging as op-posed to the 1-g or 10-g averaging as used in the litera-ture) can be conducted with a rather straightforward com-puter program once the intrinsic SAR distribution is known.
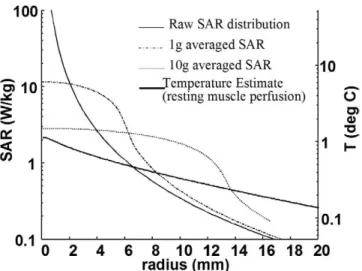
To show the difference between 1-g and 10-g averag-ing techniques and Green’s function averagaverag-ing techniques, we assume that a subject was heated with a loopless an-tenna transmitting 100-mW RF power when the anan-tenna is assumed to be placed in an exercising muscle. As can be seen in Figure 6, while 1-g averaging results in a greater than 10 W/kg local averaged heating value at the point of maximum heating, 10-g averaging shows a result just above 2 W/kg local averaged heating. In other words, this heating may be considered excessive when the 1-g averaging technique is used and acceptable when the 10-g averaging is used. While both techniques result in a com-pletely different safety results, Green’s function averaging estimates the expected temperature rise at the maximum heating location as 1°C. It is important to note that these results do not always have one level of bias. It is possible to generate sample SAR distribution cases where, al-though both 1-g averaging and 10-g averaging techniques may generate acceptable heating results, the Green’s func-tion averaging technique may result in excessive heating. The level of perfusion plays a critical role in the shape and scale of the Green’s function-averaged curve.
In conclusion, the estimation of temperature variation in the body when local SAR is applied is a critical step.
If this estimation process is not carried out properly, a significant error in the safety margins may result, leading to unsafe use of interventional devices. Alternatively, the full performance of the MRI scanner cannot be realized because the currently applied safety margins are too re-strictive. Adaptation of new improved RF safety guide-lines for interventional MRI is necessary. Once these new reliable guidelines are in use, any metallic devices can be used in the MRI scanner by simply setting the applied RF power to an acceptable level.
SAFETY INDEX: A METRIC FOR LOCAL RF HEATING
Can we use guidewires, catheters, needles, or similar metallic objects inside the MRI scanner safely? In order to answer this question using the techniques that we dis-cussed earlier, we need to place the metallic object inside a phantom that simulates the human body and measure (or calculate) SAR distribution around the object for a given RF power level and then apply Green’s function averaging in order to determine the temperature distribu-tion in the body. Note that the temperature scales with the applied power level; and once a maximum allowed tem-perature level is determined, the maximum allowed power
level can be calculated. As can be estimated, the allowed power level depends on the type of body coil used and therefore the procedure must be repeated before every experiment. This will obviously create complications, given that not all physicians work in an environment con-ducive to obtaining such measurements and calculations.
In order to solve this problem, a simple, scanner-inde-pendent index based on the unit of °C/(W/kg) was pro-posed in order to label each interventional MRI device (6). Assume that an interventional MRI device manufac-turer labels their metallic device with a safety index of 4°C/(W/kg). That means that if the operator chooses an MRI pulse sequence with an SAR level of 1 W/kg, a lo-cal temperature rise of 4°C can be observed. With this knowledge, the physician in charge of the operation may order the operator not to exceed 0.25 W/kg to stay within the 1°C limit or he or she may choose to apply a higher power level, knowing the benefits and risks of this proce-dure for the patient. Therefore, such an index may be very important for the physician and simplify the inter-ventional procedure tremendously.
The remaining question deals with how a manufacturer can measure or calculate the safety index. The solution to this problem is rather straightforward but requires very careful and sometimes time-consuming analysis. First, a gel phantom that simulates the body’s electromagnetic properties must be constructed. Depending on the possible locations in the body that these interventional MRI de-vices will be placed, the phantom shape and size must be selected in a reasonable fashion.
Second, the worst heating positions and orientation for the device must be estimated. Although much depends on the body coil configuration and the location of the point of interest, the electric field is usually along the axis (z-axis) of the bore and the worst orientation occurs when the electric field and the axis of the device are aligned. The maximum heating typically occurs at the tip and/or sharp corners of the device. If this is not known, SAR measurements from multiple suspected locations must be conducted.
Third, the SAR distribution around the suspected heat-ing location must be examined for a given unit (1 W/kg) of applied power. Two important error sources in this measurement are (A) difficulties in measurement of the SAR distribution and (B) the variability of the applied RF power. It is very critical to know the distribution of the SAR for a given device. The most accurate results are obtained by electromagnetic field simulator software; however, SAR measurement at multiple locations may Figure 6. Comparison of 1 g, 10 g, and Green’s function
aver-aged SAR values. Temperature scale as a result of the Green’s function averaging is matched to SAR scale by using Green’s function gain. Green’s function averaging does not consistently give lower averaged values than 1-g or 10-g averaging tech-niques. Its value depends on the perfusion level and the raw SAR distribution profile. In this figure, the perfusion level of the exer-cising muscle was used and SAR distribution was generated by a transmitting loopless antenna.
device. Knowing the exact SAR distribution will be criti-cal for the last step. An SAR measurement from the same location with and without the device will help to generate a normalized peak SAR value. It is important to note that the estimated SAR value generated by the MRI scanner software is not reliable if the size of the phantom is rela-tively small or the electrical conductivity of the phantom is significantly different than average body electrical con-ductivity. It is also important to note that typically SAR value is high at the surfaces and low in the center of the phantom (and the body as well.) In order to obtain a cor-rect safety index reading, it is important to estimate the heating at the location of the interventional device to de-termine the correct normalization. Once the SAR distribu-tion due to the presence of the intervendistribu-tional MRI device for a 1-W/kg input power level is known, the last step in calculation of the safety index can be conducted.
Fourth, a computer program should be written to cal-culate expected in vivo temperature rise for a given nor-malized SAR distribution, based on the equations given in the Appendix. It is important to note that the temperature rise of the phantom where there is no perfusion is ex-pected to be higher than what is calculated. In some cases, this calculated value is significantly lower than what is measured as temperature on the phantom for a given 1-W/kg power level. It is also important to note that this steady-state temperature value on the phantom is usually reached after a very long period of time (on the order of several tens of hours depending on the size of the phantom), while the steady-state temperature in the body is reached anywhere from 10 seconds to 30 minutes, depending on the perfusion level.
As an example, the safety index of wires inside a 1.5-T MRI scanner is presented. InFigure 7, graphs show the maximum safety index as 8 °C/(W/kg) in resting mus-cle that will limit the applied RF power to 0.25 W/kg if a physician finds it acceptable to increase the temperature by 2°C at some portions of the body.
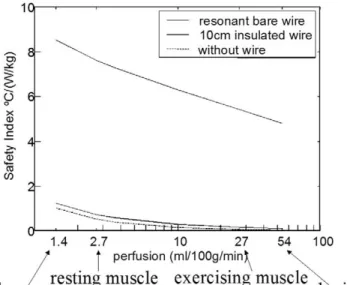
In Figure 8, the safety index as a function of perfusion level for a resonant length wire is shown. As the perfu-sion level decreases, the value of the safety index in-creases. This means that the lower the perfusion level, the higher the temperature rise. The safety index of a 10-cm-long wire is shown to demonstrate that its safety index is almost identical to the no-wire case for all perfusion levels.
In this section, a straightforward but rather time-consuming safety index measurement technique has been described. Although this measurement takes a significant amount of time and energy for the careful investigator, the results can be used in any MRI scanner without a need to repeat the measurements while using these on Figure 7. Safety index of a bare wire and insulated wire in rest-ing muscle in a 1.5-T MRI scanner. In the same graph, the safety index of wire-free case is shown as a reference. As can be seen, a 30-cm-long insulated write may cause a temperature rise greater than a 30-cm-long bare wire. An insulated wire, which has a length less than 10 cm, has minimal interaction with the RF field and therefore behaves as if there is no wire in the medium.
Figure 8. Effect of perfusion on the safety index of a resonant length wire compared with 10-cm insulated and no wire cases. Perfusion values of the various tissue types were labeled on the perfusion axis.
patients. The physician must adjust the acceptable power level for a given procedure and the MRI pulse sequence should be limited by this power level for the rest of the procedure. Once these precautions are taken, interven-tional MRI procedures can be conducted with metallic devices without concerns for RF safety.
CONCLUSION
During an interventional procedure, there are many clinical problems on which the physician must concen-trate. The RF safety aspects of the interventional MRI procedure should be resolved before the start of the pro-cedure. A dosimetric approach has been successfully con-ducted with regard to the safety of X-ray⫺guided inter-ventional procedures. A similar approach will be very suitable for interventional MRI procedures with regard to the metallic implants and devices that will be used during an interventional procedure. Here, a review of the RF heating safety measurement techniques has been pre-sented, with the hope that interventional MRI device manufacturers will adapt these safety measures, govern-ment regulators will accept these techniques as a stan-dard, and, finally, physicians will use the methods to safely conduct interventional procedures, particularly when metallic devices are an issue.
ACKNOWLEDGMENTS
Most of this work was conducted by Christopher Yeung, PhD. I would like to thank him for allowing me to use his materials in this manuscript. I also thank Mary McAllister for help in manuscript preparation.
REFERENCES
1. Shellock FG, Crues JV. MR procedures: Biologic effects, safety, and patient care. Radiology 2004; 232:635– 652.
2. Dempsey MF, Condon B, Hadley DM. Investigation of the factors responsible for burns during MRI. J Magn Reson Imaging 2001; 13:627– 631.
3. Ladd ME, Quick HH. Reduction of resonant RF heating in intravascular catheters using coaxial chokes. Magn Reson Med 2000; 43:615– 619. 4. Pictet J, Meuli R, Wicky S, van der Klink JJ. Radiofrequency heating
effects around resonant lengths of wire in MRI. Physics Med Biol 2002; 47(16):2973–2985.
5. Nitz WR, Oppelt A, Renz W, et al. On the heating of linear conductive structures as guide wires and catheters in interventional MRI. J Magn Reson Imaging 2001; 13:105–114.
6. Yeung CJ, Susil RC, Atalar E. RF safety of wires in interventional MRI: Using a safety index. Magn Reson Med 2002; 47:187–193.
7. Konings MK, Bartels LW, Smits HFM, Bakker CJG. Heating around in-travascular guidewires by resonating RF waves. J Magn Reson Imaging 2000; 12:79 – 85.
8. Wildermuth S, Dumoulin CL, Pfammatter T, et al. MR-guided percuta-neous angioplasty: Assessment of tracking safety, catheter handling and functionality. Cardiovasc Intervent Radiol 1998; 21:404 – 410. 9. Bottomley PA, Redington RW, Edelstein WA, Schenck JF. Estimating
radiofrequency power deposition in body NMR imaging. Magn Reson Med 1985; 2:336 –349.
10. Athey TW. Current FDA guidance for MR patient exposure and consid-erations for the future. Ann N Y Acad Sci 1992; 649:242–257. 11. Knopp MV, Essig M, Debus J, et al. Unusual burns of the lower
ex-tremities caused by a closed conducting loop in a patient at MR imag-ing. Radiology 1996; 200:572–575.
12. Kahn T, Lewin JS, Duerk JL. Interventional MRI Challenge for radiol-ogy. J Magn Reson Imaging 2000; 12:511–511.
13. Ladd ME, Quick HH, Boesiger P, McKinnon GC. RF Heating of Actively Visualized Catheters and Guidewires. ISMRM; 1998; Sydney, Australia. 14. Chou CK, McDougall JA, Chan KW. RF heating of implanted spinal fu-sion stimulator during magnetic resonance imaging. IEEE Biomed Eng 1997; 44:367–373.
15. Park SM, Nyenhuis JA, Smith CD, et al. Gelled versus nongelled phan-tom material for measurement of MRI-induced temperature increases with bioimplants. IEEE T Magn 2003; 39:3367–3371.
16. Yeung CJ, Atalar E. A Green’s function approach to local rf heating in interventional MRI. Med Phys 2001; 28:826 – 832.
17. Pennes HH. Analysis of tissue and arterial blood temperatures in the resting human forearm. J Appl Physiol 1948; 1:93–122.
18. Collins CM, Li SZ, Smith MB. SAR and B-1 field distributions in a het-erogeneous human head model within a birdcage coil. Magn Reson Med 1998; 40:847– 856.
19. Collins CM, Smith MB. Calculations of B-1 distribution, SNR, and SAR for a surface coil adjacent to an anatomically-accurate human body model. Magn Reson Med 2001; 45:692– 699.
20. Vaughan JT, Garwood M, Collins CM, et al. 7T vs. 4T: RF power, ho-mogeneity, and signal-to-noise comparison in head images. Magn Re-son Med 2001; 46:24 –30.
21. Atalar E, Bottomley PA, Ocali O, et al. High resolution intravascular MRI and MRS by using a catheter receiver coil. Magn Reson Med 1996; 36:596 – 605.
22. Ocali O, Atalar E. Intravascular magnetic resonance imaging using a loopless catheter antenna. Magn Reson Med 1997; 37:112–118. 23. Atalar E, Kraitchman DL, Carkhuff B, et al. Catheter-tracking FOV MR
fluoroscopy. Magn Reson Med 1998; 40:865– 872.
24. Yeung CJ, Atalar E. RF transmit power limit for the barewire loopless catheter antenna. J Magn Reson Imaging 2000; 12:86 –91.
APPENDIX
The simplified version of the bioheat equation that is descriptive of the effects of external heating can be writ-ten as follows: 1 ␣ ⭸⌬T(rr, t) ⭸t ⫽ ⵜ 2 ⌬T(rr, t)⫺ v2 ⌬T(rr, t)⫹t kSAR(r r , t)
where⌬T is the amount of temperature rise,␣ is the ther-mal diffusivity, v is the perfusion constant,tis the tissue
mass density, and k is the thermal conductivity of the body. It is known that the thermal properties of the tissue depend on the tissue type and therefore vary significantly throughout the body.ⵜ2is the Laplacian operator
components: (A) the Laplacian component (temperature variation of the temperature difference between the point of interest and the neighboring locations); (B) perfusion component (the heat is assumed to be taken away from the local heating area by blood); and (C) the SAR compo-nent (the temperature rise due to applied electromagnetic power to the point of interest. Although the effect of tem-perature loss at the skin can be placed as a boundary con-dition to this equation, the rate of heat production as a result of the local biochemical reactions at the point of interest has been ignored. Although this component is very significant in determining the absolute value of the temperature, because we are interested in⌬T rather than absolute temperature, for a low variation of the tempera-ture, we can safely assume that the rate of biochemical reaction is independent of the temperature.
The bioheat equation can be solved rather easily if the equation can be linearized. In so doing, we assume that none of the parameters described in the bioheat equation depends on temperature (this is a valid assumption if the variation of the absolute temperature is not large) and the point of interest is inside the subject and far away from the skin and other boundaries. Furthermore, the subject’s thermal properties are position invariant. This assumption is also valid if the heating is local. Under these assump-tions, the solution of the bioheat equation is:
⌬T(rr, t)⫽ SAR(r
r
, t)r,t∗ G(r
r
, t)
where G is Green’s function (or the temperature as a
equation, r,t represents a two-dimensional convolution
operation. In this equation, the Green’s function is:
G(r r , t)⫽ ␣t k
共
ⱍ
r rⱍ
␣t兲
3⁄2 exp冉
⫺ⱍ
r rⱍ
2 4␣t冊
exp(⫺␣v 2 t)Although it is rather straightforward to put this equa-tion into a computer program in order to perform the con-volution, this equation can be simplified if one assumes that SAR is applied continuously and the steady state in vivo temperature is sought. In this case, the convolution equation becomes: ⌬Tss(r r )⫽ SAR(r r )r∗Gss(r r ) where Gss(r r )⫽ t 4kⱍr r ⱍ exp
共
⫺vⱍ
r rⱍ
2兲
Both the steady-state version and the time-dependent version of Green’s functions can be implemented with a computer simulator once the SAR distribution is known. These equations can be thought of as weighted averaging of the SAR in order to find the expected temperature. It is obvious that Green’s function averaging method generates quite different results than 1-g or 10-g averaging tech-niques detailed in the literature.