S. G. Henderson, B. Biller, M.-H. Hsieh, J. Shortle, J. D. Tew, and R. R. Barton, eds.
A SIMULATION MODEL FOR MILITARY DEPLOYMENT
Uğur Z. Yıldırım İhsan Sabuncuoğlu
Barbaros Tansel
Department of Industrial Engineering Bilkent University
Bilkent, Ankara 06800, TURKEY
ABSTRACT
The Deployment Planning Problem (DPP) for military units may in general be defined as the problem of planning the movement of geographically dispersed military units from their home bases to their final destinations using different transportation assets and a multimodal transportation network while obeying the constraints of a time-phased force deployment data de-scribing the movement requirements for troops and equipment. Our main contribution is to develop a GIS-based, object-oriented, loosely-coupled, modular, plat-form-independent, multi-modal and medium-resolution discrete event simulation model to test the feasibility of deployment scenarios. While our simulation model is not a panacea for all, it allows creation and testing the feasi-bility of a given scenario under stochastic conditions and can provide insights into potential outcomes in a matter of a few hours.
1 INTRODUCTION
Nowadays, regional and asymmetric threats and the in-crease in worldwide terrorist activity continue to chal-lenge the peace and stability in the world. Disasters, both natural and man-made, have placed additional demands on the international community for assistance. All of these have led almost all countries in the world to recon-sider their military strategy and structure of their logistic support systems. The strategy of massing up large num-ber of troops and equipment in regions where an attack or disaster is anticipated has been replaced by the military strategy that envisions having smaller but more agile forces stationed at certain places with the capability to deploy units, equipment, material, and supplies rapidly to contingency regions at the time they are required. During peace time, plans are made to deploy required number of troops and equipment to potential threat or disaster areas. During a time of crisis or natural disaster, it will be
neces-sary to use these plans as they are, to modify them as nec-essary or to create new deployment plans in a short time. For these reasons, we have decided to develop a simula-tion model of military deployment with accurate transpor-tation network infrastructure data and a medium-resolution allowing planners to develop and analyze plans in a relatively short time.
This study is implemented as part of a capability planning system being developed in the Scientific Deci-sion Support Center of the Turkish General Staff Head-quarters. Our simulation model will also be used along with a comprehensive optimization model of the DPP (Akgün and Tansel 2007), developed as part of the capa-bility planning system mentioned above, to test the ro-bustness of results from optimization under stochastic conditions of the simulation.
In Section 2, the relevant literature is briefly re-viewed. In Section 3, the DPP is explained in detail. The simulation model of deployment problem is presented in Section 4, where conceptual and logical models are ex-plained, and verification and validation issues (V&V) of our model are discussed. Finally, our conclusions and fu-ture work in our on-going research are presented in Sec-tion 5.
2 LITERATURE REVIEW
There exist deployment planning models and simulations with varying levels of detail and purpose. For a more comprehensive survey of military planning systems and a review of strategic mobility models supporting the de-fense transportation system, the interested reader is re-ferred to Boukhtouta et al. (2004) and McKinzie and Bar-nes (2003) respectively. It is possible to classify military deployment models and simulations into two groups de-pending on their level of resolution and the purpose of use. First group includes relatively low-resolution models and simulations that may be used to model deployment of military units between theaters of operation (e.g., from
Turkey to Afghanistan) or inside a theater of operation (e.g., inside Turkey). Deployments between different theaters of operation using air and sea transportation as-sets are referred to as strategic deployment. The models most frequently used to model strategic deployments are ADAMS, Allied Deployment and Movement System (Heal and Garnett 2001) and JFAST, The Joint Flow and Analy-sis System for Transportation
<http://www.jfast.org>. An example of simula-tions modeling deployment inside a theater of operation is ELIST, The Enhanced Logistics Intra-Theater Support Tool (Groningen et al. 2005). The second group includes higher-resolution models and simulations that may also be used to provide input to the models in the first group. Examples of these models and simulations are TLoaDS, The Tactical Logistics Distribution System (Krause and Parsons 1999), ICIS, Integrated Consumable Item Sup-port (Gunshenan, Kratkiewicz and Cashon 1997), PORTSIM, The Port Simulation (Howard et al. 2004), TRANSCAP, The Transportation Capability (Burke, Love and Macal 2004) and Evaluation of Army Corps Artillery Ammunition Supply System via Simulation (Sabuncuoğlu and Utku 2002).
There seems to be a need to test the feasibility of stra-tegic deployment scenarios and deployment plans inside a theater of operation. While our medium-resolution simu-lation model is not a panacea for all, it provides a realistic and quick litmus test for the applicability of existing de-ployment plans and allows a quick construction of contin-gency deployment plans.
3 PROBLEM AND SYSTEM DEFINITION
The DPP deals with the movement of many military units stationed at various locations, referred to as Areas of Re-sponsibilities (AOR) (or sometimes as home bases), to their Tactical Assembly Areas (TAAs) (final destina-tions). The movement could be either an intra-theater or an inter-theater type. Intra-theater movement can be re-garded as the movement of units using different modes of transportation (land, sea, air, and rail) inside a country’s borders. Inter-theater movement refers to the movement of units between countries using air and sea assets (strate-gic deployment). Once the units reach the destination country, then other available modes of transportation can be utilized inside that country. In this context, the terms “theater” and “country” are used synonymously.
During intra-theater movement, a unit may go di-rectly from its home base to its final destination through-out the entire journey using a single mode of transporta-tion assets (TAs) on a given mode of transportatransporta-tion network that supports the movement of the TAs under consideration. It may also use in succession any of land, rail, sea, or air transportation networks and the TAs dedi-cated to them making mode changes as necessary along
the way. However, the fewer the mode changes are at transfer points, the easier is the deployment. If a transfer is necessary, the initial movement from home bases is by ground transportation to a transfer point (a location where the movement switches from one mode of transportation to another). Main transfer points are harbors, train sta-tions and airports. At these locasta-tions, the pax (troops) and cargo (weapon systems, material, equipment, and sup-plies) a unit has, collectively referred to here as items, are transferred from one set of TAs to another set that operate on a different network. This location is also called a Port of Embarkation (POE). The next mode change location, where the items are offloaded and loaded onto another set of TAs is called a Port of Debarkation (POD). These may be sea, rail and air POEs or PODs. Inter-theater movement differs from intra-theater movement only by its use of strategic lift (air and sea) assets to reach the next theater of operations.
At a transfer point, units are held in a staging area to prepare for shipment before being loaded on vessels. However, in many cases, there is not enough room at the terminal to stage the entire unit or large numbers of units scheduled to move at the same time. In such cases, a marshaling area is operated. Marshaling area provides a location to receive unit personnel, equipment and sup-plies, and prepare them for movement prior to entering the staging area. As the transport vessel (e.g. a ship, a train or an airplane) gets ready, the units are called from the marshaling area to the staging area. The two areas, staging area and marshaling area, serve much the same purpose. A staging area can be regarded as a service point, i.e. one with a certain capacity of material handling equipment and load/unload docks, and a marshalling area as a waiting/parking place. They help provide an uninter-rupted flow of items through their transfer points. Stag-ing/Marshalling areas are also operated at home bases and destinations (Akgün and Tansel 2007).
A unit is usually divided into three components (advance party, pax party, and cargo party) during deployment. Ground movement is conducted in convoys to maintain the unity of the component, and the size of the convoys may vary depending on operational/tactical objectives and limitations. The synchronization of departures of these components from their home bases and their arrival at their designated destinations is dictated by operational requirements, threat level present, availability and capacity (lanemeter, seat, volume, weight) of lift assets and the current conditions of transportation infrastructure (Akgün and Tansel 2007).
A unit will usually use its own (organic) TAs to conduct a deployment. However, for heavy lift requirements (for example tanks and artillery pieces) over long distances, TAs of other military transportation units may have to be used. In addition, outsourcing of TAs from national civilian companies or other nations’ may be
required depending on the distances and numbers and sizes of units involved in the deployment.
While time is of essence during a crisis, cost is of main concern during peace time. The source of TAs used affects the cost and timing issues of unit movements. For example, outsourced TAs may not be available on time and leasing costs are associated with them. In addition, unpredictable stochastic events (breakdowns, accidents, delays etc.), load/unload/idle times at home bases/destinations/transfer points need to be taken into account to determine if a so-called feasible or even opti-mal plan of deployment may be realized in actuality.
The planning for a particular deployment contin-gency may take place beforehand. This is called deliber-ate planning when time is not a critical factor. When the time available for planning for actual deployment or em-ployment of armed forces is short, this is called crisis ac-tion planning or time-sensitive planning where the plan-ning process is characterized by quick response, and flexibility to adapt to changing situations. Deliberate and time-sensitive action planning can be interrelated in the sense that deliberate planning contributes to time-sensitive planning. Whether deliberate or not, each deployment plan has a TPFDD which at least includes items’ transportation requirements by type and quantity, and movement data by mode, earliest times of departures from home bases, and earliest and latest times of arrivals at POEs / PODs / destinations. It divides a unit’s compo-nents by transportation mode, ports of embarkation or de-barkation, and movement dates.
4 THE SIMULATION MODEL
We used the Event Graph (EG) methodology developed by Schruben (1983) and improved by Sargent (1988) and Buss (2001) to represent the conceptual and logical mod-els of our simulation. In the EG methodology, nodes rep-resent events and directed arcs reprep-resent the scheduling relationships between events. Dashed arcs represent can-celing relationships. EGs can be used to, simply and ele-gantly, represent any Discrete Event Simulation (DES) model.
LEGO (Listener Event Graph Object) framework is used to create components of our simulation. LEGOs (Buss and Sanchez 2002) are an extension to basic EGs which allow small models to be encapsulated in reusable modules. These modules can be treated as components of other modules. This modular structure is depicted by drawing a box or rectangle around the EG. Modules or components are linked using the listener pattern of Object Oriented Programming which enables production of lar-ger and more complex modules. LEGOs register interest in other LEGOs and take appropriate actions when they “hear” state changes. The LEGO that is listened to is not affected and is not responsible for any actions taken. This
connection is enabled by having events with same name and signature in both components. This “listener” and “listened” relationship is depicted via an arc with a re-versed triangle at one end, resembling a stethoscope. The object at the end of the arc with the reversed triangle is the “listened” object as depicted in Figure 1. This loose-coupling of objects in the simulation allows a great amount of flexibility. EGs and LEGOs can be pro-grammed using Simkit, a Java Application Programming Interface (API) developed at the Naval Postgraduate School and freely available via
<http://diana.nps.edu/Simkit/> . The lis-tener pattern implementation in Simkit is called Simula-tion Event Listener or “SimEventListener” pattern using Simkit’s interface name (Buss 2002, Buss and Sanchez 2002). Simkit, utilizing the same ideas of listener pat-terns, also uses the “PropertyChangeListener” pattern for collecting statistics from a simulation model.
To satisfy the requirement for accurate animation based on real transportation network data (such as the ca-pacities of roads, railways and bridges), our simulation model uses a state-of-the-art Java2™ based, licensed geo-graphical information system (GIS) named GeoKIT, as part of the transportation simulation developed. GeoKIT is an API for manipulating and visualizing 2D/3D raster and vector spatial data. It is written in the Java2™ pro-gramming language and provides a comprehensive set of components to embed GIS functionality into the applica-tions. GeoKIT is open to all types of geographical data and is independent of any particular data format. It achieves high performance mapping and precise geodetic calculations, coordinate transformations and map projec-tions. More information on GeoKIT can be found at
<http://geokit.bilgigis.com>.
Our simulation model, developed using the tools briefly described above, has three main components; Graphical User Interface (GUI), network and model. The GUI component allows, among other things, an accurate animation using real geospatial transportation infrastruc-ture network data analyses require, point-and-click opera-tions of route selection, adding/deleting/changing Home Bases/ Destinations/ POEs/ PODs and entities, and on-the-fly projection of the entire network from WGS 84 to UTM coordinates. The scenario information can be saved in XML format.
The network component allows shortest path selec-tion in route planning. In addiselec-tion, it allows the listing and selection of all routes on land and rail networks whose length (cost) is a user-specified percentage more than the shortest path’s.
The model component has four components; Land, Sea, Rail and Air. Each of these has three subcompo-nents. There are components, or Java classes, modeling the transportation assets (e.g., trucks, ships, airplanes) of different capacities and modes. The loads of different
sizes and military hardware that need to be transported (such as tanks, generators, and field artillery guns) are also modeled. Our simulation model currently has 84 Java classes, which will increase as additional features are added, and around 12000 lines of code.
The subcomponents in the model component are con-nected via LEGOs and SimEventListener frameworks. 4.1 SimEventListener Pattern for Land and Sea
Components
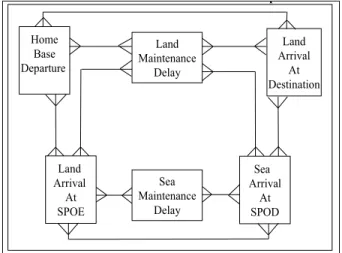
The Land and Sea components and their subcomponents are connected as depicted in Figure 1.
p Home Base Departure Land Maintenance Delay Land Arrival At Destination Sea Arrival At SPOD Land Arrival At SPOE Sea Maintenance Delay
Figure 1: The SimEventListener pattern for land and sea components.
A unit departing its Home Base may directly go to its destination or arrive at a Sea Port of Embarkation (SPOE) to load its items onto a ship. After arrival by sea at a Sea Port of Debarkation (SPOD), the items will be unloaded and the unit will travel by land to its destination. Every time land transportation assets are used, maintenance de-lays may occur. These are modeled in the Land Mainte-nance Delay subcomponent. The delays due to break-down of equipment and road traffic accidents are taken into account and the arrival time of the unit at its destina-tion is updated accordingly. A similar situadestina-tion is true for sea transportation assets departing a SPOE and arriving at a SPOD and vice versa. In order for two subcomponents to listen to each other, they both need to have events with same name and signature. The same listener pattern ex-plained above is true for SimEventListener pattern for Land and Rail components and the SimEventListener pattern for Land and Air components.
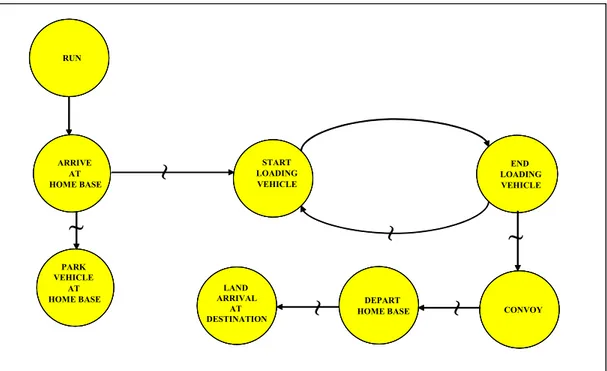
4.2 Home Base Departure Subcomponent
Home Base Departure subcomponent simulates the load-ing of vehicles at their home bases, formload-ing of convoys
and their departure. The movements are conducted in convoys either to the destination or the next mode change location (transfer point) which can be a SPOE, a RPOE, or an APOE. Vehicles that do not need to make addi-tional trips simply park at their home bases. The simpli-fied event graph for this class is in Figure 2. Also note that the arrival events at SPOE, RPOE and APOE are omitted from this event graph to keep it simple for presen-tation purposes. The Run event in Figure 2 is used to schedule the first events (initial population of the event list) such as assigning movers (Trucks, Ships, Trains etc.) to their respective initial locations and also to specify ear-liest times of departures for the movers from their home bases. In addition, the parameters and state variables of the event graphs are not shown for sake of simplicity. 4.3 Land Maintenance Delay Subcomponent
Land Maintenance Delay subcomponent simulates possi-ble causes of delay that may take place during the land movement of a convoy from its home base to its destina-tion. In addition, the delays that may occur during land movement from the transfer points SPOE, APOE or RPOE, (SPOD, APOD, or RPOD) to the home base (des-tination) are also taken into account in the same class. The simplified event graph for this class is provided in Figure 3. The possible causes of maintenance delay are minor, medium, severe breakdowns in land transportation assets and road traffic accidents. Only minor breakdown case during travel from a home base to a destination is depicted in Figure 3.
The probabilities of breakdown are different for each type of land vehicle and they are obtained from the Turk-ish Army Logistics Directorate. The most probable loca-tions of road traffic accidents are determined according to the historical data of so-called “black spots” on Turkey’s roads. The data is obtained from
<http://www.kgm.gov.tr/asps/trafik/kar anokta.htm> and incorporated into the GIS. The probabilities of traffic accidents for these locations are ob-tained from a report prepared by the Turkish General Di-rectorate of Highways for the years 1997-2002.
The simplified event graph in Figure 3 states that if a minor breakdown occurs during travel from a Home Base to a Destination, then the arrival event to destination is cancelled (the dashed arc) and after a delay time of main-tenance obtained from a probability distribution, the arri-val at destination is rescheduled. In a similar way, there are also possibilities of additional types of breakdown (medium and severe) and accidents when a convoy is on its way from its home base to its destination, or when it is on its way from an intermediate location such as SPOE, APOE or RPOE (SPOD, APOD, or RPOD) to its home base (destination). Certainly, there is the possibility of not having any problems while en route, and it is also
in-corporated into our model. Anytime land transportation assets are used, breakdowns and road traffic accidents are possible to occur. However, the events of LandArri-valAtSPOE(RPOE, APOE), LandArrivalAtSPOD(RPOD, APOD), DepartSPOE(RPOE, APOE), Depart-SPOD(RPOD, APOD), DepartDestination, Arrive-AtHomeBase, Medium(Major) Breakdown, RoadAcci-dent and the canceling arcs for LandArrivalAtSPOE(RPOE,APOE), LandArri-valAtSPOD (RPOD,APOD) and ArriveAtHomeBase are omitted from Figure 3 to keep the presentation simple. 4.4 Land Arrival Destination Subcomponent
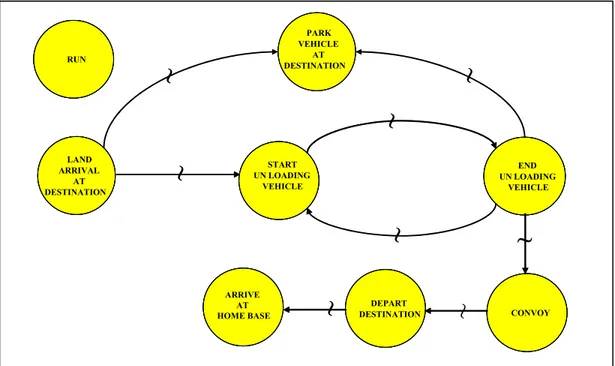
Land Arrival Destination subcomponent simulates the ar-rivals of convoys to their designated destination locations, unloading of the vehicles at destinations and forming of convoys and their departures to bring the remaining items of the unit (from their designated Home Bases, SPODs, RPODs or APODs) if additional trips are required. Oth-erwise, the vehicles park and stay at their destination loca-tions until a next order for movement is given. If the ve-hicles are not carriers (e.g. tanks), they will also park and stay there upon reaching the destination. The event graph for the Land Arrival Destination subcomponent is pro-vided in Figure 4. The VehicleArrivalAtSPOD(RPOD, APOD) events scheduled by DepartDestination event are not included in Figure 4 to keep the presentation simple.
The more complicated event graphs for subcompo-nents of the Sea Component (namely, Land Arrival At SPOE, Sea Maintenance Delay and Sea Arrival At SPOD) and subcomponents of Air and Rail Components are not included in this paper due to page constraints.
4.5 Animation
The implementation of animation in our simulation is per-formed by periodically scheduling a single recurring event called “Ping”. A component called “PingThread” simply puts “Ping” events into the event list with deter-ministic time between occurrences. When the “Ping” event is heard by “Simulation” subcomponent of model component, it updates the locations of mover objects and the “GUIMain” subcomponent of GUI component re-paints the icons of mover objects on the map view. A screenshot of a simple implementation of this is in Figure 5. A detailed treatment of simple movement and anima-tion in DES is presented in Buss and Sanchez (2005). 4.6 Verification and Validation
Verification and validation were conducted by using ap-propriate methods explained in Sargent (2001) and Balcı (1998). To mention a few more specifically, for face va-lidity, we have discussed inputs and outputs of the model
and its EGs with potential users of the model and person-nel at Transportation Coordination Center of the General Staff. We used assertion checking to verify that the model functioned within its acceptable domain. Incre-mentally, bottom-up testing was performed, where each individual submodel was tested and integrated. Fault (failure) insertion testing was used to test whether the model responded by producing an invalid behavior given the faulty component. During special input testing, we used an arbitrary mixture of minimum and maximum val-ues, and invalid data for the input variables, and tested for potential peculiar situations at the boundary values. In addition, we have tested the validity and behavior of the model under extreme workload and congestion at the load/unload docks and transfer points such as SPOEs, SPODs etc. Animation also helped in discovering errors during model development. Furthermore, results of the deployment optimization model developed by Akgün and Tansel (2007) were used for verification purposes. Simu-lation results were compared to the historical deployment data obtained from the Scientific Decision Support Center of the General Staff.
5 CONCLUSIONS AND FUTURE WORK
In this paper, we have presented our on-going work in de-veloping a simulation model for military deployment that will help estimate whether a given plan of deployment will go as intended and determine potential problem ar-eas. EGs and LEGOs provided a simple yet powerful and elegant way of representing DES model of deployment and enabled easy creation of component-based models of a real-life problem. We are in the process of conducting an analysis of a large scale intra-theater deployment using Latin Hypercube Sampling as described in Kleijnen et al. (2005). We plan on improving the cumbersome output and output analysis related parts of our simulation model.
Figure 2: Home base departure subcomponent.
Figure 3. Land maintenance delay subcomponent.
ARRIVE AT HOME BASE END LOADING VEHICLE START LOADING VEHICLE
~
~
~
RUN CONVOY DEPART HOME BASE~
PARK VEHICLE AT HOME BASE~
~
LAND ARRIVAL AT DESTINATION ARRIVE AT HOME BASE END LOADING VEHICLE START LOADING VEHICLE~
~
~
RUN CONVOY DEPART HOME BASE~
PARK VEHICLE AT HOME BASE~
~
LAND ARRIVAL AT DESTINATIONFigure 4. Land arrival destination subcomponent.
Figure 5. A screenshot of road and rail networks.
LAND ARRIVAL AT DESTINATION END UN LOADING VEHICLE START UN LOADING VEHICLE
~
~
~
RUN CONVOY DEPART DESTINATION~
~
~
PARK VEHICLE AT DESTINATION~
~
ARRIVE AT HOME BASE LAND ARRIVAL AT DESTINATION END UN LOADING VEHICLE START UN LOADING VEHICLE~
~
~
RUN CONVOY DEPART DESTINATION~
~
~
PARK VEHICLE AT DESTINATION~
~
ARRIVE AT HOME BASEACKNOWLEDGMENTS
The authors would like to thank Mr. Erhan Çınar and Mr. Murat Durmaz of BilgiGIS Ltd. of Ankara, Turkey for sharing their expertise in GIS, providing guidance and help in integrating their GIS software, GeoKIT, with our simulation model.
REFERENCES
Akgün, İ. and B. Tansel. 2007. Optimization of Transpor-tation Requirements in the Deployment of Military Units. Computers and Operations Research 34(4): 1158–1176.
Balcı, O. 1998. Verification, validation, and testing. In Handbook of Simulation, ed. J. Banks, 335 – 393. Boukhtouta, A., A. Bedrouni, J. Berger, F. Bouak, and A.
Guitouni. 2004. A survey of military planning
sys-tems. Available via
<http://www.dodccrp.org/events/9th_ ICCRTS/CD/papers/096.pdf> [accessed De-cember 15, 2006].
Burke, J. F., R. J. Love, and C. M. Macal. 2004. Modeling force deployments from army installations using the Transportation System Capability (TRANSCAP) model: a standardized approach. Mathematical and Computer Modelling, 39(6-8): 733-744.
Buss, A. 2001. Basic event graph modeling. Simulation News Europe, 31:1-6.
Buss, A. 2002. Component-based simulation modeling using Simkit. In Proceedings of the 2002 Winter Simulation Conference, ed., E. Yücesan, C.-H. Chen, J. L. Snowdown, and J.M. Charnes, 243-249. Insti-tute of Electrical and Electronics Engineers, Piscata-way, New Jersey.
Buss, A. H. and P. J. Sanchez. 2002. Building complex models with LEGOs (Listener Event Graph Objects). In Proceedings of the 2002 Winter Simulation Con-ference, ed., E. Yücesan, C-H. Chen, J. L. Snowdon, and J. M. Charnes, 732-757. Institute of Electrical and Electronics Engineers, Piscataway, New Jersey. Buss, A. H. and P. J. Sanchez. 2005. Simple movement
and detection in discrete event simulation. In Pro-ceedings of the 2005 Winter Simulation Conference, ed., M. E. Kuhl, N. M. Steiger, F. B. Armstrong, and J. A. Joines, 992-1000. Institute of Electrical and Electronics Engineers, Piscataway, New Jersey. Groningen, C. N. V., D. Blachowicz, M. D. Braun, R. J.
Love, K. L. Simunich, and M. A. Widing. 2005. Modeling military deployment in theaters of opera-tions – balancing deployment alternatives. Available via
<http://www.dis.anl.gov/temps/Logist
icsSpec-trum.ELIST.MergedFigures.8Aug05.pdf > [accessed December 15, 2006].
Gunshenan, J., G. Kratkiewicz, and R. Cashon. 1997. In-tegrated consumable item support (ICIS) model.
Available via
<http://ms.ie.org/SIW_LOG/97S/97S-SIW-170.doc> [accessed December 15, 2006]. Heal, G.N. and I. K. Garnett. 2001. Allied deployment
and movement system (ADAMS) version 3.0 tutorial. Technical note 669, NATO consultation, Command and Control Agency, The Hague.
Howard, D. L., M. J. Bragen, J. F. Burke, Jr., and R. J. Love. 2004. PORTSIM 5: Modeling from a seaport level. Mathematical and Computer Modelling, 39(6-8): 715-731.
Kleijnen, J. P. C., S. M. Sanchez, T. W. Lucas, and T. M. Cioppa. 2005. A user’s guide to the brave new world of simulation experiments. INFORMS Journal on Computing 17(3): 263-289.
Krause, L. C. and D. J. Parsons. 1999. Tactical logistics and distribution system (TLOADS) simulation. In Proceedings of the 1999 Winter Simulation Confer-ence, ed. P. A. Farrington, H. B. Nembhard, D. T. Sturrock, G. W. Evans, 1174-1178. Institue of Elec-trical and Electronics Engineers, Piscataway, New Jersey.
McKinzie, K. and W. J. Barnes. 2003. A review of strate-gic mobility models supporting the defense
transpor-tation system. Available via
<http://www.me.utexas.edu/~barnes/r esearch/files/update_06_2003/RSMMSD TS.pdf> [accessed December 15, 2006].
Sabuncuoğlu, İ and H. D. Utku. 2002. Evaluation of army corps artillery ammunition supply systems via simu-lation. In Proceedings of the 2002 Winter Simulation Conference, ed., E. Yücesan, C-H. Chen, J. L. Snow-don, and J. M. Charnes, 917-920. Institute of Electri-cal and Electronics Engineers, Piscataway, New Jer-sey.
Sargent, R. G. 1988. Event graph modeling for simulation with an application to flexible manufacturing sys-tems. Management Science 34(10): 1231-1251. Sargent, R. G. 2001. Some approaches and paradigms for
verifying and validating simulation models. In Pro-ceedings of the 2001 Winter Simulation Conference, ed., B. A. Peters, J. S. Smith, D. J. Mederios, and M. W. Rohrer, 106-114. Institue of Electrical and Elec-tronics Engineers, Piscataway, New Jersey.
Schruben, L. 1983. Simulation modeling with event graphs. Communications of the ACM 26(11):957-963.
AUTHOR BIOGRAPHIES
UĞUR ZİYA YILDIRIM is a Major in the Turkish Army. He received his B.S. and M.S. in Operations Re-search from the U.S. Military Academy in 1991 and from the Naval Postgraduate School in 1999 respectively. He is currently a Ph.D. candidate at the Department of Indus-trial Engineering at Bilkent University in Ankara, Turkey. His e-mail address is <[email protected]>. İHSAN SABUNCUOĞLU received his Ph.D. degree in Industrial Engineering from the Wichita State University. Prof. Sabuncuoğlu teaches and conducts research in the areas of simulation, scheduling, AI, and manufacturing systems. He has been a visiting professor at the Wichita State. He has published papers in IIE Transactions, Deci-sion Sciences, International Journal of Production Re-search, Simulation, Journal of Manufacturing Systems, International Journal of Flexible Manufacturing Systems, International Journal of Computer Integrated Manufac-turing, Computers and Operations Research, European Journal of Operational Research, Journal of Operational Research Society, Computers and Industrial Engineering, International Journal of Production Economics, Journal of Intelligent Manufacturing, OMEGA-International Journal of Management Sciences, and Production Plan-ning and Control. Honors Societies; Alpha Pi Mu (Na-tional Industrial Engineering Honor Society). Prof. Sabuncuoğlu is the chairman of the Industrial Engineering Department. His e-mail address is
BARBAROS TANSEL received his Ph.D. degree in In-dustrial and Systems Engineering from the University of Florida, Gainesville (U.S.A.) in 1979. Prior to his ap-pointment at Bilkent, he has served as a faculty member at the Middle East Technical University, Georgia Institute of Technology, and the University of Southern California. He has been a faculty member of the Department of In-dustrial Engineering at Bilkent University since 1991. His primary research interests are in network location theory, location and layout optimization, theory of optimization with imprecise data, hub location modeling and optimiza-tion, and logistics system design. Prof. Tansel’s research articles have been published in Management Science, Op-erations Research, Transportation Science, IIE Transac-tions, Journal of the Operational Research Society, Euro-pean Journal of Operational Research, International Journal of Production Research, and Journal of Manufac-turing Systems. His e-mail address is