THE EFFECTS OF MILITARY EXPENDITURES ON TURKISH ECONOMY: A GENERAL EQUILIBRIUM MODEL ANALYSIS
The Institute of Economics and Social Sciences of
Bilkent University
by
SERVET AYA
In Partial Fulfillment of the Requirements for the Degree of MASTER OF BUSINESS ADMINISTRATION
in
THE DEPARTMENT OF MANAGEMENT BİLKENT UNIVERSITY
ANKARA
I certify that I have read this thesis and have found that it is fully adequate, in scope and in quality, as a thesis for the degree of Master of Business Administration.
---
Assistant Professor Levent AKDENİZ Supervisor
I certify that I have read this thesis and have found that it is fully adequate, in scope and in quality, as a thesis for the degree of Master of Business Administration.
--- Professor Erinç YELDAN Examining Committee Member
I certify that I have read this thesis and have found that it is fully adequate, in scope and in quality, as a thesis for the degree of Master of Business Administration. .
---
Associate Professor Süheyla ÖZYILDIRIM Examining Committee Member
Approval of the Institute of Economics and Social Sciences.
--- Professor Erdal EREL Director
ABSTRACT
THE EFFECTS OF MILITARY EXPENDITURES ON TURKISH ECONOMY: A GENERAL EQUILIBRIUM MODEL ANALYSIS
Aya, Servet
M.B.A., Department of Management Supervisor: Asst. Prof. Levent Akdeniz
July 2005
The purpose of this thesis is to investigate the effects of military expenditures over the period of 1980-2000, in Turkey. The analysis is conducted by the aid of computable general equilibrium model borrowed from Yeldan. Extending the model so as to include the military expenditures, major impacts of military spending on the macro economic variables of Turkey are tried to be observed.
The model examines the effects of military expenditures under two main headings: (i) impact of military expenditures when expenditures are cut to the 3% GDP share assuming Turkey followed NATO’s military expenditure policy after 1988 (ii) impact of military expenditures due to the increasing volume of conflict and armament expenditures coming with it, pushing the level of expenditures to 7% GDP share.
The model suggests substantial economic effects which are in opposite direction with the military expenditures. Especially, in government savings and investment, significant
contradiction is observed. Other macro economic variables such as GDP, disposable income, exports and imports are in accordance with the movement in savings and investment.
Keywords: Military Expenditures, General Equilibrium Model, Macro Economic Effects.
ÖZET
ASKERİ HARCAMALARININ TÜRK EKONOMİSİ ÜZERİNE ETKİLERİ: GENEL DENGE MODELİ
Aya, Servet
Yüksek Lisans Tezi, İşletme Fakültesi Tez Yöneticisi: Asst. Prof. Levent Akdeniz
Temmuz 2005
Bu çalışmanın amacı, 1980-2000 yılları arasında ki dönemde askeri harcamaların Türk ekonomisi üzerinde ki etkilerini araştırmaktır. Analizler, Erinç Yeldan’dan alınan genel denge modeli yardımıyla yapılmaktadır. Model askeri harcamalarıda içine alacak şekilde genişletilerek, askeri harcamaların Türkiyenin makro ekonomik değişkenleri üzerinde ki başlıca etkileri gözlemlenmeye çalışılmaktadır.
Model başlıca iki başlık altında askeri harcamaların etkilerini incelemektedir:(i) Türkiyenin 1988’den sonrasında da NATO’nun askeri harcamalar politikasını devam ettirdiğini varsayarak, askeri harcamalarının %3 toplam yerel üretim oranına kesildiğinde askeri harcamaların etkileri(ii) harcamaların seviyesini %7 toplam yerel üretim oranına iten, artan çatışma ortamına ve bununla beraber gelen silahlanma harcamalarına karşılık askeri harcamalarının etkileri.
Model askeri harcamalarla ters yönde çok önemli ekonomik etkiler sunmaktatır. Özellikle, devlet tasarrufunda ve yatırımlarında önemli zıtlıklar gözlenmiştir. Diğer;
toplam yerel üretim, kullanılabilir kazançlar, ithalat ve ihracat değerleri gibi makro ekonomik değişkenler tasarruf ve yatırımlardaki hareketlerle uyum halindedir.
ACKNOWLEDGMENTS
I am very grateful to Prof. Erinç Yeldan for his guidance, comments, help and patience during my study. I also wish to express my thanks to Asst. Prof. Levent Akdeniz and committee member Assoc. Prof. Süheyla Özyıldırım for their comments, contributions and helps.
I have always felt my parent; my wife, Gamze, and my brother, Selçuk, behind me throughout the study. I am very grateful to them for their patience and support.
TABLE OF CONTENTS
ABSTRACT ... iii
ÖZET ... v
ACKNOWLEDGMENTS... vii
TABLE OF CONTENTS ... viii
LIST OF TABLES ………... x
LIST OF FIGURES ……… xi
CHAPTER I: INTRODUCTION ... 1
CHAPTER II: ECONOMIC EFFECTS OF TERRORISM AT REGIONAL BASIS... 6
CHAPTER III: GENERAL STRUCTURE AND DIMENSIONS OF MODEL... 11
3.1 General……….. ... 11
3.2 Price system ... 12
3.3 Production Technology ... 13
3.4 Trade………... 13
3.5Income Generation and Fiscal Balances ………... 15
CHAPTER IV: SIMULATIONS OF DEFENSE EXPENDITURES... 17
4.1 Experiment 1……….. 17
4.3 Experiment 3……….………. 23 CHAPTER V: SUMMARY AND CONCLUSION………... 28 SELECT BIBLIOGRAPHY... 31 APPENDICES
A. MATHEMATICAL EQUATIONS OF THE MODEL... 34 B. SOCIAL ACCOUNTING MATRIX ... 40
C. TURKEY’S AND NATO’S MILITARY EXPENDITURES AS A RATIO OF GDP ………. 42
LIST OF TABLES
1. Macro Economic Indicators: Experiment 1………... 18
2. Sectoral Economic Indicators: Experiment 1... 18
3. Macro Economic Indicators: Experiment 2 …... 20
4. Sectoral Economic Indicators: Experiment 2……….. 21
5. Macro Economic Indicators: Experiment 3 ……… 25
6. Sectoral Economic Indicators: Experiment 3……….. 25
LIST OF FIGURES
1. Production of Area Sown and Harvested……... 7
2. Number of Livestock... 7
3. Fruit Production………... 7
4. Milk Production………. 8
5. Meat Production………. 8
6. Number of Small and Medium Sized Enterprises……….. 9
7. Number of Workers……… 9
CHAPTER 1
INTRODUCTION
Military expenditures are crucial in ensuring the national defense and security while the inefficiencies and imprudent use of scarce recourses of economy will undermine the security and broader national interests. Defense posture is a strategic concept and influenced by government’s national security and foreign policy. Government and military administration together choose the defense posture of nation which can be one of offensive posture, defense through regional defense cooperation, defense through alliances or self defense etc. In that sense how much of public goods is allocated to defense spending is political issue and outside of our view. Despite that fact, I believe it is important to know what macro economic effects appear as a result of fluctuations in the level of commitment to military spending. In this thesis we search for the effects of military expenditures over the period of 1980-2000.
When the military expenditures of Turkey over the two decades, 1980-2000, are examined it can be seen that they get into the track slowly but with a continuously increasing trend after 1988. However, when the military expenditures of NATO of which Turkey is member are scrutinized, one can see the substantial discrepancy in comparison of their military expenditure policies after that date. Although Turkey moves together with NATO members in its military expenditure policy until 1988, after this date Turkey
its military expenditures in GDP is 3% in 1988, it reaches 5% at the beginning of 2000s. On the other hand, NATO continues to follow its decreasing military expenditure policy pulling to 2.03% GDP on average at the beginning of 2000s. This difference in their military expenditure policies can be seen from the figure in Appendix C.
There is another member country beside Turkey which increases its military expenditures while the ratio of military expenditures to GDP decreases in NATO; this country is Greece. However, Greece, starting from 1996, gets into the trend of increasing its defense expenditures, leaving from the general strategy followed in NATO. Still, none of the members of NATO except these two gets into the trend of increasing its military expenditures while average level of NATO military expenditures decrease after 1996. The first question that comes into the mind is ‘Can the reason be arm race between Turkey and Greece in increasing military expenditures.’
To the present, many studies were made to model and test the existence of arms race between Greece and Turkey. Some of them, for instance, Georgiou and et al.(1996) found little evidence of an arms race in their study ‘Modeling Greek-Turkish rivalry’ while some of them, for instance, Kollias and et al.(1997) found strong evidence of an arms race between Greece and Turkey in their study ‘Is there a Greek-Turkish arms race?’. However, as from 1988, substantive break occurs; as can be observed from the figure in Appendix C depending on the data taken from SIPRI Yearbooks (1987-2004), whereas Turkey’s military expenditures as a share of Turkey’s GDP continues to rise, other NATO member countries including Greek continues to decline or to stay stable so that the discrepancy between Turkey and other members grows in favor of Turkey. As Brauer (2002:90) stated in his study ‘Survey and Review of The Defense Economics Literature
on Greece and Turkey’, I believe ‘if there was an arms race, it stopped in 1985’.
Under the political and historical process, something peculiar to Turkey, something non-NATO and non-Greek security concern must be there inducing its military expenditures push up. Starting from 1984 Turkey was faced to cope with PKK terrorism which prevailed especially in its east and south east regions. Increasing its intensity, PKK reached its peak level between 1992 and 1995 and then started to lose its power. However; not yet being totally defused, it still stays in front of Turkey as a threat and possible cause to increase the military expenditures. Some exceptions (Sezgin, 1998; Chletsos and Kollias, 1995) indicated the impact of this security issue on the increasing military expenditures. However, nobody did present a detailed study of this issue.
In almost every field of life Turkey felt the results associating with terrorism; from political to economical, from social to daily life. Many books were written regarding this issue. ‘Kürtler, PKK ve Abdullah Öcalan’, ‘Türkiye’de Düşük Yoğunluklu Çatışma ve PKK’ are a few of them narrating the political aspects of PKK terrorism and their results on Turkey. Journalist Mater (1998) wrote ‘Mehmedin Kitabı’ narrating the interviews made with citizens who did their military services in east and south east regions during the terrorist activities of PKK. This book found very large place in Turkish and World media for a very long time. Çiftçi (1999), who had been once member of terrorist organization, wrote his memories in ‘Girdap’ after surrendering to security forces. Almost every day journalist carried the events and their results to their columns. Dörtkardeş (1997), in his article ‘Teröre Kanlı Bilanço: 17 Yılda 32 bin Kişi Öldü’, states that 4 239 people from security forces and 4 276 citizens were killed since 1984 when PKK started its terrorist activities making raids on Eruh and Şemdinli. In his writing,
based on declarations of Human Rights Ministry, he indicates the other reflections of terrorism such as ‘closure of 3 223 schools in 22 cities, assassination of 156 teachers, evacuation of 809 villages and 1612 hamlets, limitations of investment in east and south east region and spending of 20 billion dollar to combat terror, according to declarations of Human Rights Ministry’. Many countries, such as Germany, France, United States of America, acknowledged the PKK, with its new name KADEK, as terrorist organization. PKK found its place many times as terrorist organization in annually broadcasted terror list of US, ‘Country Terror Reports’, last issued on April 28, 2005. In order to see the major economic results PKK terrorism caused, we made a research on the regional basis in the second part of thesis.
However, whatever the reason be behind the shift from alliance defense strategy towards self defense concept, increasing military expenditures, in this study we try to evaluate the effects of military expenditures. That is true that there are many researches made on the impacts of Turkey’s military expenditures on its economic variables. For instance; nature of military expenditure related employment in arm forces, civil forces and in the industries that supply defense materials, was investigated by Yıldırım and Sezgin (2002), causality between the growth of GDP and defense expenditure was tested by Karagol and Palaz (2003). Special issue of 5th International Conference on Defense Economics (2001) has focused on the economic impacts of arms race and increasing military expenditures. However to my knowledge this study is the first trying to understand the major economic impacts of increasing military expenditures using general equilibrium model.
utilized to model the economic implications of custom union, IMF programs and fiscal debt policy for Turkey. For instance, Voyvoda and Yeldan (2005) examined macroeconomic effects of IMF-led program in their study ‘IMF Programmes, Fiscal Policy and Growth’, Diao and et al.(1998) modeled the fiscal debt policy in their study ‘Fiscal Debt Management, Accumulation and Transitional Dynamics in a CGE Model for Turkey’.
Similar study was conducted by Roland-Holst and et al. (1988). Reductions in federal expenditures are studied with the help of general equilibrium model. In this study experimental scenarios were based on the reductions due to cost sharing within strategic alliances and unilateral disarmament. In both cases, economic effects of cuts in military expenditures are evaluated and significant results were observed.
In the following section, I provide a review of the major economic results of PKK terrorism in the East and South-East regions of Turkey, afterwards in the third section I introduce the main features of the model, then in the fourth section I will try to see the effects of military expenditures on Turkish economy through increasing and decreasing military expenditures and finally I will state the main points of the process in section five for summary and comments.
CHAPTER 2
ECONOMIC EFFECTS OF TERRORISM AT REGIONAL BASIS
In this section we try to investigate major economic effects of terrorism at the regional basis over the period of 1980-2000. Since terrorist activities mostly covered east and southeast part of Turkey, the emphasis is primarily on these regions. Inputs of the research rest upon the data coming from State Institute of Statistics.
The most important economic variables of interest to see the effects of terrorism on regional and aggregate bases are thought to be area sown and harvested with production and their yield such as cereals, pulses, industrial crops etc., fruits production such as cultivated fruits, stone fruits, citrus etc., number of livestock and their product such as milk product, meat product, hides product and finally number of enterprises and number of workers. The realized values of these variables are important to reflect the direct impact of terrorism on both of the regional and national economy.
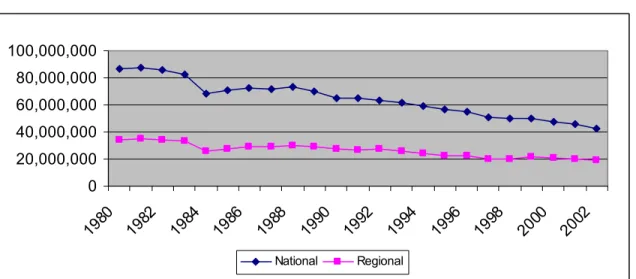
The national and regional productions of area sown and harvested, and number of livestock over 20 years are depicted in figure-1 and figure-2 respectively. As can be observed from these figures, both regional and aggregate values point out the reduction in production while portion of these two regions in aggregate production keeps approximately same level.
10 000 000 20 000 000 30 000 000 40 000 000 50 000 000 60 000 000 1 9 8 0 1 9 8 1 1 9 8 2 1 9 8 3 1 9 8 4 1 9 8 5 1 9 8 6 1 9 8 7 1 9 8 8 1 9 8 9 1 9 9 0 1 9 9 1 1 9 9 2 1 9 9 3 1 9 9 4 1 9 9 5 1 9 9 6 1 9 9 7 1 9 9 8 1 9 9 9 2 0 0 0 2 0 0 1 2 0 0 2 (I n T o n s ) National Regional
Figure 1. Production of Area Sown and Harvested.
0 20,000,000 40,000,000 60,000,000 80,000,000 100,000,000 1980 1982 1984 1986 1988 1990 1992 1994 1996 1998 2000 2002 National Regional
Figure 2. Number of Livestock.
0.00% 5.00% 10.00% 15.00% 20.00% 25.00% 1980 1982 1984 1986 1988 1990 1992 1994 1996 1998 2000 2002 Years P o rt io n o f th e R e g io n s
0.00% 10.00% 20.00% 30.00% 40.00% 50.00% 1980 1982 1984 1986 1988 1990 1992 1994 1996 1998 2000 2002 Years P o ri to n o f th e R e g io n s
Figure 4. Milk Production.
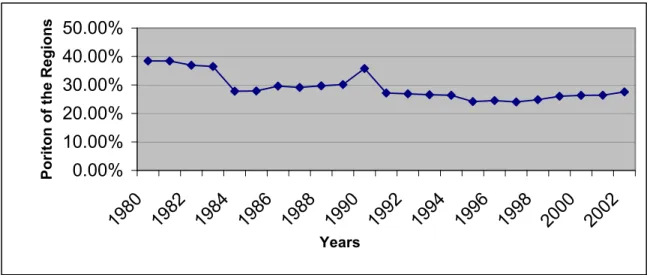
In the figure-3 we also observe significant decline in the portion of regional fruit productions in aggregate production; around 18% in 1980s and around 14% in 1990s. In fact milk production follows the same pattern as displayed in figure-4.
As portrayed in figure-5 the portions of regions in meat production in aggregate production trace out same the level without much discrepancy in their movements although numbers of livestock are in decline.
0.00% 5.00% 10.00% 15.00% 20.00% 25.00% 30.00% 35.00% 1980 1982 1984 1986 1988 1990 1992 1994 1996 1998 2000 2002 Years P o ri to n o f th e R e g io n s
0.00% 2.00% 4.00% 6.00% 8.00% 10.00% 1980 1982 1984 1986 1988Years1990 1992 1994 1996 1998 2000 P o rt io n o f th e R e g io n s
Figure 6. Number of Small and Medium Sized Enterprises.
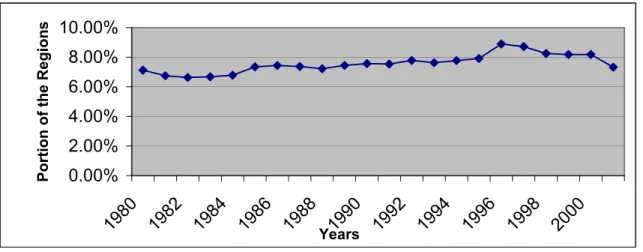
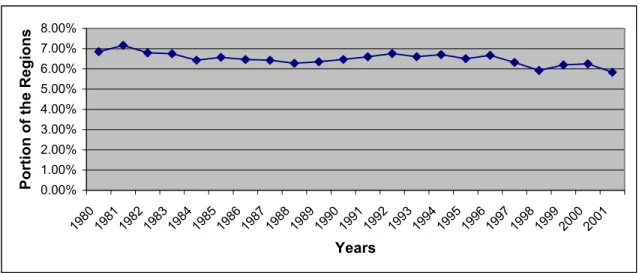
Even though figure-6 indicate slight upward movement in work places proportion of the regions, since most of these places are small scale, in which less than 10 people work, figure-7 and figure-8 depicting the number of people employed in the workplaces and their regional portions is more appropriate to understand the whole picture in employment level. It is evident from figure-7 that the numbers of employed people stay stable during the regarded time period for both of the regional and national variables. Moreover; although numbers of people employed in aggregate increase in general out of the 1987 and 1997, number of workers of the regarded regions still stay stable.
0 200000 400000 600000 800000 1000000 1200000 1400000 1980 1981 1982 19831984 19851986 1987 19881989 19901991 19921993 19941995 1996 19971998 19992000 2001 National Regional
0.00% 1.00% 2.00% 3.00% 4.00% 5.00% 6.00% 7.00% 8.00% 1980198119821983198419851986198719881989199019911992199319941995199619971998199920002001 Years P o rt io n o f th e R e g io n s
Figure 8. Proportion of the Regions in Number of Workers.
Major economic indicators of the region are in decline or at least show no development during terrorist activities in the regions. May the terrorist activities of PKK have triggered the increase in military expenditures in Turkey? At this point, we leave this issue to the scope of other studies. Whatever the reasons are behind the increase in military expenditures, in an attempt to investigate the economic effects of this increase in more detail, we will use CGE model as ‘economics laboratory’ in the following sections.
CHAPTER 3
THE GENERAL STRUCTURE AND DIMENSIONS OF MODEL
3.1. General
Computable General Equilibrium model studied in this paper is an extension of the CGE model for Turkey by Yeldan (2003). The model is extended by military consumption aspect to observe the effects of military expenditures on Turkish Economy. Mainly, it is based on 2-sector open economy model under imperfect substitution in trade, as Yeldan used. Data it utilizes comes from a two-sector aggregation of the Input-Output accounts for Turkish Economy published by the State Institute of Statistics, 2003. Moreover; we use the military expenditures which we took from the SIPRI Yearbook as input to the model defining it government military expenditures over commodities.
2003 Social Accounting Matrix, Yeldan utilized, was tailored so as to include the military expenditures. The distinguishing feature of the new Social Accounting Matrix is the new entry to the cell linking ‘commodities’ and ‘government policies’ as government military consumption in addition to the government consumption on industrial and agricultural commodities. Thus the total government consumption becomes sum of government consumption on commodities and government military consumption.
The theoretical structure of the model is same as used by Yeldan; Walrasian structure focusing on the real economy in which monetary terms are kept out. The main principle
of the model which says that, following the Armingtonian composite commodity system, domestically produced goods and imports in the same category are assumed to be imperfect substitutes is also kept up through our model. Therefore by adding military aspect to the equations without pushing the model into imbalance, we tried to represent the effects of military expenditures on Turkish Economy via simulations binding to the notion that every solution in fact satisfies optimality.
3.2. Price System
Data given in the Social Accounting Matrix are in value terms which reflect the quantities and prices in them. As the model’s main focus is on the real economy in which monetary terms are kept out, setting prices of most commodities as one, at unity, the ‘nominal’ values of the data are assessed as ‘real’ values of quantities for the base year. Therefore data of the Social Accounting Matrix are taken as quantity values measured in base year prices of unity for each.
Assuming small country with an open economy, world prices control domestic market in that world prices are given exogenously. These prices are the prices of imported goods at the border prices. Consumers in the domestic market, who want to buy these goods, have to pay world prices plus tariffs value assuming exchange rates as one. In the same way, the value that consumers of exports in the foreign market have to pay includes the export tax value collected by government.
In that open economy both the consumers and producers have two chances to respond their needs; for consumers either from imports or domestic market, for producers either by exports or domestic sales.
The net revenue left in the hand of producers is called value added price after deducting the intermediate input cost and producer taxes from the output price.
Since value of excess demand in Walrasian system is zero in prices, normalization rule is needed in the system. To respond that need, system is normalized over price index benchmark, using weights for each sector.
3.3 Production Technology
In production output of each sector is assumed to be produced by a single representative firm. The primary inputs of this process consist of two inputs; capital and labor. The relationship between output and inputs is expressed by the help of Cobb-Douglas production function. This function is special case of CES technology in which elasticity of substitution between capital and labor is one.
Supply of capital is endogenous and time-dependent while supply of labor is exogenous and time-independent. Demand for labor and capital is such that it should be equal to aggregate supply for each.
In order to maximize the profit, the value of the marginal product of labor and capital is equated to wage rate and capital rate respectively. From these equations suppliers of labor and capital take certain proportions as their wages and capitals for next production activity respectively.
3.4 Trade
In multi-sector models, many sectors can both export and import within the same good category simultaneously so that homogeneity assumption is not proper. This
problem is solved by the application of Armington composite commodity system in which the notion of not only each good different from other but also their place of production differentiates each one, prevails in the market. Domestically produced goods and imports in the same category are assumed to be imperfect substitutes in this two-sector open economy model and two-way trade is represented to overcome this problem.
It is possible to see the effects of imperfect substitutability in every activity. Producers are thought to maximize their revenues by allocating their outputs to both markets; domestic and foreign, being subject to CET function transformation technology. Determination of exports is portrayed in figure-10. Combination of supply to domestic market, DC and export, E form the concave transformation possibilities. Producers faced with a relative export-domestic good price ratio (PE/PD), maximizes its revenues by allocating their outputs to export at E. If the relative price of export to domestic ratio increases to (Pe/Pd), say, by decreasing export taxes, sectoral exports increase to e.
Domestic Good Domestic Good
m M PE/PD Pe/Pd Pm/Pd PM/PD e E Imports Exports
Like producers, demanders are considered to maximize their revenues but this time by trying to minimize their costs by buying from both markets; domestic and foreign, by being subject to CES composite commodity technology elasticity of substitution.
Determination of imports is depicted in figure-9. Combinations of domestic good, DC and sectoral imports, M are given along the convex consumption possibility. Consumers faced with a relative import-domestic good price ratio (PM/PD), minimizes their costs by buying imports at M If the relative price of import to domestic ratio increases to (Pm/Pd), say, by increasing tariffs, sectoral imports decrease to m.
3.5 Income Generation and Fiscal Balances
Private aggregate income is generated through incomes from factor services plus income from government transfers of its tax revenues and finally exogenous income/expenditure on lending/borrowing from abroad. Private savings are determined through fixed saving propensity parameter which is derived from the 2003 Social Accounting Matrix, after deducting household taxes. The difference between income and saving is spent on household consumption at the proportion of sectoral consumption shares.
Military consumption and government consumption are captured by fixed consumption shares which are derived from the 2003 Social Accounting Matrix.
Government revenue consist of household taxes, social security taxes levied on labors, tariffs from imports, export taxes from exports, production, sale and corporate taxes imposed on the producers by government. On the other hand, government saving is value left by government after the deduction of consumption on goods, on military
services, transfers of tax revenues to households and payments to abroad from the total revenues. Nevertheless, public and private investments are determined at the rate of investment demand shares for each sector as realized in 2003 Social Accounting Matrix. The difference between the government investment and saving is public investment saving deficit which has to be covered with foreign borrowing that should be equal to the trade gap between imports and exports.
Gross Domestic Product is calculated as total of expenditures spent on output goods as private consumption, government consumption, and income/expenditures from trade and expenditures spent on services as military and investment.
Finally to keep the market at equilibrium Walras equation is used stating that total saving should be equal to total investment. In addition to Walras equation, commodity balance and account balance are used to ensure the market equilibrium. Commodity balance indicates the balance between sum of consumption demands, investment demands, intermediate good demand and supply of composite good; account balance indicates the balance between sum of imports value, net private factor payments to abroad, foreign interest payments to abroad and sum of the exports value, net private factor incomes from abroad and foreign savings.
Up to now the expression of distinguishing features of the model is provided. Now we can turn to the applications of these features through 2003-2007 in the next sections.
CHAPTER 4
SIMULATIONS OF DEFENSE EXPENDITURES
In this section we try to analyze the effects of variations in the level of defense expenditures on Turkish economy through simulations. At the beginning, it is important to note that, knowing that it is impossible to reflect the real life in one-to-one basis; our main focus is on the variables which are more important for our purpose. At this point the most important variables we will need to look for are gross national product, fiscal balances, foreign trade transactions and macro aggregates such as investment, consumption and savings. In order to see the effects of variations in the level of defense expenditures on Turkish economy simulation exercises are carried out in three steps according to assumed scenarios.
4.1 Experiment 1
In the first scenario we make no intervention and carry out the simulation through the data as given in 2003 Social Accounting Matrix. Here algebraic equations are calibrated to base-year data set, values of various share and shift parameters of the algebraic equations are calculated to replicate the base-year data set as base year solution. Then assuming the realized share and shift parameters and ratios of consumption, saving and investment are kept as given policy instruments, population growth rates over the time
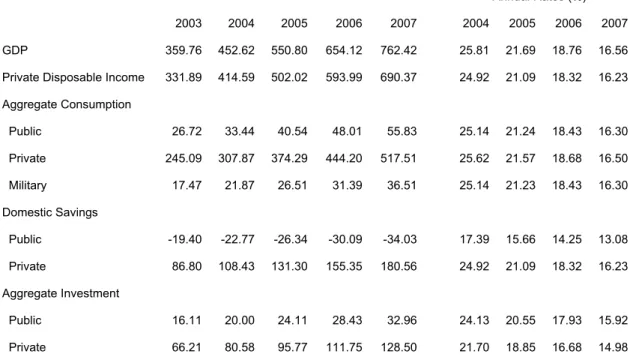
Table 1. Macro Economic Indicators: Experiment 1.
Annual Rates (%) 2003 2004 2005 2006 2007 2004 2005 2006 2007 GDP 359.76 452.62 550.80 654.12 762.42 25.81 21.69 18.76 16.56 Private Disposable Income 331.89 414.59 502.02 593.99 690.37 24.92 21.09 18.32 16.23 Aggregate Consumption Public 26.72 33.44 40.54 48.01 55.83 25.14 21.24 18.43 16.30 Private 245.09 307.87 374.29 444.20 517.51 25.62 21.57 18.68 16.50 Military 17.47 21.87 26.51 31.39 36.51 25.14 21.23 18.43 16.30 Domestic Savings Public -19.40 -22.77 -26.34 -30.09 -34.03 17.39 15.66 14.25 13.08 Private 86.80 108.43 131.30 155.35 180.56 24.92 21.09 18.32 16.23 Aggregate Investment Public 16.11 20.00 24.11 28.43 32.96 24.13 20.55 17.93 15.92 Private 66.21 80.58 95.77 111.75 128.50 21.70 18.85 16.68 14.98
Table 2. Sectoral Economic Indicators: Experiment 1
Annual Rates (%) 2003 2004 2005 2006 2007 2004 2005 2006 2007 Exports Agricultural Goods 3.81 4.91 6.09 7.34 8.67 28.90 24.03 20.62 18.11 Industrial Goods 94.69 120.18 147.12 175.45 205.13 26.92 22.41 19.26 16.91 Imports Agricultural Goods 3.90 4.81 5.78 6.79 7.85 23.59 20.09 17.52 15.56 Industrial Goods 107.44 133.35 160.76 189.60 219.83 24.12 20.55 17.94 15.94 Output Prices Agricultural Goods 1.00 0.99 0.98 0.98 0.97 -1.00 -0.71 -0.71 -0.51 Industrial Goods 1.00 1.00 0.99 0.99 0.99 -0.50 -0.30 -0.20 -0.20 Value Added Prices
Agricultural Goods 0.60 0.60 0.59 0.59 0.58 -1.16 -0.84 -0.84 -0.51 Industrial Goods 0.47 0.47 0.47 0.47 0.47 -0.42 -0.21 -0.21 -0.21
span of 2004-2007 are fed into the model assuming economic growth is linked only with the increase in population and capital. Thus base-run values are achieved. In this first experiment Turkey spent 4.9% of its GDP or 17,473 billion YTL in 2003.
The macro economic and sectoral values of this experiment are documented in table-1 and table-2 along with their annual rates. The results indicate that there is significant increase in the level of GDP from 359.76 in 2003 to 762.42 in 2007 although this augmentation is obtained by decreasing annual rates. All the macro economic aggregates and sectoral aggregates except public savings, which also follows the trend but in negative direction from -19.40 in 2003 to -34.03 in 2007, follow the GDP.
Variables pertinent to the prices indicate slight changes, decreases in the level of prices. We observe that, even tough values of aggregate exports are close to those of imports, the annual rates of exports are a little bit higher than those of imports in both sectors. This is consistent with the decreases in the output prices.
4.2 Experiment 2
In the second scenario the structure used in the first experiment is followed with only one change. This change draws the ratio of military expenditures to GDP back to 3% level which was seen in 1988. In this case, we try to observe the effects of decreasing military expenditures over the time span 2004-2007 by changing the ratio. The reasoning behind this scenario is that ‘what would have possibly happened if Turkey had followed NATO’s military expenditure policy after 1988 and thus if it had got into track of decreasing its military expenditures’. In the similar study made by Roland-Holst and et al. (1988), scenarios are based on the assumption that U.S. reduce its level of military
expenditures to 5.1% GDP as an average for all NATO countries and to 1% GDP as realized in Japan. The former scenario rests on the idea of ascertaining equal sharing of the defense burden by all NATO allies, while the latter assumes that the U.S. engages in substantial unilateral disarmament.
The results of this experiment are portrayed in table-3 and table-4. We conduct our analysis by comparing the base run solution we reached at the first experiment with the solutions obtained from simulations of second experiments and make the evaluation through these comparisons and try to consider the effects of reduction in defense spending.
We can observe from the experiment results as military consumption is decreased, GDP level is slowly increasing by 1.35% in 2005 and by 3.28% in 2007. Accordingly under this experiment the annual rate of GDP increase is calculated 17.54% in 2007 which is higher than the 16.56% value obtained from the base run experiment. In addition
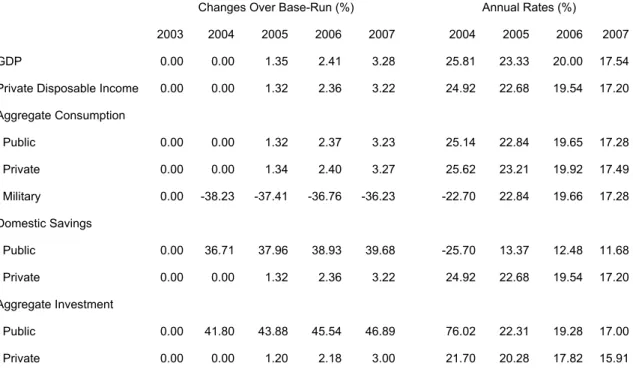
Table 3. Macro Economic Indicators: Experiment 2
Changes Over Base-Run (%) Annual Rates (%)
2003 2004 2005 2006 2007 2004 2005 2006 2007 GDP 0.00 0.00 1.35 2.41 3.28 25.81 23.33 20.00 17.54 Private Disposable Income 0.00 0.00 1.32 2.36 3.22 24.92 22.68 19.54 17.20 Aggregate Consumption Public 0.00 0.00 1.32 2.37 3.23 25.14 22.84 19.65 17.28 Private 0.00 0.00 1.34 2.40 3.27 25.62 23.21 19.92 17.49 Military 0.00 -38.23 -37.41 -36.76 -36.23 -22.70 22.84 19.66 17.28 Domestic Savings Public 0.00 36.71 37.96 38.93 39.68 -25.70 13.37 12.48 11.68 Private 0.00 0.00 1.32 2.36 3.22 24.92 22.68 19.54 17.20 Aggregate Investment Public 0.00 41.80 43.88 45.54 46.89 76.02 22.31 19.28 17.00
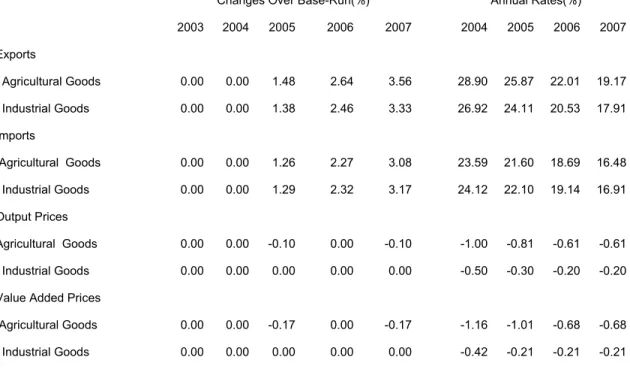
Table 4. Sectoral Economic Indicators: Experiment 2
Changes Over Base-Run(%) Annual Rates(%) 2003 2004 2005 2006 2007 2004 2005 2006 2007 Exports Agricultural Goods 0.00 0.00 1.48 2.64 3.56 28.90 25.87 22.01 19.17 Industrial Goods 0.00 0.00 1.38 2.46 3.33 26.92 24.11 20.53 17.91 Imports Agricultural Goods 0.00 0.00 1.26 2.27 3.08 23.59 21.60 18.69 16.48 Industrial Goods 0.00 0.00 1.29 2.32 3.17 24.12 22.10 19.14 16.91 Output Prices Agricultural Goods 0.00 0.00 -0.10 0.00 -0.10 -1.00 -0.81 -0.61 -0.61 Industrial Goods 0.00 0.00 0.00 0.00 0.00 -0.50 -0.30 -0.20 -0.20 Value Added Prices
Agricultural Goods 0.00 0.00 -0.17 0.00 -0.17 -1.16 -1.01 -0.68 -0.68 Industrial Goods 0.00 0.00 0.00 0.00 0.00 -0.42 -0.21 -0.21 -0.21 to increase in GDP, the experiment results reveal an increase in private disposable income by 1.32% in 2005 and by 3.22% in 2007, as compared to its base run obtained values.
Further on public consumption, private consumption; saving and investment, sectoral export and import results are in accordance with the GDP and private disposable income. Similarity in the volume increase of these variables can also be seen by comparing the following figures.
However the most striking effects of pulling down the military expenditures to 3% GDP level over the analyzed period are related to the public saving and investment. Reduction in military expenditures leads to substantial increases in government investment and savings. Due to the gains realized after shifting factors from Military Administration to public sectors the distortion, 41.80% increase over base run result,
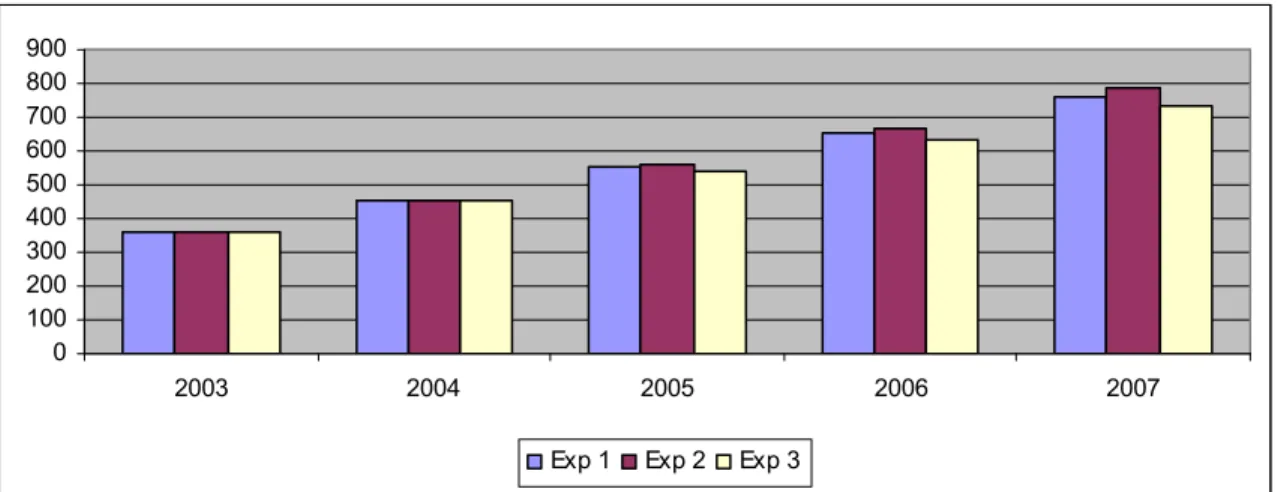
0 100 200 300 400 500 600 700 800 900 2003 2004 2005 2006 2007
Exp 1 Exp 2 Exp 3
Figure 11. Real GDP. 0 100 200 300 400 500 600 700 800 2003 2004 2005 2006 2007
Exp 1 Exp 2 Exp 3
Figure 12. Private Disposable Income.
0 10 20 30 40 50 60 70 2003 2004 2005 2006 2007
Exp 1 Exp 2 Exp 3
government investment are substantial, the gains obtained in government savings are also very important. Reductions in military spending result in sharp increase with 36.71% over the base run in 2004 and gradually to 39.68% in 2007 in government savings. Thus we can interpret that reduction in military expenditures induce the government savings which is already negative towards zero and positive values. This situation is well depicted in figure-14.
4.3 Experiment 3
The third scenario is based on opposite logic while having the same structure as in the first and second experiments. This time logic is focusing on increasing military expenditures pertaining to increasing threat and volume of conflict. The query we are trying to find an answer is now slightly changed but it has the same logic ‘what would likely have happened if Turkey had increased the military expenditures to cope with increasing threats in environment of conflict such as increasing PKK terrorist activities’. Pushing the military expenditures to 7 % GDP level we try to observe the effects of this increase over the time span from 2004 to 2007.
In this section we do our analysis by comparing obtained results in this experiment with the base run solution taking it as a benchmark and make our evaluation through these comparisons and try to consider the effects of increase in defense spending in the same pattern like we do in the analysis of Experiment 2.
The results of this experiment are depicted in table-5 and table-6. It is apparent that as military spending increased by 2.1% GDP share, GDP level is rapidly decreasing by 1.57% in 2005 and 3.79% in 2007. In addition to that, calculated annual rate of GDP
increase is lower than those of both the experiments, being 15.37% in 2007. In the same way, disposable income is decreasing by 1.54% in 2005 and 3.72% in 2007 in the comparison with the base run results.
As we go far down in our investigation, results indicate that it is possible to make generalization including other variables such as public consumption, private consumption, saving and investment, sectoral imports and exports. All of these variables are influenced by approximately same amount by the effects of armament; this fact is evident in figures 11-15.
However the results of this experiment reveal more important movements in the field of prices which are not worth to say in experiment 2. As compared to base run results the output prices of agricultural goods increase by 0.10% in 2006 and 0.21% in 2007; output prices of industrial goods increase by 0.10% in 2005 and in 2007; and value added prices of agricultural goods increase by 0.17% in 2005 and in 2007. Thus under assumptions of this experiment we can say that armament brings with itself price increase.
Not surprisingly, while the decreases in the variables stated above are substantial, in the case of government savings and government investments even greater losses are seen compared to base year solution over the regarding period like we see in the experiment 2. As the results of the experiment reveal, the symmetric movement in the military expenditures result in the consistent discrepancies in both of these variables. For instance we can observe from the results in the table-5 that the public savings are in deterioration which furthers the expansion in negative direction. From the table we infer that they are suffering loss deteriorating each year approximately by the same amount; 42% each year. Consequently this result is further complemented by negative developments in the annual
Table 5. Macro Economic Indicators: Experiment 3
Changes Over Base-Run(%) Annual Rates(%) 2003 2004 2005 2006 2007 2004 2005 2006 2007 GDP 0.00 0.00 -1.57 -2.80 -3.79 25.81 19.78 17.28 15.37 Private Disposable Income 0.00 0.00 -1.54 -2.74 -3.72 24.92 19.23 16.87 15.06 Aggregate Consumption Public 0.00 0.00 -1.54 -2.76 -3.74 25.14 19.36 16.97 15.13 Private 0.00 0.00 -1.57 -2.79 -3.78 25.62 19.67 17.20 15.32 Military 0.00 44.12 41.90 40.15 38.74 80.36 19.36 16.97 15.13 Domestic Savings Public 0.00 -42.37 -42.53 -42.55 -42.50 67.13 15.79 14.27 13.03 Private 0.00 0.00 -1.54 -2.74 -3.72 24.92 19.23 16.87 15.06 Aggregate Investment Public 0.00 -48.24 -49.27 -50.08 -50.72 -35.75 18.14 16.06 14.43 Private 0.00 0.00 -1.40 -2.53 -3.47 21.70 17.19 15.34 13.88
Table 6. Sectoral Economic Indicators: Experiment 3
Changes Over Base-Run(%) Annual Rates(%) 2003 2004 2005 2006 2007 2004 2005 2006 2007 Exports Agrıcultural Goods 0.00 0.00 -1.74 -3.07 -4.13 28.90 21.87 19.00 16.81 Industrial Goods 0.00 0.00 -1.61 -2.86 -3.85 26.92 20.44 17.75 15.72 Imports Agrıcultural Goods 0.00 0.00 -1.47 -2.63 -3.58 23.59 18.32 16.13 14.44 Industrial Goods 0.00 0.00 -1.50 -2.69 -3.66 24.12 18.74 16.51 14.79 Output Prices Agrıcultural Goods 0.00 0.00 0.00 0.10 0.21 -1.00 -0.71 -0.61 -0.41 Industrial Goods 0.00 0.00 0.10 0.00 0.10 -0.50 -0.20 -0.30 -0.10 Value Added Prices
Agrıcultural Goods 0.00 0.00 0.00 0.17 0.17 -1.16 -0.84 -0.68 -0.51 Industrial Goods 0.00 0.00 0.00 0.00 0.00 -0.42 -0.21 -0.21 -0.21
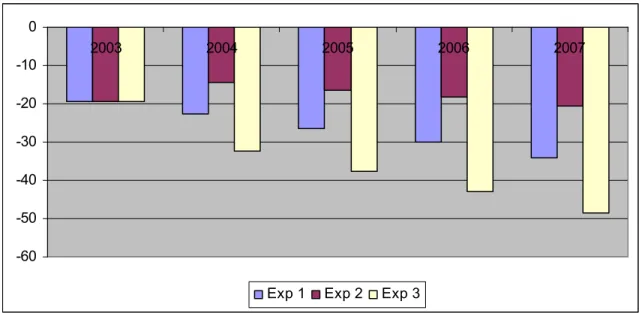
rates. The annual rates of this savings are calculated 13.03% in 2007 which is in average below the realized base run results and results of experiment 2. Accordingly the collapse in government savings draws the investment back. The second significant change in this sense is the decrease in the investment by 48.24% in 2004 and the continuity of this decrease in slowly increasing ratios which becomes 50.72% in 2007. Like in the other variables we see the same situation in annual rates aspect which is reduced in size compared to base run and second experiment. 2004 government transfers to military consumption and diversion of the factors in favor of the military administration is probably the major reason which results in these major consequences. On the other hand turning to the figures 14-15, we can more easily detect the discrepancies in the followed military policies. -60 -50 -40 -30 -20 -10 0 2003 2004 2005 2006 2007
Exp 1 Exp 2 Exp 3
0 10 20 30 40 50 60 2003 2004 2005 2006 2007
Exp 1 Exp 2 Exp 3
CHAPTER 5
SUMMARY AND CONCLUSION
In this study, we attempted to investigate the effects of military expenditures in terms of output, wealth and diversion of income away from public and private sector assuming environment of conflict brings with it high volume of armament and cost on expenditures in general equilibrium model. In that sense model consist of three main phases.
In the first phase, model is used to produce benchmark results calibrating data given in 2003 Social Accounting Matrix into the model and making no other intervention through the simulation process. As a result of this process we obtained the ratio of military expenditures to GDP level as 4.9% which is not so different from the general trend given in the SIPRI Year Book.
In the second phase, trying to find an answer to ‘what would have possibly happened if Turkey had followed NATO’s military expenditure policy after 1988 and thus if it had got into track of decreasing its military expenditures?’ we pulled the ratio of military expenditures to GDP level to 3% in 2004. The results are not so much astonishing. Major consequences are related to government savings and investment together with decreasing military spending. In comparison to base run results in 2007 values public savings increase by 39.68% which seems to continue to increase and public investments increase by 46.895 which also seems to continue to increase while military expenditures declines
in decreasing trend. Consequently the reflections of these results over the GDP, disposable incomes, investment saving deficit, export and import variables are also substantial and in the same direction; GDP increase by 3.28%; disposable income increase by 3.22%; exports and imports increase between 3% and 3.5% in both sectors in 2007 values.
In the third phase, keeping the structure same and reversing the approach this time we try to find an answer to ‘what would likely have happened if Turkey had increased the military expenditures to cope with increasing threats in environment of conflict such as increasing PKK terrorist activities’, pushing the military expenditures to 7% GDP level to observe the effects of increase in military expenditures. Results are consistent with second experiment but being in symmetry. Again the major distortions are revealed in the field of government savings and investment but this time more than those seen in the second one as a consequence of increasing change made in the ratio of military expenditures to GDP level. The discrepancies over the base run result in 2007 values are that public savings decline by 42.37% which seems to continue in following years furthering the expansion in negative values and public investment decrease by 48.24% in the first year and with slowly increasing values reaches 50.72% in 2007. In accordance with these results GDP, disposable income, investment saving deficit, exports and imports also decrease; GDP level decline by 3.79%; disposable income by 3.72%; exports around 4% and imports around 3.6% in 2007 values.
Consequently the results from our experiments indicate that fluctuations in the military expenditures due to political and security need produce significant effects over the Turkish economy. This effect is positive while military expenditures are decreased
and it is negative while expenditures are increased in reverse. For instance with the reductions in military expenditures, the budgetary saving obtained from this reduction become available for government saving and investment thus resulting in the expansion of economy increasing GDP, disposable private income, imports and exports. In the opposite, with the increase in the military expenditures, the shifting budget from government saving to defense spending result in deterioration of the economy decreasing the GDP, disposable income, imports and exports. In that case, the results are not much different from those of the Roland-Holst and et al. (1988) study which indicate that reduction in defense spending leads to substantial increases in GDP and several-fold greater increases in real output and income in private sector. In that point, whole picture reflects the crowding out of aggregate income by increase in military expenditures. However we do not evaluate what the reason behind it or how much Turkey should allocate for military budget leaving it to the scope of other studies and to the politicians. In that sense the model can be best viewed as providing the indications of military expenditures over the Turkish economy.
SELECT BIBLIOGRAPHY
Brauer, Jurgen. 2002. ‘Survey and Review of the Defense Economics Literature on Greece and Turkey: What Have We Learned’ Defence and Peace Economics 13(2):85-107.
Brooke, Anthony and et al. 2003. GAMS. Computer Software.
‘CGETRK 2*2: 2*2 General Equilibrium Model for Turkey, 2003’. Internet, available from http://www.bilkent.edu.tr/~yeldane/econmodel/, accessed on 13 November 2004. Chletsos, Michael and Christos Kollias. 1995. ‘The Demand for Turkish Military Expenditure 1960-1992’, Cyprus Journal of Economics 8(1):64-74.
Çiftçi, Nevzat.1999. Girdap:Turan Yayıncılık
Diao, Xinshen, Roe, Terry and Yeldan, Erinç. 1998. ‘Fiscal Debt Management, Accumulation and Transitional Dynamics in a CGE Model for Turkey’ Canadian Journal of Development Studies 19(2):n.p
Dörtkardeş, İhsan. 13 August 1997. ‘Teröre Kanlı Bilanço: 17 Yılda 32 Bin Kişi Öldü.’(Bloody Result of Terrorism: 32000 People Have Died in 17 Years), Hürriyet. Ersever, Cem. 1998. Kürtler, PKK ve Abdullah Öcalan(Kurds, PKK and Abdullah Öcalan): Ocak Yayınları
Georgiou, G.M., Kapopoulos, P.T. and Lazaretou, Sophia.1996. ‘Modeling Greek-Turkish Rivalry:An Empirical Investigation of Defense Spending Dynamics’, Journal of Peace Research 33(2):229-239.
‘Gümrük Birliği Sürecinde Türkiye Ekonomisinin Gelişme Perspektifleri.’ 1995. Paper presented at the Congress of Industry, held by Chamber of Mechanical Engineers, Ankara, Turkey.
Harrison, G., Rutherford, T. and Tarr, D. 1996. ‘Economic Implications for Turkey of a Customs Union with the European Union.’ Policy Research Working Paper, World Bank, International Economics Department.
Karagol, Erdal and Palaz, Serap. 2004. ‘Does Defence Expenditure Deter Economic Growth in Turkey? A Cointegration Analysis’ Defence and Peace Economics 15(3):289-298.
Kollias, Christos and Stelios Makrydakis. 1997. ‘Is There a Greek-Turkish Arms Race? Evidence from Cointegration and Causality Tests.’ Defence and Peace Economics 8(4):355-379.
Köse, A. and Yeldan, E. 1996. ‘ Çok sektörlü Genel Denge Modellerinin Veri Tabanı Üzernine Notlar: Türkiye 1990 Sosyal Hesaplar Matrisi.’ METU Studies in Development 23(1):59-83.
Le Roux, Len. 2002. ‘The Military Budgeting Process: An Overview’ Paper prepared for the SIPRI/ASDR Workshop on The Military Expenditure Budgeting Process.
Mater, Nadire. 1998. Mehmedin Kitabı.(Book of Mehmet): Metis Yayınları
‘On Structural Sources of the 1994 Turkish Crisis.’ 1997. International Review of Applied Economics 12(3):397-414.
Özdağ, Ümit. 2005. Türkiyede Düşük Yoğunluklu Çatışma ve PKK( Skirmishes and PKK in Turkey): 3ok Yayınları
Roland-Host, David, Robinson, Sherman and Tyson, Laura D’Andrea. 1988. ‘Opportunity Cost of Defense Spending: A General Equilibrium Analysis.’ University of California, Berkeley.
Sezgin, Selami. ‘An Empirical Analysis of Defense-Growth Relationships with a Demand and Supply-side Multi-equation Model: Time Series Evidence From Turkey.’ Paper presented at ‘The Economics of Military Expenditure in Developing and Emerging Economics’ conference at the Middlesex University Business School, London, England, 1998.
Sezgin, Selami and Yıldırım, Jülide. 2001. ‘Symposıum on Defence Economics.’ Paper presented at the Conference on Economics, held in Middle East Technical University, Ankara, Turkey, 2001.
SIS. (1980-2002). Agricultural Structure and Production. State Institute of Statistics Prime Ministry Republic of Turkey.
SIS. (1980-2002). Annual Manufacturing Industry Statistics. State Institute of Statistics Prime Ministry Republic of Turkey.
SIPRI. (1987-2004). World Armaments and Disarmament, SIPRI Yearbook. Oxford: Oxford University Press.
Voyvoda, Ebru and Yeldan, Erinç. 2005. ‘IMF Programmes, Fiscal Policy and Growth: Investigation of Macroeconomic Alternatives in an OLG Model of Growth for Turkey’ Comparative Economic Studies 47:41-79.
Yeldan, Erinç. 1995. ‘Political Economy Perspectives on the 1994 Turkish Economic Crisis: A CGE Modeling Analysis.’ University of Minesota.
Yeldan, Erinç. 1997. ‘Financial Liberalization and Fiscal Repression in Turkey: policy Analysis in a CGE Model with Financial Markets’ Journal of Policy Modeling 19(1): 79-117
APPENDIX A. MATHEMATICAL EQUATIONS
PRICES
Import Prices: Consumers in the domestic market have to pay world price plus tariffs value for the imported goods.
PM im = PWM im . (1+ TM im)
Export Prices: The value, consumers of exports in the foreign market have to pay, includes the Exports tax value collected by the government.
PE ie..= PWE ie . (1- TE ie)
Composite Prices: Consumers have two alternatives to respond their needs; either from imports or domestic market. Being subject to the CES composite commodity technology, demanders tries to minimize the cost.
PC i . CC i= (PDİ DCİ+ PMi Mi). (1+ SALTAX)
Gross Output Prices: Producers are thought to face two options to market their products; exports versus domestic sales. They try to maximize the revenues from both markets.
PX i. XS i = PD i. DC i+ PE i. E i
Net (value added) Prices: Value added price is the net revenue to the producer after deducting the intermediate input costs and producer taxes from the output price.
PVA i= (1-PROTAXi). PX i-
∑
j
(PC j. ΙO i j)
Price Index: It is the benchmark to normalize the system by using weights for each sector.
PINDEX =
∑
i
PRODUCTION TECHNOLOGY
Gross Output Supply: The relationship between primary inputs; labor, L, capital, K, and the outputs is expressed by the help of Cobb-Douglas production function.
XSi = AX i .( K i) Bxi. LD i (1 - Bxi )
Labor Employment: Certain proportion of the profit is delegated Labor factor as wages. W. WD1ST i . LD i = (1- BX i) PVA i . XS i
Capital Employment: Certain proportion of the profit is returned as capital for next production activity.
RK. RKDIST i. K i = BX i. PVA i. XS i
Labor Market: Labor supply is equal to the aggregate of labor demand
∑
i
LD i = LSUP
Capital Market: Capital supply is equal to the aggregate of capital demand.
∑
i
K i = KSUP
TRADE
Gross Output: Because of the imperfect substitutability among goods in the same category, producers try to maximize the revenue by allocating their outputs to both markets; domestic and foreign, being subject to CET function technology.
XS ie = AT ie . (BT ie . E ieRHOT ie + ( 1- BT ie ) . DC ieRHOT ie) 1/ RHOT ie
Export Supply: Optimal Exports to domestic sales ratio is function of CET technology.
( DC E ie ie ) = ( PD PE ie ie .
(
BT BT ie ie) 1− ) [ 1/ (RHOT ie – 1) ]Composite Good: Consumers try to minimize their costs by buying from both markets; as domestic goods and imported foreign goods, being subject to Armington CES function.
CC im = AC im . (BC im . M im(– RHOC im ) + (1- BC im) . DC im (– RHOC im ) ) (– 1 / RHOC im )
technology. ( DC M im im )= ( PM PD im im .
(
BC ) PD im im − 1 ) (1 / (1+RHOC im)Domestic Sales For Nontraded Sectors: It is equal to non-exported outputs. DC ine = XS ine
Composite Good for Nontraded Sectors: It is equal to non-imported domestic sales. CC inm = DC inm
INCOME GENERATION
Private Income: Aggregate private income is equal to income from factor services plus income from government transfers from its tax revenues and finally income/expenditures on lending borrowing from abroad.
Y =
∑
i
[ ( 1-SSTAX ). W. W DIST i . LD i + (1- CORPTAX ) . RK. RKDIST . K i ] +GOVTRANS + NPFI– NPFE
Government Revenue: It is equal to the aggregate of tax revenues.
GREV = TOTPROTAX + TOTSALTAX + TARIFF+ TOTSSTAX + TOTCORPTAX + TOTHHTAX + EXTAX )
Total Production Taxes: Aggregate of taxes imposed on production by government. TOTPROTAX =
∑
i
(PROTAX i . PX i . XS i )
Sale Taxes: Aggregate of taxes collected by government through the sales of domestic and imported goods.
TOTSALTAX =
∑
i
[ SALTAX i .( PD i . DC i + PM i . M i) ]
Tariff: Aggregate of tax revenues placed by government on the imported goods. Tariff =
∑
i
(TM i. PWM i. M i )
Social Security Taxes: Taxes collected from the income of workers. TOTSSTAX =
∑
i
Corporate Taxes: Taxes collected from the income of corporations. TOTCORPTAX =
∑
i
(CORPTAX . RK . RKDIST i. K i)
Total Household Taxes: Aggregate of taxes collected by government from the household income.
TOTHHTAX = HTAX . Y
Export Tax Revenue: Total value of taxes imposed on the exports by government. EXTAX =
∑
i
(TE i . PWE i. E i )
Government Consumption: Value of government consumption by sectors at the proportion of government consumption demand.
PC i . GD i = GLES i . GOVCON
Military Consumption: Value of military consumption by sectors at the proportion of military consumption shares.
PC i . GMC i = GMCRAT i . GMCON
Private Consumption: Value of household consumption by sectors at the proportion of sectoral consumption shares after deducting the savings and taxes.
PC i . CD i = CLES i.( 1- MPS ). Y. (1- HTAX)
Intermediate Uses: Total of commodity usage by sectors as intermediate inputs. INT i =
∑
j
(IO i j. XS j)
Gross Domestic Product: Value of expenditures spent on output goods; as private, government consumption, income/expenditure from trade and on services; as military and investment.
GDP=
∑
i
[ PC i. (CD i + GD i + GMC i +GID i + ID i) + PWE i. E i – PWM i. M i]
SAVING INVESTMENT
Household Saving: Value kept for saving after household taxes deducted. PRSAV = MPS . Y. (1- HTAX)
total revenues.
GSAV = GREV – GOVCON-GMCON - GOVTRANS – GFINT
Public Saving Investment Balance: The difference between government investment and saving.
PISB = GINV – GSAV
Government Transfers: As a ratio of Gross Domestic Production. GOVTRANTS = GVTR . GDP
Gov Investment: As a ratio of Gross Domestic Production. GINV = GIR . GDP
Government Consumption: Consumption on goods as a ratio of Gross Domestic Production.
GOVCON = GCR. GDP
Military Consumption: Consumption on military services as a ratio of Gross Domestic Production.
GMCON =GMR. GDP
Primary Budget Balance: The value at the hand of government, after deducting its consumption on goods, military services, investment and interest payments to domestic banks in transfers from the total revenues.
GPRMBAL = GREV– GOVCON-GMCON – GINV – INTRSRAT . GOVTRANS
Investment Demand by Sector of Origin: Private investment demands at the proportion of investment demand shares for each sector.
PC i . IC i = IDLES i . PRINV
Public Investment Demand by Sector of Origin: Government investment demands at the proportion of investment demand shares for each sector.
PC i. GID i = GIDLES i. GINV
Walras Law Equation: Total saving should be equal to total investments for market equilibrium.
PRSAV + GSAV + FSAV = PRINV+ GINV + DROP
Commodity Balances: For market equilibrium sum of consumption demands, investment demand and intermediate demand should be equal to the supply of composite good.
CC i = INT i + CD i +GD i + GMC i + ID i +GID i
Current Account Balance: Sum of the imports value, net private factor payments to abroad and foreign interest payments to abroad should be equal to sum of the exports value, net private factor incomes to abroad and foreign savings.
∑
im
(PWM im . M im ) + NPFE + GFINT =
∑
ie
APPENDIX B. SOCIAL ACCOUNTING MATRIX
1. Activities 2. Commodities 3.Labor 4.Capital 5.Private 1. Activities Domestic Supply of Dom Sales 2. Commodities Intermediate Input Demands Private Consumption 3.Labor Wages 4.Capital Profits 5.Private Wage Income (NET) Profit Income (NET) 6.Government Net Producer
Taxes VAT and Tariffs Payroll Taxes
Corporate Taxes+Factor Income Household Taxes 7.Private Investment Private Savings used for Priv.
Investment 8. Public
Investment
Private Sav-Inv Surplus 9.ROW Imports Profit Transfers SUM
Production
Expenditures Total Absorption Total Wages Total Profits
Total Private Expenditures 6.Government 7.Private Investment 8. Public
Investment 9.ROW SUM 1. Activities Exports Value of Gross Production 2. Commodities Public Consumption Private Investment Public Investment Aggregate Expenditures
3.Labor Labor Income
4.Capital Capital Income 5.Private Transfers Remittances Private Income 6.Government Remittances Public Income 7.Private
Investment
Private Investment 8. Public
Investment Public Savings
Foreign Resources Public Investment 9.ROW For. Interest Payments on External Debt Foreign Exchange Expenditures SUM Total Public Expenditures Private Investment Public Investment Foreign Exchange Earnings
(Billions TL, 2003)
1.Agriculture 2.Ind & Serv 3.Rural 4.Urban 5.Labor 6.Capital 1. Agriculture 77193632.72 0.00 2. Industry & Services 0.00 432993671.49 3. Rural 14956922.88 21495919.91 4. Urban 15169629.57 227255725.55 5. Labor 20259707.61 107757927.51 6. Capital 28671944.56 140881848.35 7.Private 104425155.13 139043205.91 8.Government 1941731.53 30292284.72 4936154.53 25021327.22 23592480.00 30510587.00 9. Private 10. Public 11.ROW 3838602.06 106495764.94 TOTALS 80999936.15 527683706.05 85968389.31 564510763.64 128017635.13 169553792.91 7.Private 8.Government 9.Private Investment 10. Public
Investment 11.ROW SUM 1. Agriculture 3806303.43 80999936.15 2. Industry & Services 94690034.57 527683706.05 3. Rural 48752378.49 637537.05 117858.37 7772.61 85968389.31 4. Urban 196333069.71 43554930.95 66094192.47 16103215.39 564510763.64 5. Labor 128017635.13 6. Capital 169553792.91 7.Private 113247685.88 8286785.56 365002832.48 8.Government 28370862.00 144665427.00 9. Private 66212050.85 66212050.85 10. Public 20589863.00 -19398942.00 14920067.00 16110988.00 11.ROW 4343866.22 6624215.12 121302448.34 TOTALS 364602090.26 144665427.00 66212050.85 16110988.00 121703190.56